In Part 1 of this series, we detailed the hardware and software architecture of our testing lab, as well as benchmarking methodology and Ceph cluster baseline performance. In this post, we’ll take our benchmarking to the next level by drilling down into the performance evaluation of MySQL database workloads running on top of Red Hat OpenStack Platform backed by persistent block storage using Red Hat Ceph Storage.
Executive summary
-
The HCI Ceph BlueStore configuration showed both ~50% lower average latency, as well as lower 99th percentile tail latency, when compared to the HCI Ceph in FileStore configuration.
-
Red Hat OpenStack Platform and Red Hat Ceph Storage deployed in HCI configuration showed performance parity compared to the decoupled (classic standalone) configuration. Specifically, almost no performance drop was observed while moving from decoupled to HCI architecture.
-
For MySQL write workloads, Ceph BlueStore deployed on an all-flash (NVMe) cluster showed 16x higher TPS, 14x higher QPS, ~200x lower average latency, and ~750x lower 99th percentile tail latency than when deployed on mixed/HDD media.
-
For MySQL read workloads, Ceph BlueStore deployed on an all-flash (NVMe) cluster delivered up to ~15x lower average and 99th percentile tail latency, than when deployed on mixed/HDD media based cluster.
-
Similarly for 70/30 read/write mix workload, Ceph BlueStore OSD deployed on an all-flash (NVMe) cluster showed up to 5x Higher TPS and QPS, when compared to a mixed/HDD media cluster.
MySQL benchmarking methodology
Our MySQL database testing consisted of 10 x MySQL Instances provisioned on top of 10 OpenStack VM instances, keeping the ratio of MySQL database to VM instance as 1:1. Refer to Part 1 for actual VM sizing. Each MySQL database instance was configured to use a 100 GB block device provisioned by OpenStack Cinder from Red Hat Ceph Storage 3.2. The Sysbench OLTP application benchmark was used to exercise the MySQL database. MySQL used the InnoDB storage engine with data and log files stored on Red Hat Ceph Storage block storage.
We tested these workload patterns:
-
100% write transactions
-
100% read transactions
-
70% / 30% (70/30) read/write transactions
We gathered these key metrics from testing:
-
Transactions per second (TPS)
-
Queries per second (QPS)
-
Average latency (ms)
-
99th percentile tail latency (ms)
MySQL InnoDB engine keeps an in-memory cache called the buffer pool. Performance can be directly affected by the ratio of the dataset size to the size of the buffer pool. For example, if the buffer pool is large enough to hold the entire dataset, then most read operations will be served through the in-memory cache and never generate IO.
Because the intention is to benchmark underlying storage (Red Hat Ceph Storage 3.2), we kept the ratio of InnoDB buffer pool to dataset as 1:15 (buffer pool size of 5 GB and dataset size is 75 GB). This ratio ensures that the database cannot fit in system memory, which leads to increased I/O traffic from the InnoDB storage engine to Red Hat Ceph Storage block storage.
Part 1: MySQL write performance
Key takeaways
-
Red Hat OpenStack Platform and Red Hat Ceph Storage, when deployed in HCI configuration, showed performance parity as compared to the decoupled (classic standalone) configuration.
-
The HCI Ceph BlueStore configuration showed both ~50% lower average latency and 99th percentile tail latency when compared to the HCI Ceph FileStore configuration. Similar tests showed a higher write transaction rate, as well as queries per second on HCI Ceph in BlueStore configuration.
-
Ceph BlueStore, when deployed on the all-flash (NVMe) based cluster, showed 16x higher TPS, 14x higher QPS, ~200x lower average latency and ~750X lower 99th percentile tail latency. When performance is paramount for high transactional workloads, Ceph BlueStore together with all-flash (NVMe) hardware is recommended.
Summary
The performance comparison was done across two deployment strategies decoupled (classic) and hyperconverged (HCI), two Ceph OSD backends (FileStore vs. BlueStore), and two media types (mixed/HDD vs. flash).
-
MySQL write TPS and QPS summary
-
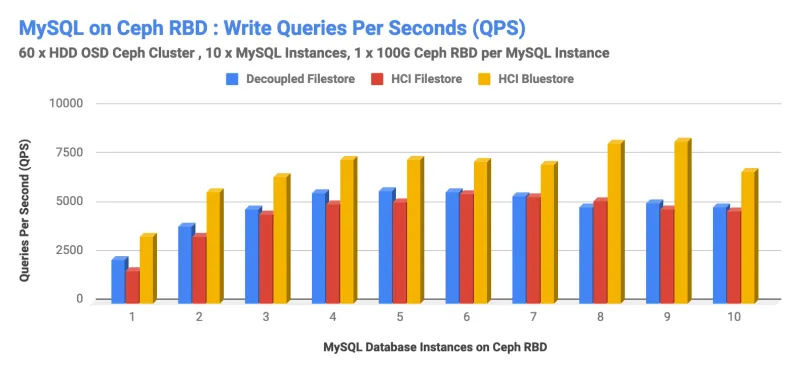
Graphs 1 and 2 show the performance of decoupled FileStore and HCI FileStore to be nearly the same. The performance loss in moving from the decoupled to the HCI architecture that was tested was found to be minimal.
-
BlueStore showed higher write TPS and QPS compared to HCI FileStore. Ceph BlueStore OSD backend stores data directly on the block devices without any file system interface, which improves cluster performance.
However, when running the HCI BlueStore tests on a mixed/HDD cluster, we observed high transactional latencies, due to bottlenecking by higher latencies of spinning drives (refer to appendix for sub-system metrics). As such, write TPS and QPS performance with BlueStore OSD backend on HDDs didn’t scale as we had expected.
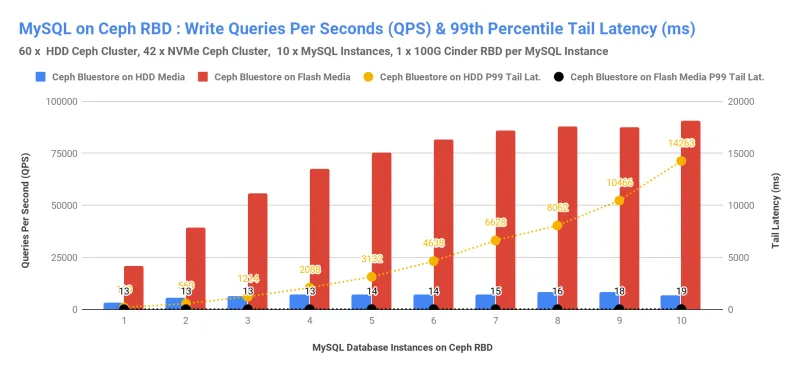
To troubleshoot this further, we did a similar test on an all-flash configuration (see the appendix to this post for the detailed configuration) and witnessed Ceph BlueStore on all-flash (NVMe) configuration deliver improved performance compared to Ceph BlueStore on mixed HDDs (refer appendix) (see graphs 3 and 4). When compared to Ceph BlueStore on mixed/HDD media, Ceph BlueStore on all-flash delivered the following:
-
-
16x Higher TPS
-
14x Higher QPS
-
~200x lower average latency
-
~750x lower 99th percentile latency
BlueStore is a new backend object store for the Ceph OSD daemons developed to fully use the performance of flash media. Hence, it is recommended that small-block, high-transactional workloads (e.g., databases) be deployed on flash media instead of HDDs. Ceph BlueStore on top of flash media is expected to deliver higher performance with substantial lower latencies.

Graph 1

Graph 2
We acknowledge that graphs 3 and 4 do not represent an apples-to-apples comparison with graphs 1 and 2. This test was conducted to gain additional performance insights of running Ceph on an all-flash cluster. These additional tests showed the kind of performance that Ceph BlueStore can deliver in terms of lower latencies and higher transactions per seconds, provided you supply adequate hardware to Ceph.

Graph 3

Graph 4
-
MySQL write average latency and 99th percentile tail latency summary
-
As graphs 3 and 4 show, Ceph BlueStore on all-flash configuration delivered lower latency compared to Ceph BlueStore on mixed/HDDs. Specifically, when compared to Ceph Bluestore on mixed/HDD media, Ceph BlueStore on all-flash delivered
-
-
~200x lower average latency
-
~750x lower 99th percentile latency
Another latency comparison represented in graphs 5 and 6 showed Ceph BlueStore delivers ~50% lower average latency as well as better 99th percentile tail latency compared to FileStore on the exact same hardware (i.e., the HDD-based cluster in this test).

Graph 5

Graph 6
Part 2: MySQL read performance
Key takeaways
-
Ceph BlueStore, when deployed on an all-flash (NVMe) based cluster, delivered up to ~15x lower average latency, as well as lower 99th percentile tail latency, when compared with the mixed/HDD media cluster. When application latency is paramount, Ceph BlueStore together with all-flash (NVMe) hardware is recommended.
-
Red Hat Ceph Storage 3.2 introduces new BlueStore tunable parameters for cache/memory management--namely osd_memory_target and blueStore_cache_autotune. These tunables are designed to deliver better read performance compared to FileStore backend.
Summary
The performance comparison was done across two deployment strategies decoupled (classic standalone clusters) and hyperconverged (HCI), as well as two Ceph OSD backends (FileStore vs. BlueStore) and two media types (mixed/HDD vs. flash)
-
MySQL read TPS and QPS summary
-
HCI BlueStore showed slightly better TPS and QPS performance until 5 parallel load generating instances, compared with the decoupled configuration (graphs 7 and 8). As the number of workload generators increased, there is a minor drop in reading performance with HCI configuration, which could be attributed as the performance loss because of co-location of compute and storage.
-
Ceph FileStore and BlueStore OSD backends showed almost similar read performance for both TPS and QPS for HCI configuration, which is in-line with Ceph baseline read performance mentioned in Part 1. Note that Ceph FileStore uses XFS, which relies on kernel memory management that consumes all the free memory for caching.
BlueStore, on the other hand, is implemented in user space where theBlueStore OSD daemon manages its own cache and thus has a lower memory footprint / smaller cache. This testing was done on Red Hat Ceph Storage 3.0 version; the latest version of Red Hat Ceph Storage (i.e., 3.2) introduces a new option osd_memory_target such that BlueStore backend should adjust its cache size and attempt to cache more. We expect Red Hat Ceph Storage 3.2 to deliver better read performance compared to FileStore.
-

Graph 7
 Graph 8
-
MySQL read average latency and 99th percentile tail latency summary
-
As graphs 9 and 10 show, the average as well as 99th percentile latencies across different configurations more or less stayed the same. This is inline with our expectations, as all 3 cluster configurations ran on the same hardware, but the software was deployed differently (decoupled vs. HCI and FileStore vs. BlueStore backends). As expected, latencies on spinning media were found to be higher, which graph 11 shows. Thus, if you are designing an infrastructure for latency sensitive applications, you should consider using flash media as it can reduce workload latencies.
-
 Graph 9

Graph 10
We acknowledge that graph 11 does not represent an apples-to-apples comparison. However, this test was conducted to gain additional performance insights into running Ceph on an all-flash cluster (refer appendix for detailed configuration). These additional tests showed that Ceph BlueStore on all-flash (NVMe) configuration delivered significantly lower latencies compared to Ceph BlueStore on mixed/HDD media. As such Ceph BlueStore on all-flash (NVMe) delivered up to ~15x lower average and better 99th percentile tail latency. Therefore, Ceph BlueStore backend can deliver lower average and tail latencies to database applications like MySQL.

Graph 11
Part 3: MySQL 70/30 read/write mix performance
Key takeaways
-
When compared to Ceph BlueStore on mixed/HDD media, Ceph BlueStore on all-flash media delivered up to:
-
5x higher TPS and QPS
-
~46x lower average latency
-
~216x lower 99th percentile tail latency
-
Summary
The third iteration includes 70/30 read/write mix database workload test done across two deployment strategies (decoupled vs. HCI), two Ceph OSD backends (FileStore vs. BlueStore), and two media types (HDD vs. Flash).
-
MySQL 70/30 read/write mix TPS and QPS summary
-
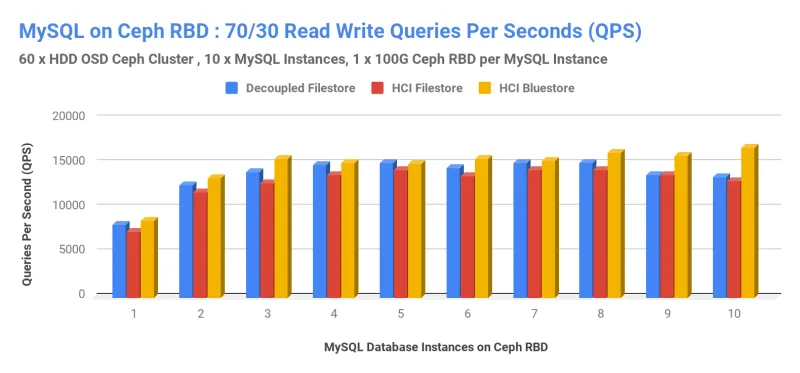
Graphs 12 and 13 show that the HCI BlueStore configuration delivered slightly better TPS and QPS when compared with FileStore HCI and decoupled configurations. This 70/30 read/write mix performance was also found to be in line with the previous tests (see graphs 1, 2, 7, and 8).
-
The performance bottleneck on HCI BlueStore configuration was a combination of the higher latencies induced by spinning media and the lack of the Linux kernel page cache subsystem to the userspace BlueStore subsystem. For the latter, Red Hat Ceph Storage 3.2 has introduced features (mentioned previously) to improve memory/caching of BlueStore OSDs.
-

Graph 12

Graph 13
To isolate spinning media’s latency as the major bottleneck, we did a similar test on an all-flash (NVMe) configuration (refer appendix for detailed HW configuration) and witnessed Ceph BlueStore on all-flash configuration delivered performance improvements compared to Ceph BlueStore on mixed/HDDs. We acknowledge that graphs 14 and 15 do not represent an apples-to-apples comparison with graphs 12 and 13, but this test was conducted to gain additional performance insights of running Ceph on an all-flash cluster. As such, these additional tests showed that Ceph BlueStore backend can deliver lower latencies and higher transactions per seconds, provided you supply adequate hardware to Ceph. Ceph BlueStore on all-flash media (NVMe) delivered up to 5x Higher TPS and QPS for 70/30 read/write mix workload.

Graph 14

Graph 15
-
MySQL 70/30 read/write mix average latency and 99th percentile tail latency summary
-
As graph 16 shows, HCI BlueStore showed slightly better average latency compared to FileStore configurations. On the other hand, P99 tail latency on HCI bluestore was found to be slightly higher compared to FileStore configurations. Based on our tests and observations, we believe HCI BlueStore configuration could have delivered even better latencies if HDDs weren't bottlenecked. Underlying spinning media were found to be the primary bottleneck for higher latencies.
-

Graph 16

Graph 17
-
Graphs 12, 13, 16, and 17 raise some fundamental questions, including:
-
Latencies seem too high. Can we control them?
-
Can Ceph handle low latency/high transaction applications?
-
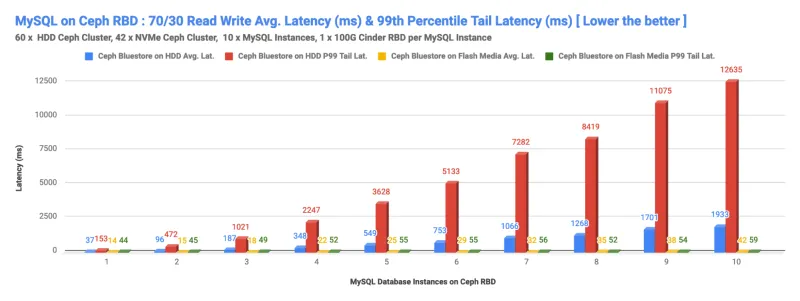
To answer these questions, we did an almost similar test on an all-flash cluster (see the appendix to this post for a detailed hardware configuration) and witnessed that Ceph BlueStore on all-flash cluster delivered significant lower latencies compared to Ceph BlueStore on HDDs. For 70/30 read/write database workloads, Ceph BlueStore on all-flash cluster delivered up to ~46x lower average and upto ~216x lower 99th percentile tail latency as graph 18 shows.
We acknowledge that graph 18 does not represent an apples-to-apples comparison, but this test was conducted to gain additional performance insights of running Ceph on all-flash cluster. This test showed that Ceph BlueStore backend can deliver lower average and tail latencies to database applications like MySQL, provided you supply Ceph adequate hardware.

Graph 18
Appendix
All-flash cluster configuration
|
Ceph OSD All Flash Nodes Configuration |
6 x Cisco UCS C220-M5 2 x Intel Xeon Platinum 8180 (28c@2.5 GHz) 7 x 4TB P4500 NVMe 1 x 375G Intel Optane P4800 192 GB 2 x 40GbE RHEL 7.6, Red Hat Ceph Storage 3.2, Red Hat OpenStack Platform 13.0 |
Mix Media/HDD cluster configuration
|
Ceph OSD Mix Media/HDD Configuration |
5 x DellEMC PowerEdge R730xd 2 x Intel Xeon E5-2630 v3 (8xcore@2.40GHz) 12x6TB SATA HDD 7.2K RPM 1x800G Intel P3700 NVMe 256 GB, 2x10GbE RHEL 7.5, Red Hat Ceph Storage 3.2, Red Hat OpenStack Platform 13.0 |
Sub-system metrics
The Subsystem metrics captured during HCI BlueStore Write and Read test show spinning media is limited by high latencies for both write and read MySQL database workload. Media latency is inversely proportional to the application performance. The higher the latency on disk drives, the lower the TPS/QPS performance on the database.

Sull'autore
Altri risultati simili a questo
Introducing OpenShift Service Mesh 3.2 with Istio’s ambient mode
Friday Five — January 30, 2026 | Red Hat
Data Security 101 | Compiler
Technically Speaking | Build a production-ready AI toolbox
Ricerca per canale
Automazione
Novità sull'automazione IT di tecnologie, team e ambienti
Intelligenza artificiale
Aggiornamenti sulle piattaforme che consentono alle aziende di eseguire carichi di lavoro IA ovunque
Hybrid cloud open source
Scopri come affrontare il futuro in modo più agile grazie al cloud ibrido
Sicurezza
Le ultime novità sulle nostre soluzioni per ridurre i rischi nelle tecnologie e negli ambienti
Edge computing
Aggiornamenti sulle piattaforme che semplificano l'operatività edge
Infrastruttura
Le ultime novità sulla piattaforma Linux aziendale leader a livello mondiale
Applicazioni
Approfondimenti sulle nostre soluzioni alle sfide applicative più difficili
Virtualizzazione
Il futuro della virtualizzazione negli ambienti aziendali per i carichi di lavoro on premise o nel cloud
