Opening the Pandora Box with Observability - Blog Series
The Five Pillars of OpenShift Observability
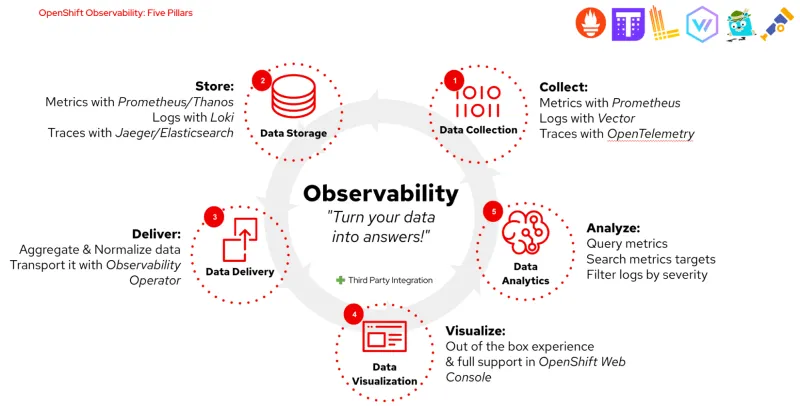
Red Hat OpenShift Observability aims at turning your data into answers. Not only are we working toward facilitating metrics, traces, and logs collection/storage, but also to aggregate them, normalize them, transport them in a flexible way - as well as to assess the health of your cluster(s) with intuitive and efficient user interfaces. A summary of our current offering is provided in the diagram below.
With the OpenShift Monitoring 4.12 and Logging 5.6 releases, we continuously work toward delivering a unified, consistent, and simplified Observability experience across any footprint: cloud, on-prem, and edge - putting equal emphasis on all the five pillars of Red Hat OpenShift Observability: (i) Data Collection, (ii) Data Storage, (iii) Data Delivery, (iv) Data Visualization, and (v) Data Analytics. In the next section, let’s take a closer look at the features included in the upcoming releases and what, as users, you can expect next.

What are the problems you can now solve with Observability?
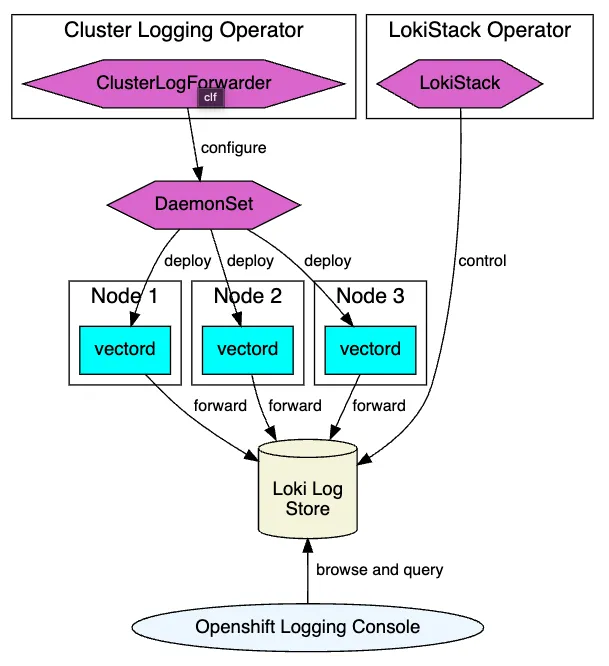
From a Data Collection point of view, with Logging 5.6, Vector - as an alternate collector to Fluentd - is now GA. For an overview of the benefits coming from adopting Vector, take a look at our Logging 5.5 release blog. Vector further consolidates our OpenShift Logging Architecture, providing users with great flexibility (see flowchart below). Given its scalability, vendor-neutrality, flexible configuration options, and less memory consumption, Vector makes collecting, transforming, and sending logs, metrics, and events very easy.

From a Monitoring standpoint, to improve data consistency in the collection phase, Thanos Querier is now being employed as backend to get metrics for the prometheus-adapter (e.g., prometheus-adapter CPU and RAM time series). Prior to this, Platform Prometheus was used. Because of this specific design, users would receive metrics from two different Prometheus instances, which, not having replicated data, might have provided different results.
In regard to Data Storage, with Logging 5.6 we have exposed stream-based retention capabilities in the Loki Stack. For stream-based retention, retention in Loki has always been global for a cluster and deferred to the underlying object store. With Loki v2.3.0, Loki can do retention through the Loki Compactor, and can enable retention configuration per tenant and per stream.
With OpenShift Monitoring 4.12, users have now the option to specify topology spread constraints for Prometheus, Alertmanager, and Thanos Ruler - improving the overall Data Storage experience. By having better control on how pods are spread across users’ clusters, the protection against node or zonal failures is strengthened. Pod topology spread constraints are suitable for controlling pod scheduling within hierarchical topologies where nodes are spread across different infrastructure levels, such as regions and zones within those regions. Additionally, by being able to schedule pods in different zones, you can improve network latency in certain scenarios.
Along with this feature, admins can now also create new alerting rules based on platform metrics, improving the management of alert rules. With OpenShift Monitoring 4.12, this feature is available in Tech Preview.
What about data aggregation, normalization, and transportation? With the Logging 5.6 release, you can now benefit from the support provided for forwarding logs to Splunk. In 2022, not only have we provided support for forwarding logs to Google Cloud Logging, but also included CloudWatch log forwarding add-on, supporting STS installations. These features make the overall Logging Data Delivery experience more customizable, thus more versatile for users and their use cases.
From a Data Visualization perspective, with OpenShift 4.12, logs can now also be explored via the Developer Perspective of the OpenShift Web Console. Under the Observe > Aggregated Logs tab, you can easily search, filter, and visualize logs by severity and quickly identify issues related to your cluster(s). Predefined filters, such as pod and container, have also been added to facilitate the search of logs. Take a look at the demo for a snapshot of these new features.
Along with these new logging capabilities, in the OpenShift Web Console we now also support Alertmanager’s negative matchers for silencing alerts. This new feature provides greater flexibility to Web Console users when it comes to managing silences. The demo below provides an overview of this functionality in the OpenShift Web Console.
With every release, we also keep working toward improving user navigation. With OpenShift 4.12, Web Console users can now easily make use of runbooks URLs for alerts via the Alerting UI. This means that if an alert includes a runbook_url label, users will be able to access the runbook information by clicking on the alert and rapidly address issues. Briefly, this new feature helps reduce the time spent on debugging activities - facilitating interactive Data Analytics. Moreover, from a logging perspective, you can now also add the OpenShift cluster ID to log records to uniquely identify clusters in aggregated logs, increasing the control that you have on the data.
What are we planning next for Observability?
We are working on emphasizing all five pillars of Red Hat Observability and gradually moving away from siloed observability pillars. As we acknowledge the importance of providing a customizable Observability experience, our magic formula continues to be flexibility. That is why we are expanding third party integration opportunities.
Along with establishing partnerships, we aim at extracting value from all observability signals. To achieve this, we are working on a series of initiatives, including providing log-based alerts and enhancing the Dashboards UI in the OpenShift Web Console. Briefly, we are planning to deliver a 360-degree OpenShift Observability experience, where all observability pillars are complementary to one another.
Are you curious to learn more about our roadmap? Do you need more information on how to open the Pandora Box with Observability? Interested in learning more about Data Visualization and Analytics opportunities? Do not hesitate to get in touch with Red Hat’s Field Organization for more information and support or drop us an email for any questions you may have on the upcoming features. Stay tuned for more blogs and welcome aboard to our new OpenShift Observability journey!
Sugli autori
Roger Florén, a dynamic and forward-thinking leader, currently serves as the Principal Product Manager at Red Hat, specializing in Observability. His journey in the tech industry is marked by high performance and ambition, transitioning from a senior developer role to a principal product manager. With a strong foundation in technical skills, Roger is constantly driven by curiosity and innovation. At Red Hat, Roger leads the Observability platform team, working closely with in-cluster monitoring teams and contributing to the development of products like Prometheus, AlertManager, Thanos and Observatorium. His expertise extends to coaching, product strategy, interpersonal skills, technical design, IT strategy and agile project management.
Vanessa is a Senior Product Manager in the Observability group at Red Hat, focusing on both OpenShift Analytics and Observability UI. She is particularly interested in turning observability signals into answers. She loves to combine her passions: data and languages.
Jamie Parker is a Product Manager at Red Hat who specializes in Observability, particularly in the Logging and OpenStack areas. At Red Hat, Jamie works with organizations and customers to learn about their needs within the ever changing Observability landscape, and based on their feedback, helps to guide upcoming products within the Red Hat Observability Platform. Jamie enjoys sharing lessons learned to the community by frequently speaking at meetups and conferences, and by blogging.
Altri risultati simili a questo
Registration is now open for Red Hat Summit 2026
Key considerations for 2026 planning: Insights from IDC
When Should Data Die? | Compiler
Data-baeses | Compiler: Stack/Unstuck
Ricerca per canale
Automazione
Novità sull'automazione IT di tecnologie, team e ambienti
Intelligenza artificiale
Aggiornamenti sulle piattaforme che consentono alle aziende di eseguire carichi di lavoro IA ovunque
Hybrid cloud open source
Scopri come affrontare il futuro in modo più agile grazie al cloud ibrido
Sicurezza
Le ultime novità sulle nostre soluzioni per ridurre i rischi nelle tecnologie e negli ambienti
Edge computing
Aggiornamenti sulle piattaforme che semplificano l'operatività edge
Infrastruttura
Le ultime novità sulla piattaforma Linux aziendale leader a livello mondiale
Applicazioni
Approfondimenti sulle nostre soluzioni alle sfide applicative più difficili
Virtualizzazione
Il futuro della virtualizzazione negli ambienti aziendali per i carichi di lavoro on premise o nel cloud


