
A simple example - No Shut, No Problem
Since the announcement of Event-Driven Ansible, I cannot stop thinking about potential use cases. Can I get events to automate scaling? Could I use a filesystem event to trigger filesystem integrity checks? Could I get a slackbot to trigger my choice of heavy metal playlist based on a “mood” event? It's all possible! But let’s not go too crazy, not yet.
I started having a look at the fantastic work that one of our engineers, Nilashish Chakraborty has been doing around network telemetry and Ansible. This led me down the path to explore network events and what I could potentially do with something like Event-Driven Ansible. So let’s start with a super simple interface example.
Reaching out to the team at Arista, we started discussing and looking at the mechanisms they are using to get telemetry data. With Arista we are able to use gNMI, gNMI is an open source protocol specification created by the OpenConfig working group that is used to stream data to and from network devices. The OpenConfig working group operates as an open source project with contributions from network operators, equipment vendors in providing vendor-neutral software to manage network devices. I configured gNMI on my Arista switches and queried the interface with the gNMI client on my machine to make sure I was able to get what I needed.
…
! Command: show running-config
! device: arista01 (vEOS-lab, EOS-4.29.0.2F)
…

!
management api gnmi
   transport grpc default
   !
   transport grpc eos
   provider eos-native
!
…
Running configuration on Arista EOS
With my switches configured to allow gNMI, I used my gNMIc client on my machine to test a subscription for events.
Term> gnmic -a 192.168.11.5:6030 -u admin -p ansibleIScool --insecure subscribe --path \
  "/interfaces/interface[name=Ethernet1]/state/admin-status"
This allows us to connect and view the telemetry data that's being streamed. I subscribed just to the admin-status of the ethernet port; however, you could subscribe to whatever data is relevant to you.
{
  "source": "192.168.11.5:6030",
  "subscription-name": "default-1670407121",
  "timestamp": 1670402814238747205,
  "time": "2022-12-07T10:46:54.238747205+02:00",
  "updates": [
    {
      "Path": "interfaces/interface[name=Ethernet1]/state/admin-status",
      "values": {
        "interfaces/interface/state/admin-status": "UP"
      }
    }
  ]
}
Output from gnmic command
Note: If you are not aware of what capabilities are available for you on your chosen platform, you can also use the gNMIc client to check this:
Term> gnmic -a 192.168.11.5:6030 -u admin -p ansibleIScool --insecure capabilities
gNMI version: 0.7.0
supported models:
  - openconfig-keychain-types, OpenConfig working group, 0.2.0
  - arista-sampling-notsupported-deviations, Arista Networks, Inc.,
  - openconfig-openflow-types, OpenConfig working group, 0.2.0
…
Now that we have this streaming, we need to get this data to some kind of event source that we can use with Event-Driven Ansible. I decided I would like to use Kafka for this and I would use Telegraf to consume the telemetry data and send it to Kafka as an output.

I configured Telegraf to connect to the gNMI and forward the telemetry to my Kafka topic:
…
  [[inputs.gnmi.subscription]]
    name = "Ethernet1"
    origin = "openconfig"
    subscription_mode = "sample"
    path = "/interfaces/interface[name=Ethernet1]/state/admin-status"
    sample_interval = "2s"
…
[outputs.kafka]
    brokers = ["192.168.11.49:9092"]
    topic = "network"
…
If we have a look at my Kafka topic, and see what messages are coming in we can see that we are receiving the desired information:
… <on my Kafka System>

[kafka ~]# /opt/kafka/bin/kafka-console-consumer.sh --topic network --from-beginning --bootstrap-server localhost:9092
…

{"fields":{"admin_status":"UP"},"name":"Ethernet1","tags":{"host":"influx.prometheus.io","name":"Ethernet1","path":"","source":"192.168.11.5"},"timestamp":1670440660}

{"fields":{"admin_status":"UP"},"name":"Ethernet1","tags":{"host":"influx.prometheus.io","name":"Ethernet1","path":"","source":"192.168.11.5"},"timestamp":1670440660}

{"fields":{"admin_status":"UP"},"name":"Ethernet1","tags":{"host":"influx.prometheus.io","name":"Ethernet1","path":"","source":"192.168.11.5"},"timestamp":1670440660}

…
With these events in Kafka, I can now create my Ansible Rulebook and trigger remediation for the desired steps to respond to this. I can run ansible-rulebook and we can see how it triggers based on the admin_status of the port.
---

- name: Port State Event from Arista

  hosts: all

  sources:
   - ansible.eda.kafka:
       host: 192.168.11.49
       port: 9092
       topic: network

  rules:
   - name: Test
     condition: event.fields.admin_status == "DOWN"
     action:
       run_playbook:
        name: bring-her-up.yml
Port-Status Rulebook
[localhost]$ ansible-rulebook --rulebook port_status.yml -i inventory.yaml --verbose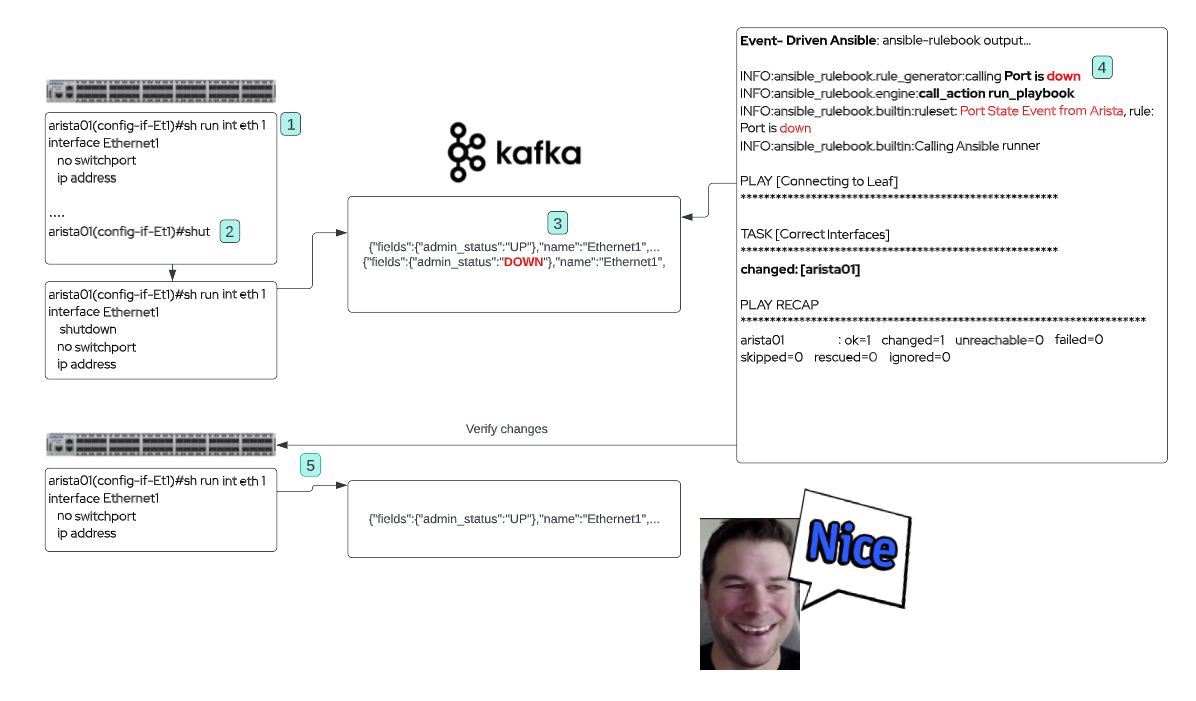
So, with Event-Driven Ansible we are able to respond to events we gather from things like network telemetry. Not only could we use this for simple remediation tasks but we could expand this further with adding ITSM integration or perhaps automated troubleshooting and awareness to events on the network. I think that is pretty slick!
Arista has created an awesome source plugin that we can use instead of Telegraf and Kafka. Daniel Hertzberg and Julio Perez really grasped Event-Driven Ansible concepts and created this magical source plugin in a week. This plugin utilizes NATS, and if you are like me and haven't heard of NATS, It is similar to Kafka in the sense that it is a messaging queue, but there are some differences and you can read up a bit more about them here. This plugin simplifies and reduces the toolset needed to get all-important telemetry data to ansible-rulebook.
Watch for another blog that is coming soon around using the Arista source plugin and a juicy network automation use case.
Call to Action
- Check out the Getting Started with Event-Driven Ansible training
- Visit the Event Driven Ansible web page
- Check out the Event-Driven Ansible playlist on YouTube
- Check out the Best of AnsibleFest 2022
- Try Ansible Automation Platform free for 60 days
Sull'autore
Altri risultati simili a questo
Introduzione a OpenShift Service Mesh 3.2 con la modalità ambient di Istio
Introduzione a OpenShift Service Mesh 3.1
Untangling Networks | Compiler
Ricerca per canale

Automazione
Novità sull'automazione IT di tecnologie, team e ambienti

Intelligenza artificiale
Aggiornamenti sulle piattaforme che consentono alle aziende di eseguire carichi di lavoro IA ovunque

Hybrid cloud open source
Scopri come affrontare il futuro in modo più agile grazie al cloud ibrido

Sicurezza
Le ultime novità sulle nostre soluzioni per ridurre i rischi nelle tecnologie e negli ambienti

Edge computing
Aggiornamenti sulle piattaforme che semplificano l'operatività edge

Infrastruttura
Le ultime novità sulla piattaforma Linux aziendale leader a livello mondiale

Applicazioni
Approfondimenti sulle nostre soluzioni alle sfide applicative più difficili
Virtualizzazione
Il futuro della virtualizzazione negli ambienti aziendali per i carichi di lavoro on premise o nel cloud