Event-driven automation is at the core of automating your emergency response, reducing reaction times to as close to real-time as possible. It’s also at the center of a Self-Healing Infrastructure, enabling consistency and efficiency in lifecycle, content and compliance management across a hybrid cloud infrastructure.
In the first article in this series, we outlined the difference between basic automation and event-driven automation. Following up in our second article, we then defined what the common architectural components consist of, and how we can use a combination of different technologies to create a solution such as this. Now, we will take a deeper look into an example architecture that could be used in your industry, and further outline how to construct this solution within your organization.
Basic architecture
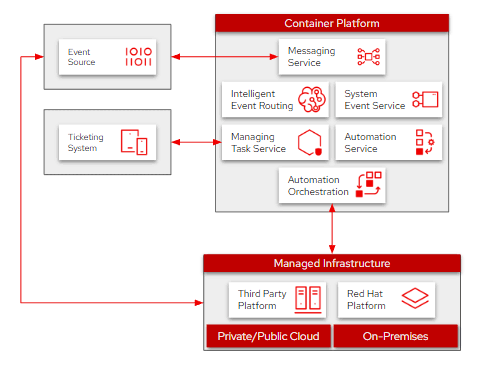
We’ll briefly outline the main components in the architectural map (Fig. 1). These components were also covered in more detail in the second article mentioned earlier, so if you need more detail and haven’t read that yet, feel free to take a quick read now (but don’t forget to come back!).

Fig. 1 - Event-driven architectural map
In that post, we used the example of a vulnerability that’s been found, needing remediation across your hybrid infrastructure. The event is received from the source, prioritized by intelligent routing and logged by your ticketing system. Then, the automated remediation of this vulnerability is sent out across the managed infrastructure by the automation orchestrator. We won’t delve too deep into those details here, so if you need a moment to read back, please do.
For building this architecture, we’ll begin as always, with the event source. This is your main component for finding issues that may exist in your environment. Oftentimes, we find this is already available for a lot of our users; it’s pretty common to already have some source set up to trigger an alert email delivery to a system administrator when a problem occurs. However, it often ends there, and the sysadmin now has to manually remediate the issue.
We then have the actual infrastructure being managed, which, for this specific solution, can be made up of Red Hat and non-Red Hat systems. It can be deployed on-premises, in a public or private cloud, or even a hybrid combination, depending on what your current infrastructure looks like. This gives you the flexibility to manage these events across your entire hybrid cloud estate without needing to replicate this solution and double or triple your workload. Furthermore, in this architecture we have a container platform that hosts all of the messaging topics, event microservices, intelligent router, data stores and the automation controller. And then finally, we have the ticketing system where the event tracking will be logged for later management, logging and reporting.
Network map
Within the networking map (Fig. 2), let’s look more closely at how each component communicates.

Fig. 2 - Event-driven networking map
Once again starting at the event source, this needs to be able to communicate with the infrastructure being managed. In addition to communicating with the main infrastructure, it needs to be able to send a message into a pipeline of events; in this specific architecture, we’re using Red Hat AMQ as our events topic. In this same chain, the events topic will in return need to be able to talk to the automation orchestrator to capture event execution information to pass along to the ticketing system later on.
In addition to the events topic, we also have a few other messaging pipelines handled by AMQ (create the task, invoke automation and automation results listener). Each of these will be communicating with the services layer which will handle system events, task management, automation invocation and automation results tracking. These services will also be required to communicate with the intelligent router, which will handle the prioritization based on built-in logic set by your organization. And finally, in this network we include the task and execution stores that hold the data being transacted upon throughout these events.
The Manage Task microservice will need to log information into the ticketing system, which isn’t required to be on an isolated network, but is depicted as such to clarify it only needs to communicate with that service, and not the entire architecture. Similarly, the Automation Results service will communicate with both the orchestrator and the results listener, but it’s not required for an isolated network if you want to simplify things in your own implementation.
Data map
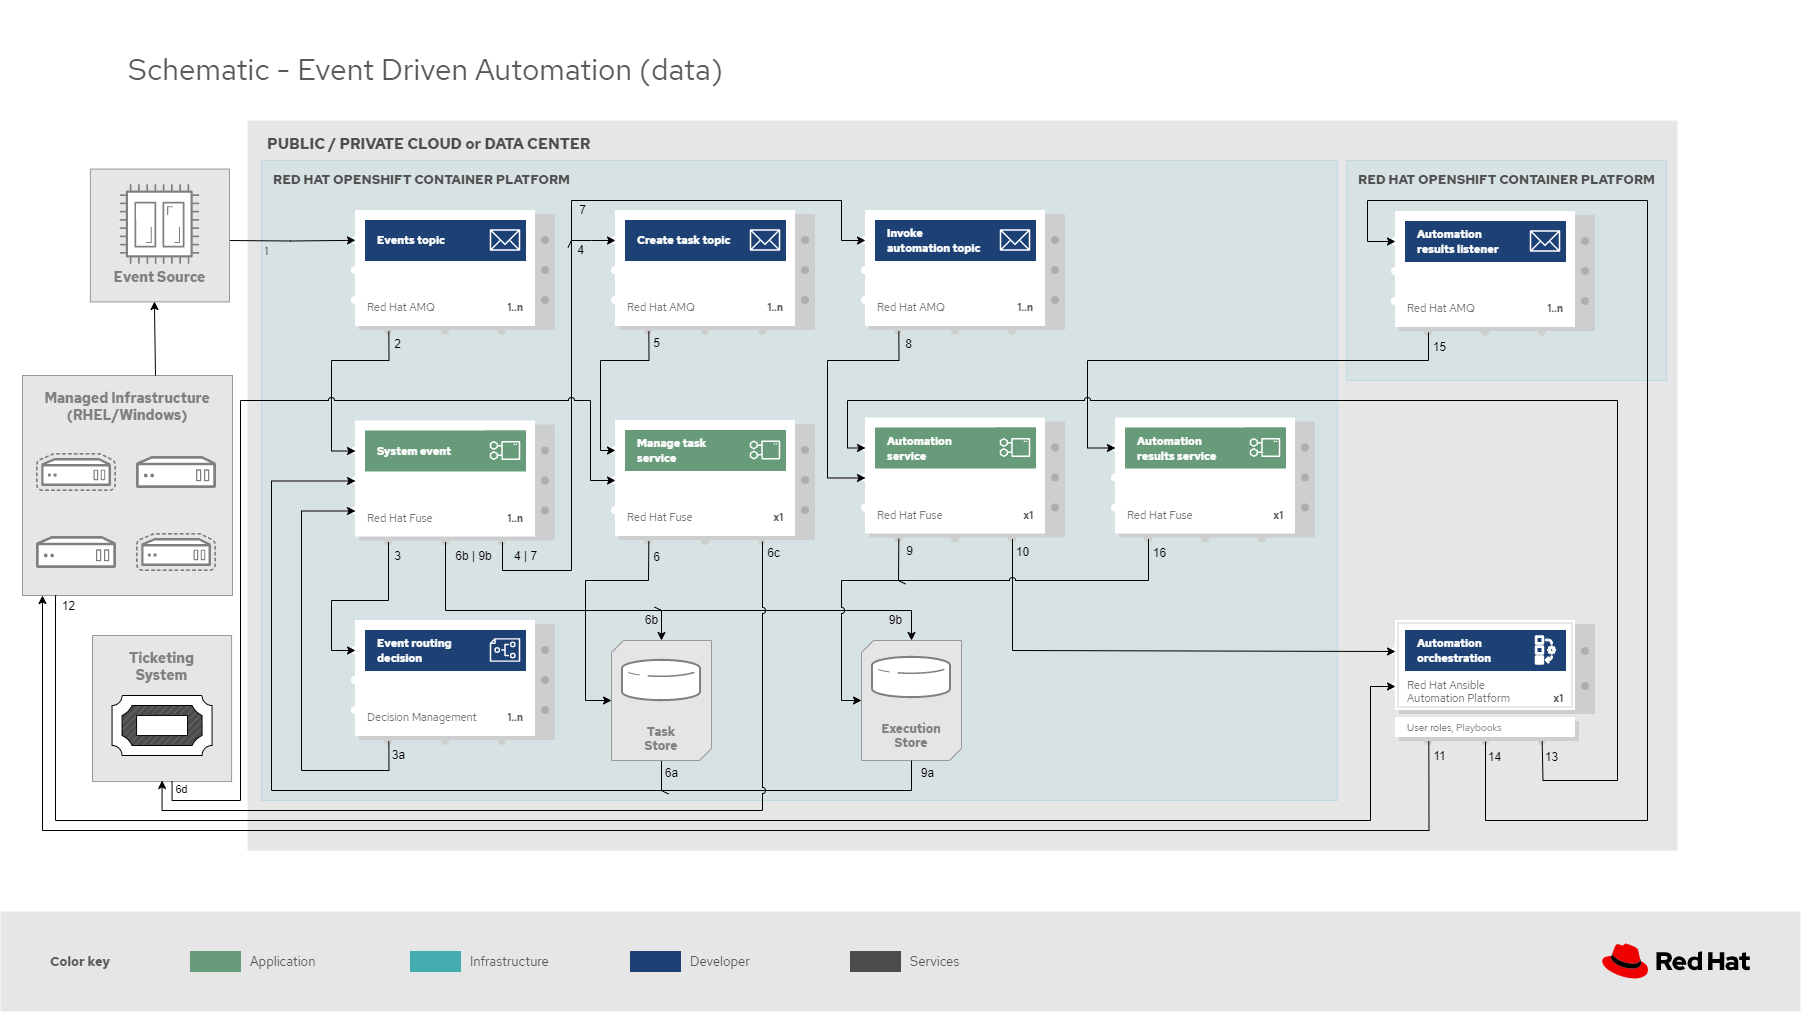
Finally, we’ll navigate through the data flow (Fig. 3) of this solution, which is similar to the earlier recap, but now we’re looking at the physical components that make up this solution:

Fig. 3 - Event-driven data flow
An event is received at the event source which invokes[1] the event message at the events topic which will, in turn, trigger[2] the system event service handling each event. This system event then travels[3] through the event routing decision, which will prioritize each event received, particularly in a situation where multiple events are received simultaneously. Once prioritized, the system event service queues[4], [7] the next set of messages in the create task and invoke automation topics. The create task message then triggers [5]the manage task service to update[6] the task store and the ticketing system with the new status. The invoke automation message triggers [8] the automation service, which will update [9] the execution store followed by passing[10] the event information along to automation orchestration.
The orchestrator, Red Hat Ansible Automation Platform, combines any similar tasks, compiles the playbooks necessary for each specified set of systems being managed and runs[11] those plays on the managed infrastructure. Once run, it receives [12] the results on all successes/failures, and those results are messaged [13], [14] to the automation service and the automation results listener. This triggers[15] the automation results service to send [16] the event results back through each chain, updating the task and execution stores, as well as the ticketing system along the way. While all this is happening, more events are coming through the channel, continuing to be prioritized within the intelligent router, combining similar tasks at the orchestrator and updating in each of the stores and in the ticketing agent. There’s no requirement for human intervention unless multiple attempts have been made without successful correction, which should be an uncommon occurrence.
I hope this short sequence of learning how to elevate your automation solutions with event-driven technology has been helpful as we conclude our three-part series. If you haven’t already, take a look at how our customers are using event-driven technologies in their industry. Additionally, the Red Hat Portfolio Architecture Center has an entire catalog where you can discover many other solutions that are all built off of successful customer deployments just like this.
Sull'autore
Camry Fedei joined Red Hat in 2015, starting in Red Hat's support organization as a Support Engineer before transitioning to the Customer Success team as a Technical Account Manager. He then joined the Management Business Unit in Technical Marketing to help deliver a number of direct solutions most relevant to Red Hat's customers.
Altri risultati simili a questo
Announcing Ansible Automation Platform 2.4 end of Maintenance Support
Enable intelligent insights with Red Hat Satellite MCP Server
Technically Speaking | Taming AI agents with observability
You Can't Automate The Fire | Code Comments
Ricerca per canale
Automazione
Novità sull'automazione IT di tecnologie, team e ambienti
Intelligenza artificiale
Aggiornamenti sulle piattaforme che consentono alle aziende di eseguire carichi di lavoro IA ovunque
Hybrid cloud open source
Scopri come affrontare il futuro in modo più agile grazie al cloud ibrido
Sicurezza
Le ultime novità sulle nostre soluzioni per ridurre i rischi nelle tecnologie e negli ambienti
Edge computing
Aggiornamenti sulle piattaforme che semplificano l'operatività edge
Infrastruttura
Le ultime novità sulla piattaforma Linux aziendale leader a livello mondiale
Applicazioni
Approfondimenti sulle nostre soluzioni alle sfide applicative più difficili
Virtualizzazione
Il futuro della virtualizzazione negli ambienti aziendali per i carichi di lavoro on premise o nel cloud
