With the release of Red Hat Enterprise Linux (RHEL) 8.5, we continue our efforts to harden performance tooling, listen to customer feedback and improve our workload tuning recommendations. Specifically in 8.5, we are announcing:
-
The ability to scale Performance Co-Pilot to 1,000 nodes for performance metric collection in large environments.
-
systemd Journal Integration in the Web Console Performance Metrics page to help you better answer the question of “Which application is causing my performance problems?”
-
Improved SQL Server performance through the introduction of updates to our TuneD profile.
Let’s take a quick look at each of these features!
Performance Co-Pilot scaling
With the release of RHEL 8.5, we have rebased Performance Co-Pilot (PCP) to 5.3.1. This release allows for better scalability and we are now providing guidance on how to architect PCP environments that monitor up to 1,000 hosts. Details on how to set up a decentralised or federated configuration that enables a large setup can be found here.
With this guidance and improved code base, you can now take Performance Co-Pilot into much larger environments. However, if you’re new to PCP, you can check out the Performance Co-Pilot on RHEL Lab and learn how to get started. We will continue to work on improving the scalability of Performance Co-Pilot as we continue to rely on it in Red Hat Enterprise Linux. Try it out in RHEL 8.5 and let us know what you think!
The Performance Metrics page now features systemd journal information
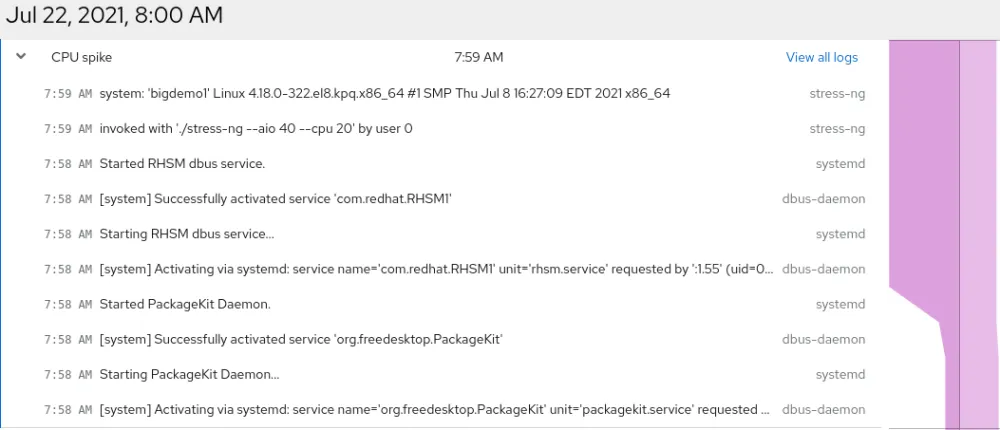
RHEL 8.5 also brings us a new feature in our Performance Metrics page that will help you apply the USE method to troubleshoot more effectively. By integrating the systemd journal into the performance metric page, you will be able to see potentially relevant logs alongside perceived performance events. This functionality helps you determine which application is causing a performance problem in certain scenarios.
Let’s look at two examples of where this has come in useful. In the first example, we get a CPU spike and the following logs:

Looking at this, we see that stress-ng was invoked by user 0 (root) and this would definitely cause the CPU to spike.
In this second example, we get two SELinux messages explaining that access to index.html has been forbidden:

The extra logging around the SELinux message is actually what’s leading to the CPU spike and simply addressing the issue (by doing restorecon -v /var/www/html/index.html) reduces the CPU load dramatically.
Improved SQL Server performance with new TuneD profile
Our Red Hat Performance Engineering team continues to work with our partners to determine how to best tune our products for various workloads. Once we figure out how to do this, we ship these best practices as code in the form of TuneD profiles.
With RHEL 8.5, we are shipping the latest best practices that have resulted from our collaboration with Microsoft on SQL Server. These tunings have been helping SQL Server on RHEL to be a performance leader in the TPC-H Benchmark results (as of December 2021).
Update your RHEL on SQL Server instances to RHEL 8.5 today to take advantage of these improvements!
We are continuing to work on all aspects of performance in Red Hat Enterprise Linux and we hope that you are enjoying these new features and improvements in our 8.5 release! To learn more about the performance space in Red Hat Enterprise Linux, we invite you to check out our other posts and resources.
Sull'autore
Karl Abbott is a Senior Product Manager for Red Hat Enterprise Linux focused on the kernel and performance. Abbott has been at Red Hat for more than 15 years, previously working with customers in the financial services industry as a Technical Account Manager.
Altri risultati simili a questo
The zero touch future: Enabling Telstra’s path to a fully autonomous, self-healing network
Friday Five — April 17, 2026 | Red Hat
Collaboration In Product Security | Compiler
Keeping Track Of Vulnerabilities With CVEs | Compiler
Ricerca per canale
Automazione
Novità sull'automazione IT di tecnologie, team e ambienti
Intelligenza artificiale
Aggiornamenti sulle piattaforme che consentono alle aziende di eseguire carichi di lavoro IA ovunque
Hybrid cloud open source
Scopri come affrontare il futuro in modo più agile grazie al cloud ibrido
Sicurezza
Le ultime novità sulle nostre soluzioni per ridurre i rischi nelle tecnologie e negli ambienti
Edge computing
Aggiornamenti sulle piattaforme che semplificano l'operatività edge
Infrastruttura
Le ultime novità sulla piattaforma Linux aziendale leader a livello mondiale
Applicazioni
Approfondimenti sulle nostre soluzioni alle sfide applicative più difficili
Virtualizzazione
Il futuro della virtualizzazione negli ambienti aziendali per i carichi di lavoro on premise o nel cloud
