

Between virtual machines, microservices, and AI pipelines, hybrid clouds can be incredibly complex and can bring an unwelcome partner: alert fatigue. SREs and IT OPs teams face a constant flood of disconnected alerts, forced to manually stitch together metrics from completely different monitoring tools. Sifting through raw logs and writing complex PromQL queries just to build static dashboards isn't sustainable.
Something has to change. It's time to move away from fragmented tools and toward natural language and visualizations where the platform actually shows you the issues and helps you get the work done. If you're running modern enterprise workloads, then you're sitting on a goldmine of operational data — you just can't get to it easily. That's why we are expanding the cluster management capabilities of Red Hat OpenShift Lightspeed by combining it with new companion platform tools, such as the cluster observability operator.
What is the cluster observability operator?
In Red Hat OpenShift, an operator automates how Kubernetes-native applications are created, configured, and managed. The cluster observability operator introduces three key advancements that work together to help small teams scale with big clouds, turning day-to-day troubleshooting from a manual scavenger hunt into a simplified, intuitive workflow:
- Cluster incident detection: Adds an additional tab to the Observe > Alerting menu to help cluster operators reduce alert fatigue by automatically grouping and correlating related alerts into unified incidents.
- Signal correlation for Red Hat OpenShift: Speeds up troubleshooting by connecting your metrics, logs, alerts, and netflows across data stores into a single interactive graph, making data exploration more simple and direct.
- Red Hat build of Perses: A complete visualization overhaul that brings GitOps-native, custom dashboards-as-code directly into the OpenShift console, enabling the display of real-time metrics visualizations.
In the rest of this post, we'll look at how these integrations work, and how they can help you move from constant firefighting to proactive, simplified cluster management.
Why fragmented tools fail when seconds count
Here's what we know from years of managing production incidents: When systems are down and every second counts, context switching kills response time. Jumping between separate monitoring dashboards, chat interfaces, and diagnostic tools doesn’t just slow you down –it fractures your understanding of the problem. Losing the thread and missing correlations leads to wasting precious minutes re-establishing context every time you switch tools.
That’s why single-pane-of-glass operations are essential for effective incident management. OpenShift provides a unified view where natural language investigation, real-time metrics, and diagnostic insights live together. Red Hat build of Perses, signal correlation, incidents, and OpenShift Lightspeed interfaces are fully integrated into the OpenShift web console itself. No external tools. No silos. Just a cohesive troubleshooting experience where every component you need is right where you're already working: Your OpenShift cluster.
From alert storm to root cause in minutes
It's Friday afternoon, and your monitoring dashboard lights up: Pod restarts are spiking in your production namespace, memory alerts are firing across different clusters, and your #ocp-incidents chat is scrolling faster than you can read. You know what that means: Hours of tedious troubleshooting.
- The old way: You hunt for the pod in the console, switch to your terminal for oc commands, jump to Prometheus to write PromQL queries, cross-reference metrics across separate dashboards, and grep through logs to manually piece together a timeline. Thirty minutes later, you might have a hypothesis.
- The modern streamlined way: You stay in the OpenShift console. With the cluster observability operator and OpenShift Lightspeed already running, you have everything you need to investigate in one place.
Red Hat build of Perses dashboards, signal correlation, and incident detection capabilities are enabled in the cluster observability operator through UIPlugin custom resources. Red Hat build of Perses brings telemetry dashboards directly into your cluster and signal correlation provides a simplified, interactive view of your tied cluster resources. Finally, the cluster observability operator incident detection feature helps cluster operators to identify incidents displayed through severity-coded visual timelines. By organizing alerts around affected components and prioritizing them by impact level, you can rapidly trace problems to their source.
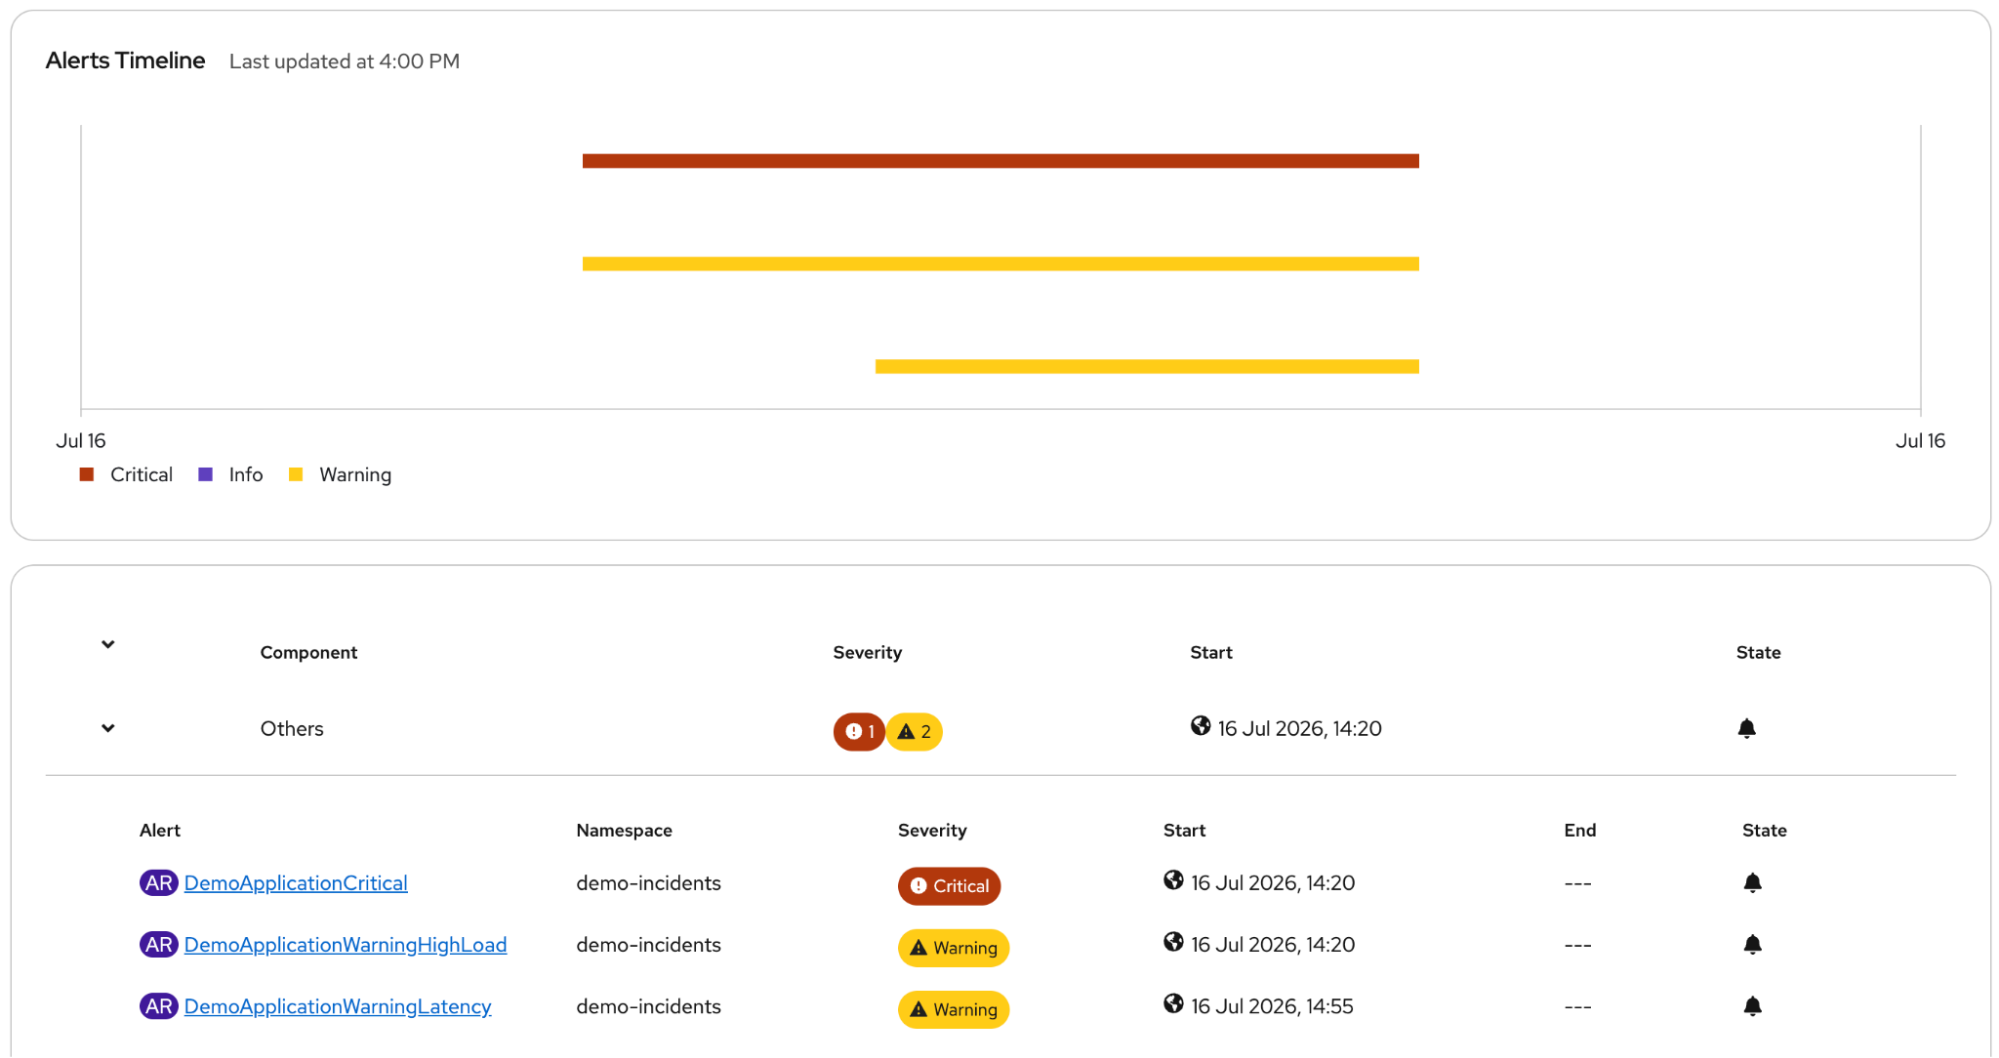
Incidents Dashboard showing three different alerts firing under the same incident
AI-assisted diagnosis workflow
OpenShift Lightspeed could be our starting point. OpenShift Lightspeed is Red Hat's AI-powered virtual assistant. It enables OpenShift users to streamline cluster operations and a wide variety of tasks, including questions about OpenShift procedures or generating YAML manifests, or conducting advanced diagnoses of cluster resources. Start with a simple question: "Is my cluster healthy?"
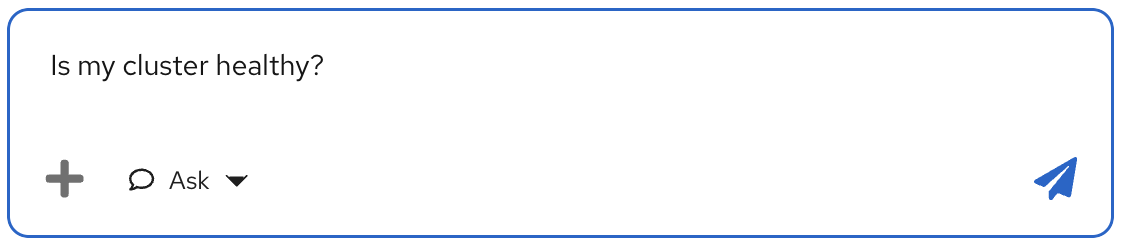
User query about cluster health in Red Hat OpenShift Lightspeed
Behind the scenes, OpenShift Lightspeed combines its LLM knowledge, OpenShift documentation, and MCP tools to provide a response.
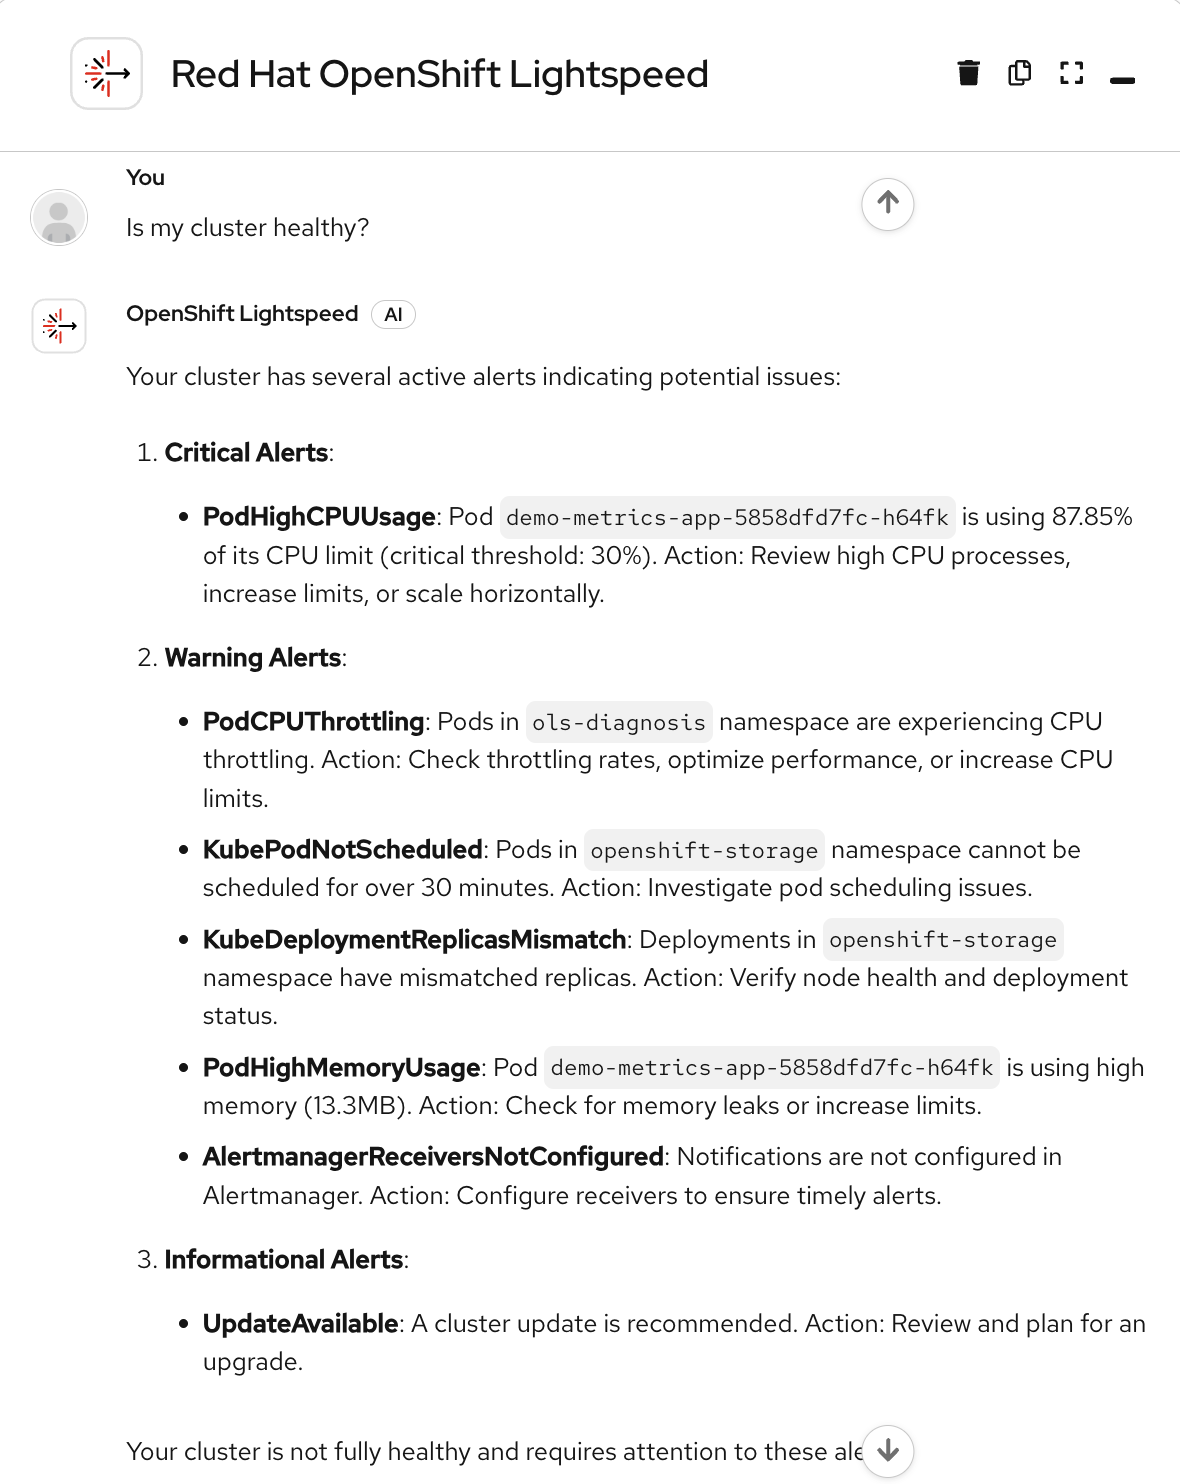
Red Hat OpenShift Lightspeed responds to the query by listing the alerts firing in the cluster
At the bottom of the response, OpenShift Lightspeed displays the MCP tools invoked to gather cluster data. These tools are provided by the native OpenShift Lightspeed MCP server. In this example, the model decided to use the get_alerts tool for the diagnosis. Additionally, we can consult the relevant OpenShift documentation related to our query.
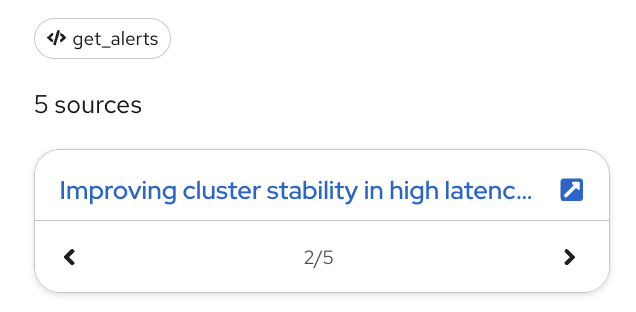
MCP tool and documentation chunks used by OpenShift Lightspeed to answer the user’s query
OpenShift Lightspeed has found several alerts firing in the cluster. It looks like our demo-metrics-app pod in the ols-diagnosisnamespace is triggering some of those, so let's try to fix it as soon as possible. We can continue our diagnosis by asking: "Analyze the alerts firing in my ols-diagnosis namespace."
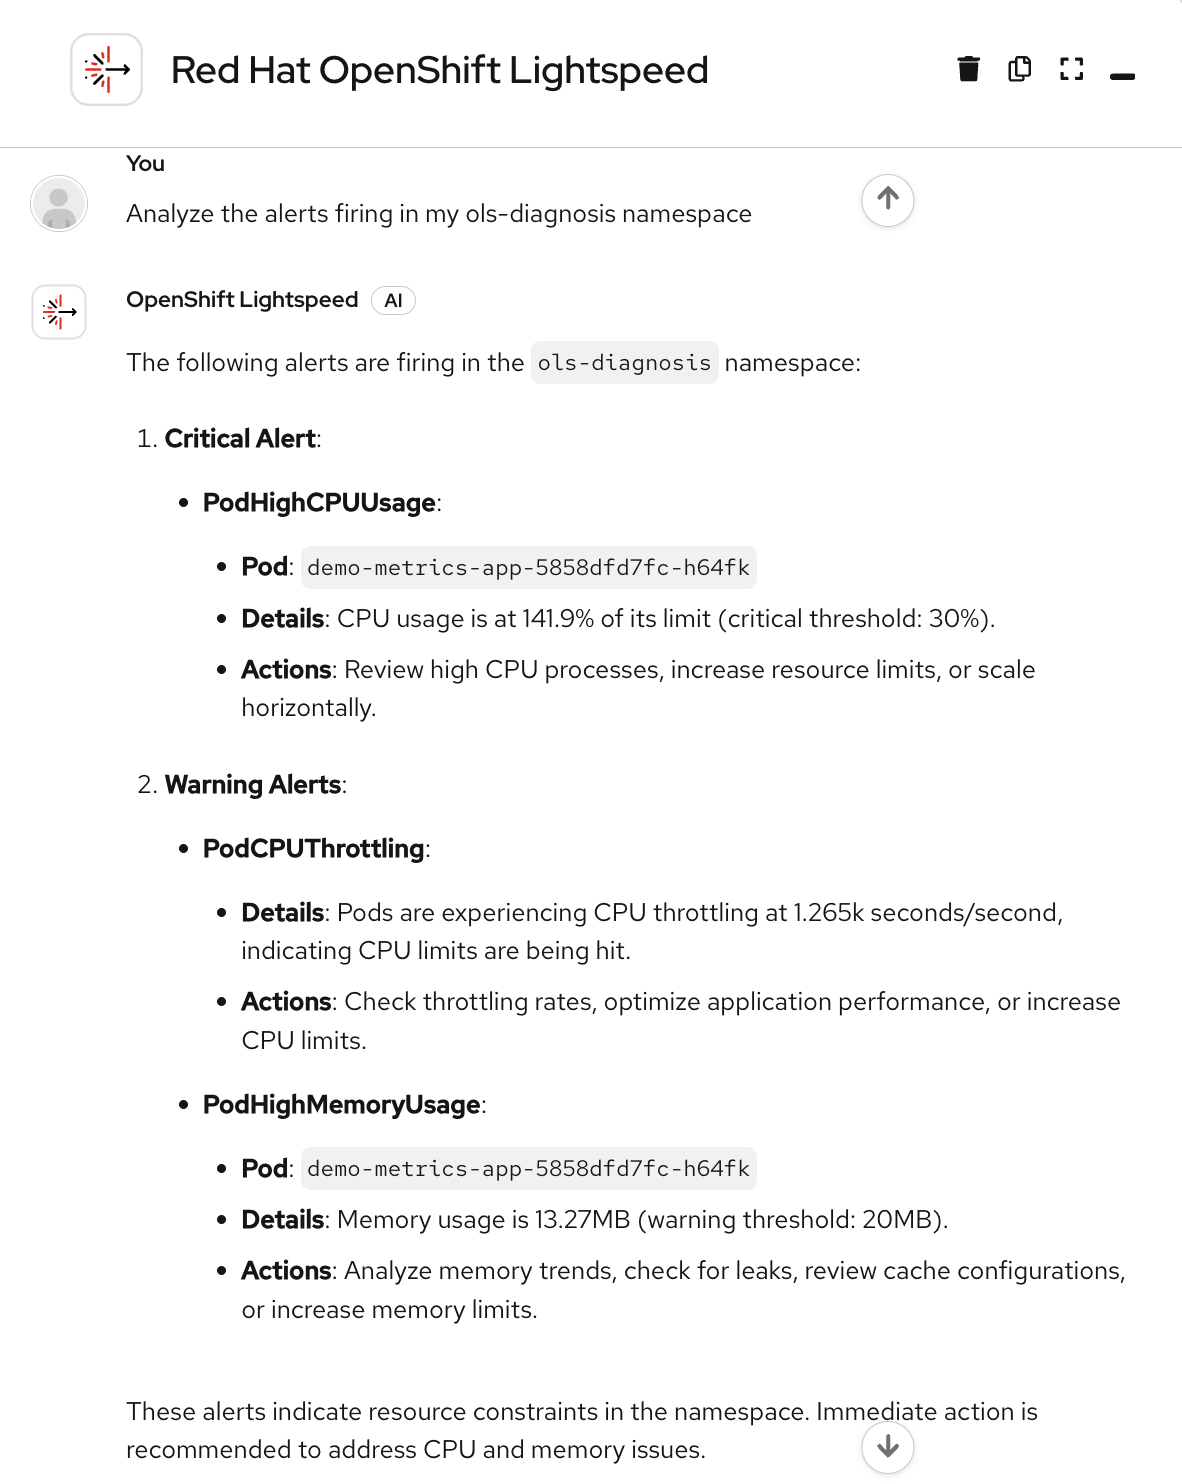
OpenShift Lightspeed provides a diagnosis of the critical incident and tied alerts
OpenShift Lightspeed analyzes the alerts, provides information to the user, and suggests remediation steps. Notice how the three alerts are correlated and tied to high resource consumption. By navigating to the incidents dashboard, we can verify that those three alerts have been automatically grouped into a single incident, simplifying the identification process.
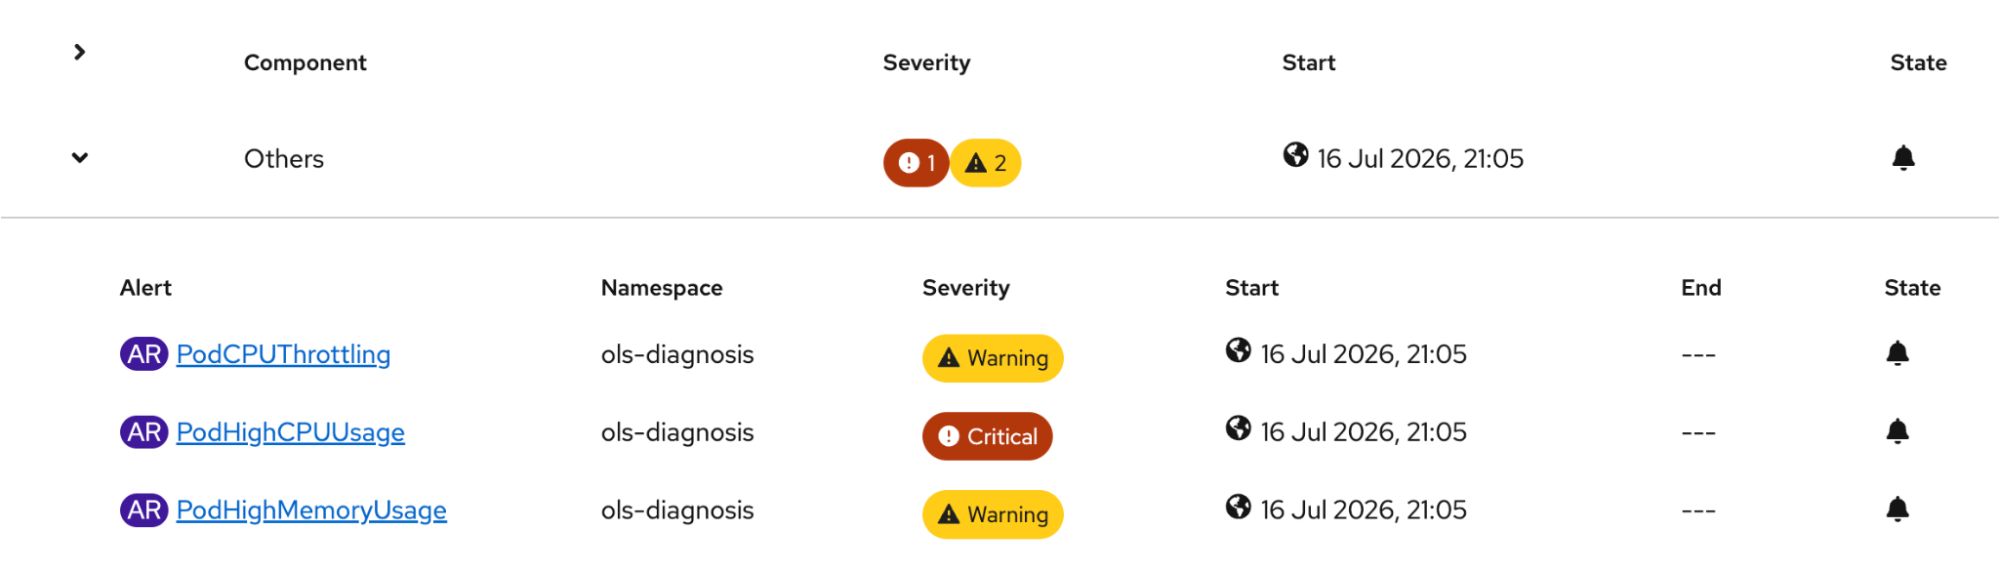
Alerts firing in the ols-diagnosis namespace, grouped into a single incident.
While grouping alerts eliminates the noise, resolving the issue requires deeper context. Signal correlation picks up where incident detection leaves off, allowing us to graphically navigate the relationships between diverse components. By navigating to the app's deployment and opening the Troubleshooting UIPlugin, we can visualize the connections between the pod, its associated events, and related metrics, allowing us to trace the chain of events back to the root cause without ever leaving the console.
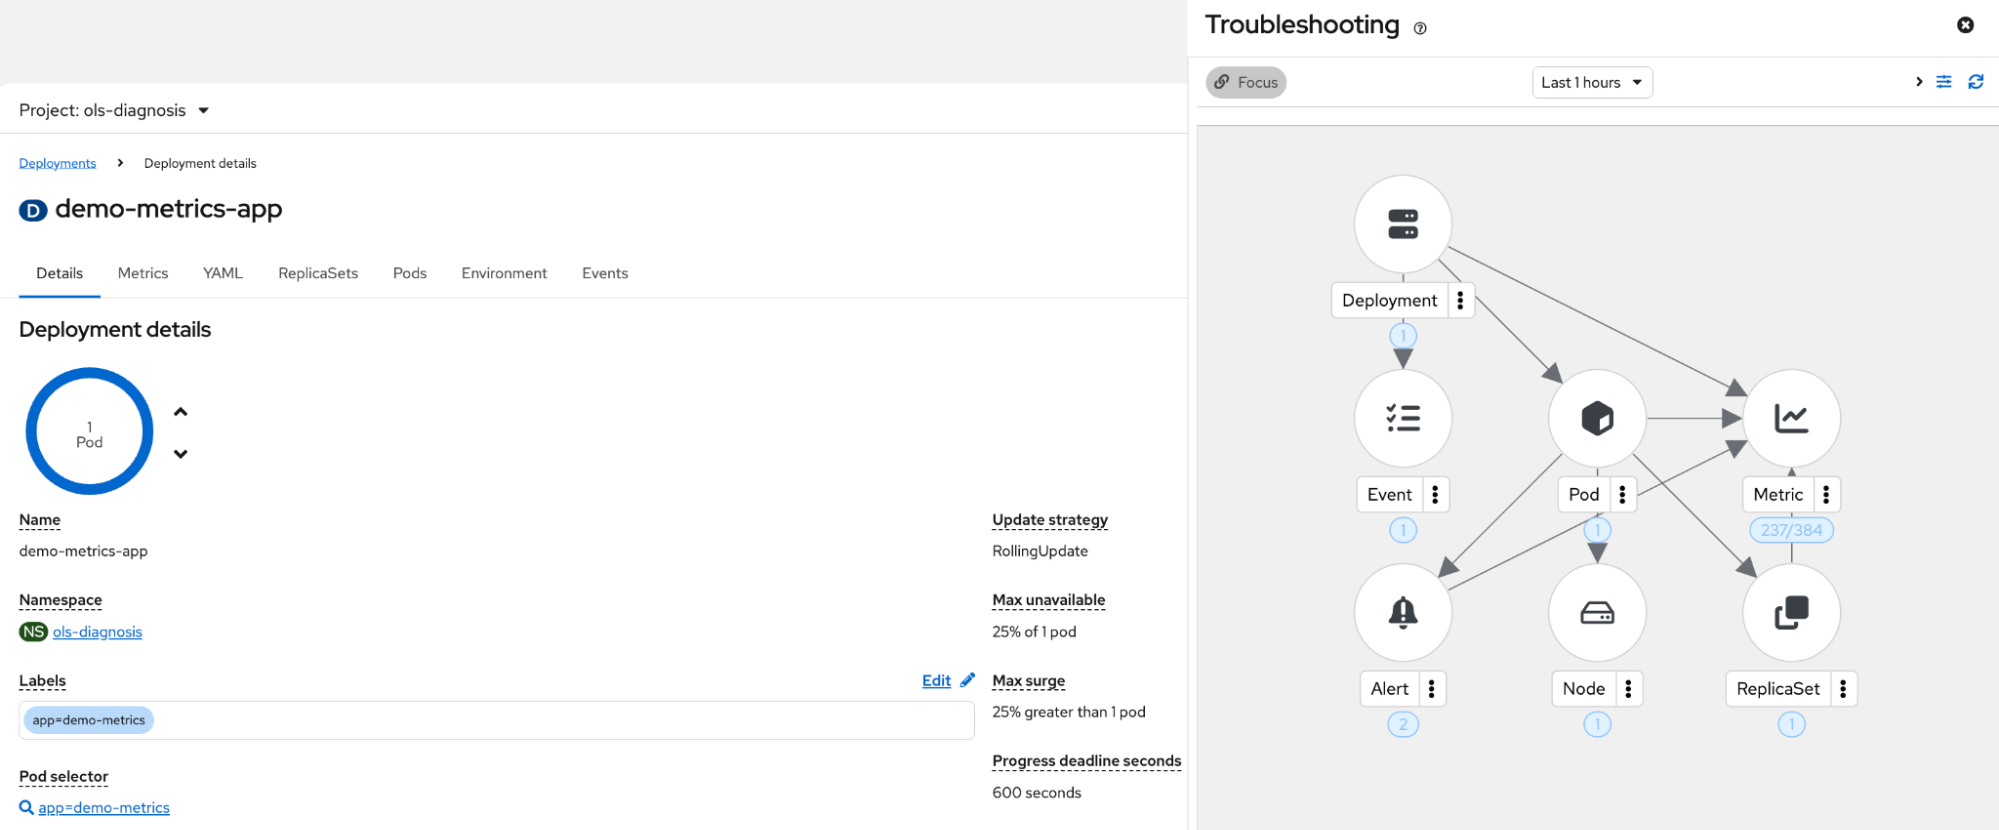
Troubleshooting Plugin view displaying the relationships between the components involved
Now that we've determined the root cause, and OpenShift Lightspeed suggested remediation steps, the next logical step is to move from reactive troubleshooting to proactive monitoring. Because navigating raw data can be overwhelming, effective visualization is key to turning those insights into a permanent, reliable dashboard.
Red Hat build of Perses provides the visualization framework, but we still need precise queries to surface meaningful data. Fortunately, you can make use of OpenShift Lightspeed to generate those too. Let's ask "Provide me with the PromQL queries I need to visualize the relevant data in Perses."

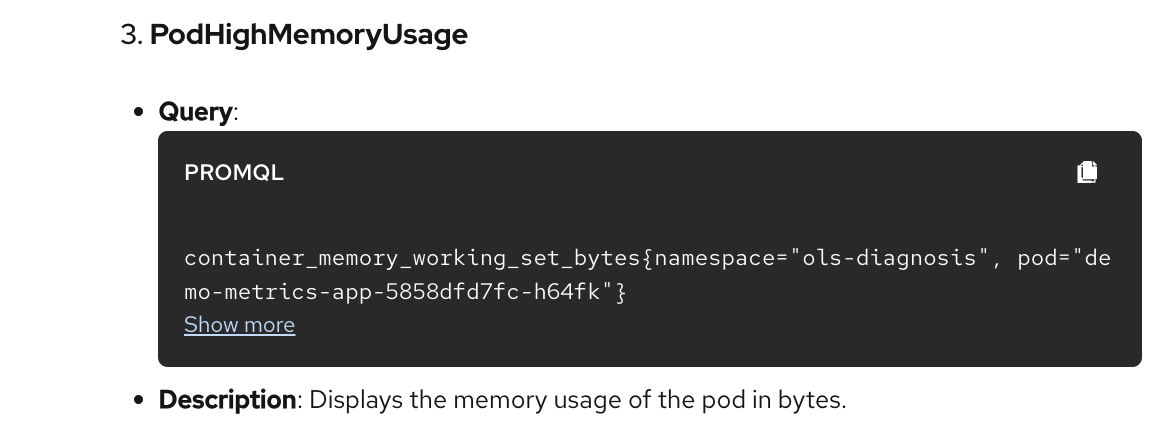
Examples of queries related to the data involved in the incident, with PromQL queries you can copy and paste.
Now we can easily create panels to visualize this data by simply adding the PromQL queries OpenShift Lightspeed suggested to our dashboard. However, Red Hat build of Perses offers a much richer set of customization capabilities that extend well beyond simple panel creation.
The Red Hat build of Perses interface provides a fully interactive workspace where you can refine dashboards using a built-in graphical editor. This allows you to drag-and-drop panels, adjust refresh rates, define dynamic variables, and reorganize layouts to match your specific operational needs.
Customization in Red Hat build of Perses is designed with both flexibility and governance in mind:
- Advanced datasource management: Break down traditional data silos by aggregating metrics from Prometheus, traces from Tempo, and logs from Loki into a single dashboard, providing a correlated, holistic view of your system's health.
- GitOps-native configuration: You can rapidly prototype dashboards in the UI and capture the configuration as code. This makes visualizations version-controlled, reproducible, and shareable.
In this case, we consolidated different panels into a single Perses dashboard. Each panel extracts the necessary data by running the PromQL queries suggested by OpenShift Lightspeed, using various graph types, such as time series or pie charts to display the information.
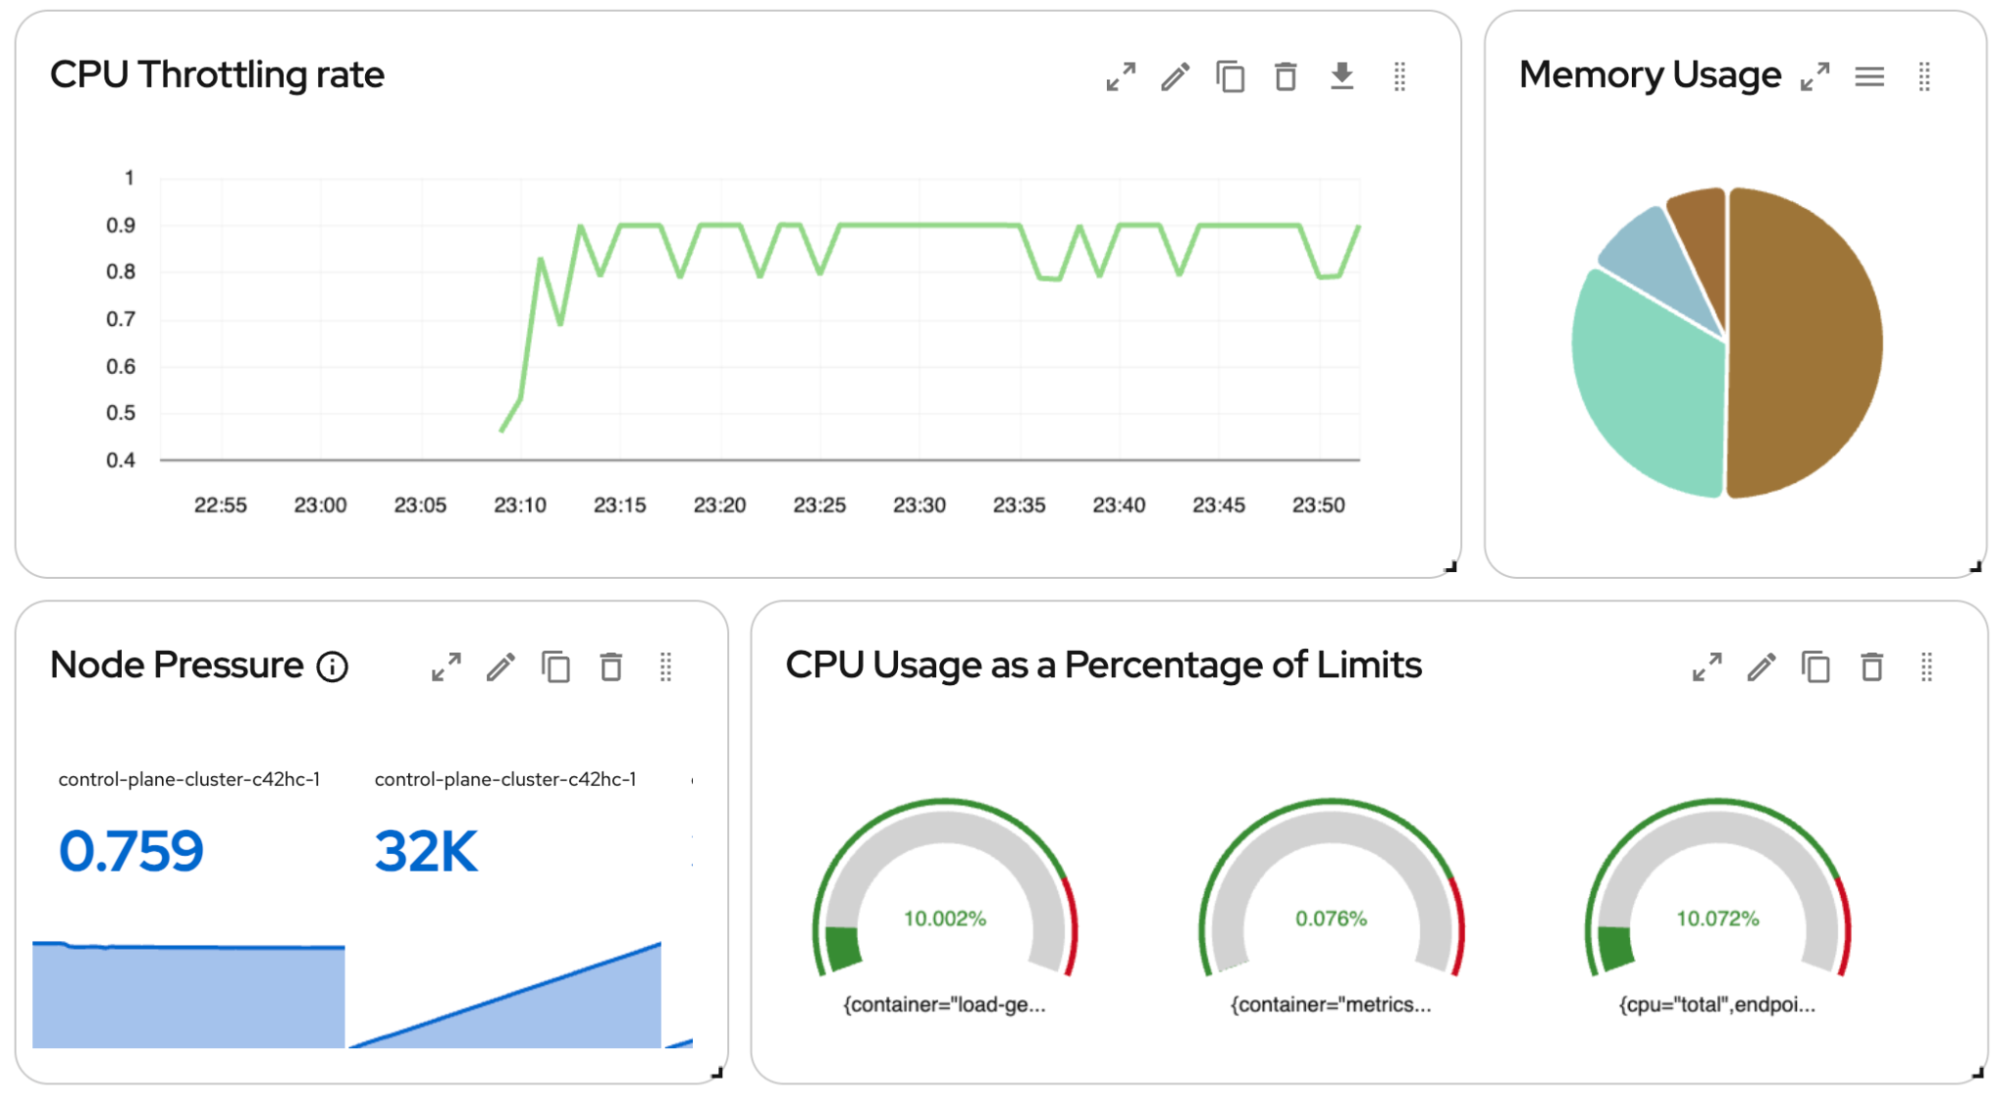
Red Hat build of Perses displays the data collected by the PromQL queries proposed by OpenShift Lightspeed
By transforming those AI-suggested queries into specialized diagrams, we have successfully completed the troubleshooting flow. We've turned an ephemeral alert investigation into a permanent, operational dashboard, ensuring that our team has immediate, actionable visibility into the specific components that triggered the incident.
Conclusion
It's time to leave behind the era of manual scavenger hunts and endless context switching. By weaving AI-powered diagnostics and real-time visualization directly into the OpenShift console, you're doing more than just quieting alert noise—you're redefining your observability and troubleshooting experience. This unified, AI-driven approach streamlines the path from detection to resolution, transforming reactive firefighting into proactive cluster management.
Essai de produit
Red Hat OpenShift Container Platform | Essai de produit
À propos des auteurs
Diego Álvarez is a Technical Marketing Manager at Red Hat, specializing in the intersection of Edge Computing and Artificial Intelligence. Over the last four years, he has focused on driving adoption for edge solutions and their ecosystem. Currently, he is deeply involved in the AI landscape, actively contributing to OpenShift Lightspeed, Red Hat's AI virtual assistant.
Ben has been at Red Hat since 2019, where he focuses on AI on Red Hat OpenShift after spending time on edge computing as well as Red Hat OpenStack Platform. Before this he spent a decade doing a mix of sales and product marking across telecommunications, enterprise storage and hyperconverged infrastructure.
Plus de résultats similaires
Fonctionnement de l'inférence d'IA, clairement expliqué
Inférence d'IA distribuée : ce que les opérateurs de télécommunications doivent savoir
Scaling with Orchestrators | Compiler
SREs on a plane | Technically Speaking
Parcourir par canal

Automatisation
Les dernières nouveautés en matière d'automatisation informatique pour les technologies, les équipes et les environnements

Intelligence artificielle
Actualité sur les plateformes qui permettent aux clients d'exécuter des charges de travail d'IA sur tout type d'environnement

Cloud hybride ouvert
Découvrez comment créer un avenir flexible grâce au cloud hybride

Sécurité
Les dernières actualités sur la façon dont nous réduisons les risques dans tous les environnements et technologies

Edge computing
Actualité sur les plateformes qui simplifient les opérations en périphérie

Infrastructure
Les dernières nouveautés sur la plateforme Linux d'entreprise leader au monde

Applications
À l’intérieur de nos solutions aux défis d’application les plus difficiles

Virtualisation
L'avenir de la virtualisation d'entreprise pour vos charges de travail sur site ou sur le cloud
