Elasticsearch comes as a set of blocks, and you—as a designer—are supposed to glue them together. Yet, the way the software comes out of the box does not cover everything. So, to me, it was not easy to see the cluster’s heartbeat all in one place. I needed something to give me an overview as well as allow me to take action on basic things.
I wanted to introduce you to a helpful piece of software I found: Cerebro.
According to the Cerebro GitHub page:
Cerebro is an open source (MIT License) elasticsearch web admin tool built using Scala, Play Framework, AngularJS, and Bootstrap.
After you clone the Git repository and run /bin/cerebro with the right user permissions, you can log into http://localhost:9000. I’ll save some "paper" by not following the initial configuration and auth setup, but I presume people will work it out easily.
Once everything's set up, you come to the login screen:

And here is the main screen after successfully logging in:

Here, we see a table view with indexing nodes (left vertical), daily indexes (top horizontal), and shard indices (chunks of data numbered one, two, three, etc.)
From this point, we can monitor and manipulate (close, delete) indexes, nodes, and overall see the whole cluster’s status. For example, if we run an API call to resync corrupted shards to another node, we can watch the progress on this screen. This is important visibility into what’s going on because with big data something is always more or less broken.
Here, we lost one indexing node. We might need to check if the link is up and the Elasticsearch process has not crashed on that particular node. If we bring the node back online, this dashboard shows you the replication progress in real-time:

Or, here we have an issue with individual shard indices. They are probably corrupted and need a fix and then manual replication:

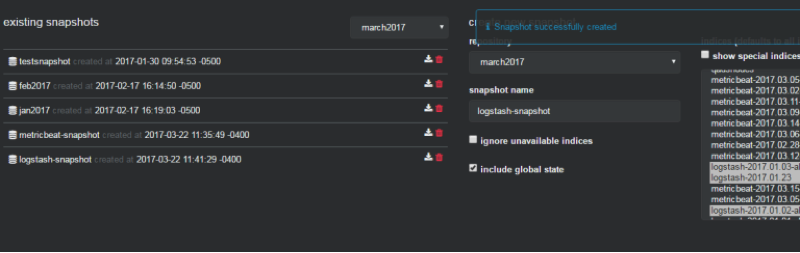
There are also cluster configuration menus, and one of the options I found interesting and useful was "snapshots." Sometimes, we need to archive and rotate data to recover free space. Call the snapshot backups, for example, if you have to keep a few years’ data for an external audit.
There are scripts that normally do this for you in the background, so this GUI allows you to browse the indices easily, and open or activate a particular index or day on-demand in one click:
To summarize, I would say this tool saves my nerves and my time when investigating trivial situations. I take a quick look at Cerebro and I know what happened with my cluster. Overall, I found this software stable, useful, and a good addition to my ELK admin toolbox.
Want to learn more advanced techniques for monitoring in Linux? Check out The open source guide to DevOps monitoring tools.
Sull'autore
Danil Mashonkin was born in Sverdlovsk (Yekaterinburg) former USSR in 1973 and received a degree from the Ural's University of Communications in 1992. He began as a and 1996 and quicly transitioned into IT as a full stack C programmer in 1999.
He got into open source in 2004 with Adelaide, who is well-known for their open source integrator for non profits. In 2007, he began working for a healthcare supplier and their migration to open source projects like Nortel to Asterisk, Pronto ERP to Adempiere, Postgres SQL, and so on. Since 2009, he was partially in a DevOps position along with being a sysadmin.
In 2011, he started his own IT consultancy business providing Proxmox virtualization systems design, delivery, and support. Then in 2016, he began doing InfoSec work with Global Payments as Linux and Security Engineer mainly responsible for monitoring systems, patch management, SIEM, big data, and others tasks.
He joined Red Hat IT Operations in 2018. He likes to build boats and then drive, ride, and sail them.
Altri risultati simili a questo
Pianifica il percorso di upgrade ad Ansible Automation Platform 2.6
Semplifica le operazioni di rete con Red Hat Ansible Automation Platform e Cisco Meraki
Operating System Management | Compiler
Technically Speaking | Taming AI agents with observability
Ricerca per canale

Automazione
Novità sull'automazione IT di tecnologie, team e ambienti

Intelligenza artificiale
Aggiornamenti sulle piattaforme che consentono alle aziende di eseguire carichi di lavoro IA ovunque

Hybrid cloud open source
Scopri come affrontare il futuro in modo più agile grazie al cloud ibrido

Sicurezza
Le ultime novità sulle nostre soluzioni per ridurre i rischi nelle tecnologie e negli ambienti

Edge computing
Aggiornamenti sulle piattaforme che semplificano l'operatività edge

Infrastruttura
Le ultime novità sulla piattaforma Linux aziendale leader a livello mondiale

Applicazioni
Approfondimenti sulle nostre soluzioni alle sfide applicative più difficili
Virtualizzazione
Il futuro della virtualizzazione negli ambienti aziendali per i carichi di lavoro on premise o nel cloud