
È venerdì sera. Priya, Machine Learning Engineer presso un'azienda di servizi finanziari, mette in coda un processo di fine tuning per il rilevamento delle frodi su un cluster di GPU che costa 55 USD l'ora. L'esecuzione dovrebbe richiedere circa 40 ore, per un costo di elaborazione di circa 2.200 USD. Controlla gli iperparametri, invia il processo e torna a casa per passare il fine settimana.
Lunedì mattina apre il suo laptop. Il modello aveva smesso di apprendere venerdì notte, ma il processo è rimasto in esecuzione, utilizzando GPU inutilmente per due interi giorni. Si tratta di oltre 1.500 USD sprecati in elaborazione, per dover ricominciare da capo.
Se questa situazione ti sembra familiare, sappi che è diffusa. Chiunque abbia eseguito un processo di addestramento di più giorni conosce bene alcune domande scomode.
- Il modello sta imparando davvero qualcosa?
- Dovrei interrompere l'esecuzione in anticipo e provare iperparametri diversi?
- Terminerà prima della revisione con gli stakeholder di martedì?
Il costo dell'incertezza è reale. I cluster GPU on demand possono costare più di 50 USD l'ora. Una singola esecuzione di addestramento di più giorni può facilmente costare migliaia di dollari e un'esecuzione configurata male può sprecare un intero fine settimana in elaborazione prima che qualcuno se ne accorga. Nei cluster condivisi l'impatto si moltiplica: un processo in stallo non spreca solo il budget di un team, ma impedisce ad altri team di accedere alle GPU di cui hanno bisogno. L'esecuzione incontrollata da parte di un team si trasforma nel ritardo del lavoro di un altro team. Il problema non è la negligenza dei team. Lo è il fatto è che stiano procedendo alla cieca. Ogni ora di utilizzo delle GPU conta e senza una visibilità in tempo reale sull'avanzamento dell'addestramento, si sprecano troppe ore.
Il divario nell'osservabilità
Ecco la scomoda verità: dal punto di vista della piattaforma, un processo di addestramento che converge correttamente e uno completamente in stallo sembrano identici. Entrambi sono pod in esecuzione, consumano le stesse risorse e mostrano lo stesso indicatore di stato verde. Kubernetes non è in grado di capire se il tuo modello stia apprendendo.
Oggi monitorare i progressi dell'addestramento è possibile, ma è più difficile di quanto dovrebbe essere.
- I log sono frammentati e difficili da consultare: in un processo di addestramento distribuito, i log sono sparsi su più pod. Trovare l'output pertinente significa sapere quale pod esaminare, come accedervi e come interpretare i formati dei log specifici del framework. Questo richiede competenze nell’utilizzo di Kubernetes, un set di abilità aggiuntive che la maggior parte dei Data Scientist e degli AI Engineer non dovrebbe aver bisogno di acquisire solo per monitorare le proprie esecuzioni di addestramento. I log non strutturati o di scarsa qualità non sono facilmente leggibili dalle macchine, quindi non possono guidare l'automazione.
- Gli strumenti esterni risolvono il problema dell'osservabilità, ma aggiungono un carico di gestione: le piattaforme per il monitoraggio degli esperimenti come MLflow e Weights & Biases sono eccellenti per le loro funzioni specifiche. Tuttavia, richiedono un'infrastruttura aggiuntiva da distribuire e gestire, chiavi API e controlli degli accessi, e operano al di sopra del livello della piattaforma. Inoltre, sono disconnessi dall'API di Kubernetes, il che rende più difficile l'integrazione con flussi di lavoro e operatori personalizzati Kubernetes native. Ti informano su cosa è accaduto all'interno del ciclo di addestramento, ma non possono comunicare alla piattaforma cosa sta succedendo.
- Ogni framework opera in modo diverso. PyTorch DDP, FSDP, DeepSpeed, JAX: ognuno ha le proprie convenzioni per il registro, il proprio formato per le metriche e il proprio modo di segnalare i progressi. Non c'è coerenza tra i framework, il che significa che non esiste una visione unificata per i team della piattaforma che gestiscono un ambiente di addestramento eterogeneo.
- Nessuna API standard: fino a oggi, i processi di addestramento non avevano un modo standardizzato per segnalare i progressi alla piattaforma. Di conseguenza, gli amministratori della piattaforma che gestiscono cluster GPU condivisi devono tirare a indovinare per capire quali processi stiano procedendo, quali siano in stallo e quali stiano per terminare. Senza tale visibilità, la pianificazione della capacità e la risoluzione dei problemi si basano solo su congetture.
Per colmare il divario: il monitoraggio dei progressi in Red Hat OpenShift AI
Red Hat OpenShift AI ora include il monitoraggio dell'avanzamento negli ambienti di produzione per i processi di addestramento distribuiti, integrato in Kubeflow Trainer v2 e disponibile a livello generale a partire da Red Hat OpenShift AI 3.4. Puoi vedere cosa sta succedendo mentre accade e intervenire prima che sia troppo tardi. Questa funzionalità colma direttamente il divario di osservabilità offrendo a Data Scientist, ML Engineer e amministratori della piattaforma visibilità in tempo reale sulle prestazioni dei processi di addestramento.
Questa visibilità si basa su tre pilastri.
- Visualizzazione nella dashboard: le metriche di avanzamento in tempo reale sono visibili direttamente nella dashboard di Red Hat OpenShift AI. A colpo d'occhio puoi visualizzare la percentuale di avanzamento, il passaggio corrente e quelli totali, l'epoca corrente, il tempo rimanente stimato, la perdita di addestramento e le metriche di valutazione per i tuoi TrainJob. Nessuno strumento separato, nessuna configurazione aggiuntiva.
- Integrazione dell'SDK: gli stessi dati sull'avanzamento sono disponibili a livello di codice tramite l'SDK di Kubeflow. Questo consente ai team di creare pipeline automatizzate che reagiscono all'avanzamento dell'addestramento, attivando l'arresto anticipato, inviando notifiche o riallocando le risorse in base a metriche in tempo reale.
- Coerenza tra più framework: il monitoraggio dell'avanzamento funziona allo stesso modo sia che tu stia usando PyTorch DDP, FSDP, DeepSpeed o JAX. Supporta anche il codice di addestramento personalizzato tramite l'API CustomTrainer. In questo modo si ottiene un'esperienza unificata in tutti i framework.
Visualizza l'addestramento in corso
Il modo migliore per comprendere il monitoraggio dell'avanzamento è analizzare come si utilizza concretamente. Ci sono tre passaggi fondamentali.
- Avvia il processo di addestramento: invia un processo di addestramento da un notebook utilizzando l'SDK di Kubeflow, esattamente come faresti oggi. Se utilizzi HuggingFace Transformers, il monitoraggio dell'avanzamento è automatico: non è necessario modificare il codice. L'integrazione rileva l'ambiente Kubeflow e inizia a segnalare le metriche dal ciclo di addestramento.
- Monitora l'avanzamento: durante l'esecuzione dell'addestramento, nella dashboard di Red Hat OpenShift AI compaiono le metriche in tempo reale: percentuale di avanzamento, tempo rimanente stimato, passaggi completati, epoche, norma del gradiente, perdita di addestramento e tasso di apprendimento. Niente tailing dei log, nessun accesso SSH ai pod, nessuno strumento esterno da configurare.
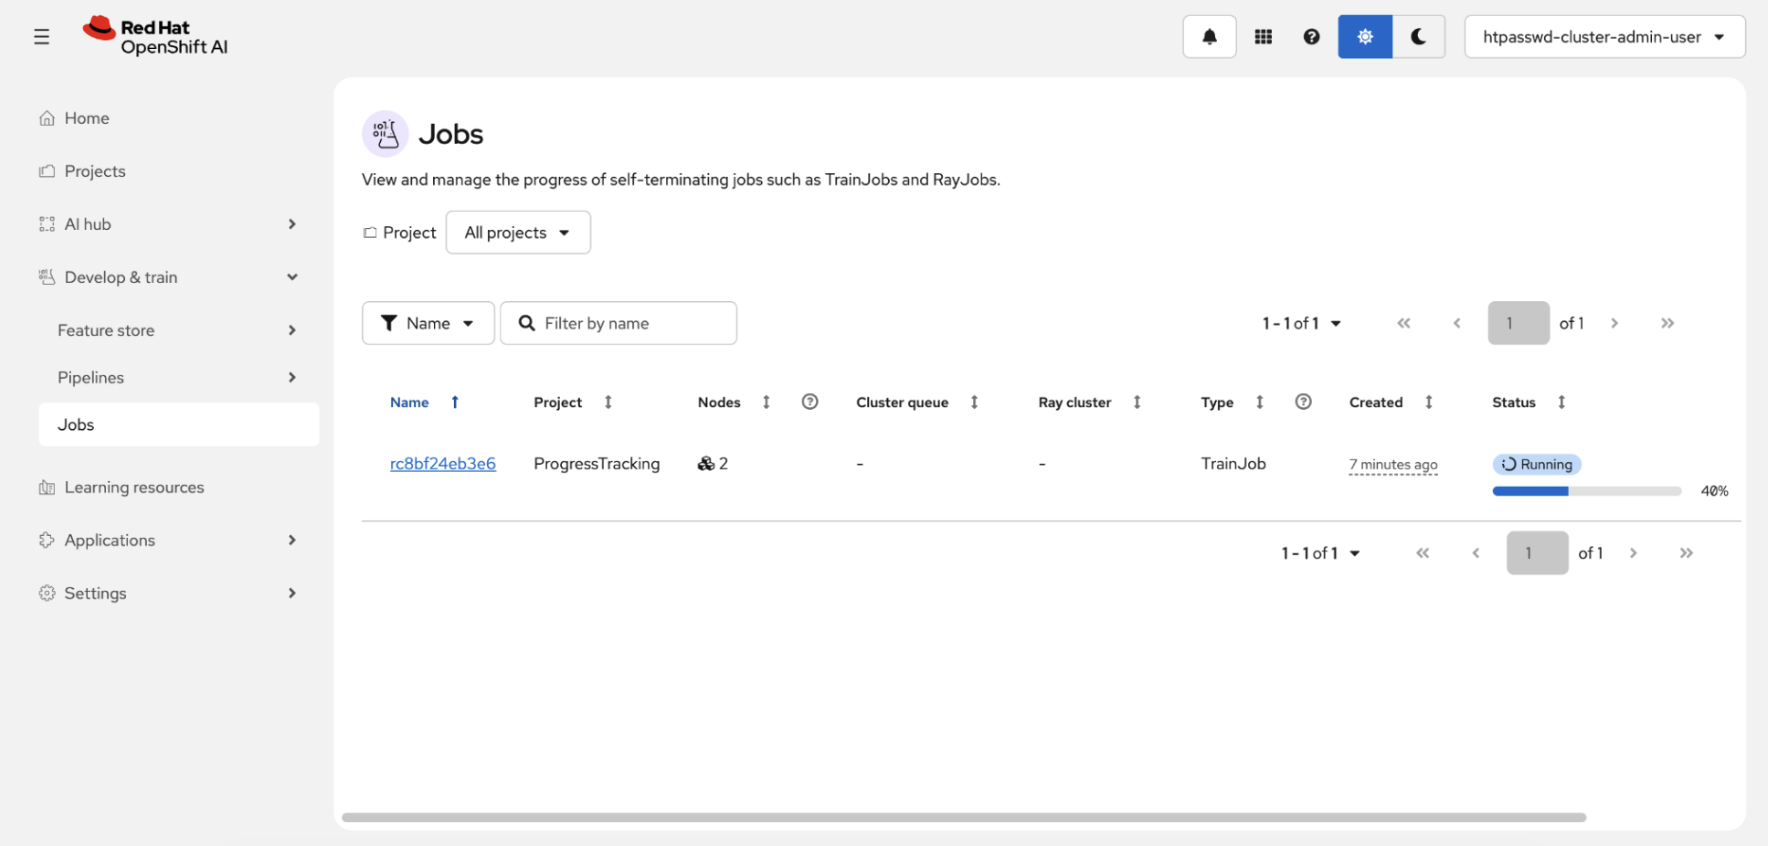
Figura 1: La dashboard di Red Hat OpenShift AI mostra un elenco di processi con una barra di avanzamento che indica il completamento al 40% per un TrainJob in esecuzione.
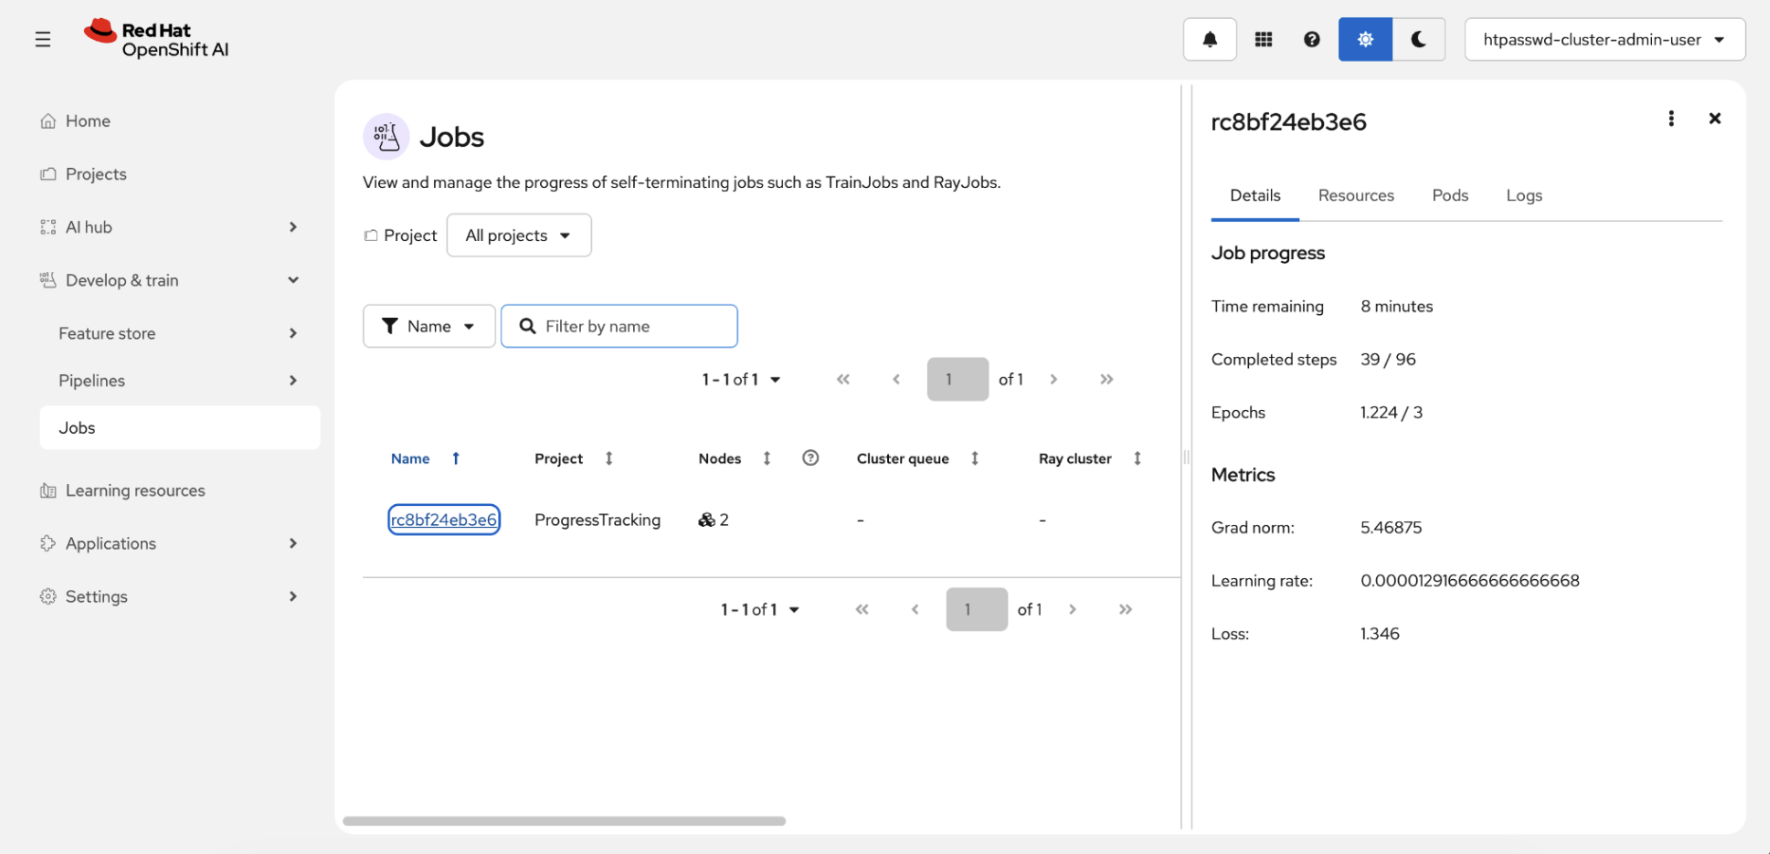
Figura 2: Pannello laterale dettagliato per l'avanzamento del processo e le metriche in tempo reale.
- Agisci in base ai dati: è qui che il monitoraggio dell'avanzamento fa risparmiare davvero tempo e risorse di elaborazione. Non noti miglioramenti? Interrompi il processo in anticipo e risparmia ore di utilizzo delle GPU. Vedi un'esecuzione che converge più rapidamente del previsto? Libera risorse per il tuo team. Potrai sapere esattamente quando un processo terminerà per pianificare le tue attività: non dovrai più indovinare se i risultati saranno pronti per la revisione con gli stakeholder di martedì.
Ecco le caratteristiche principali che rendono pratica questa soluzione.
- Nessuna configurazione: nessuna infrastruttura aggiuntiva, nessuna dipendenza esterna, nessuna configurazione extra. Il monitoraggio dell'avanzamento è pronto all'uso.
- Sovraccarico minimo: le metriche vengono segnalate nei punti di controllo naturali dell'addestramento senza influire sulle prestazioni.
- Funziona con diversi framework: che tu stia utilizzando PyTorch DDP, FSDP, DeepSpeed, JAX o codice di addestramento personalizzato, l'esperienza di utilizzo è la stessa.
Vantaggi per gli utenti
Data Scientist e ML/AI Engineer possono visualizzare in tempo reale l’interruzione dell’addestramento, la percentuale di avanzamento e l'ETA senza dover accedere ai pod tramite SSH o monitorare i log. Rilevare in anticipo divergenze o stalli nell'addestramento: individuare un processo bloccato il sabato mattina invece del lunedì consente di risparmiare ore di utilizzo delle GPU. Confronta le esecuzioni di addestramento a colpo d'occhio dalla dashboard per identificare rapidamente la configurazione degli iperparametri con le prestazioni migliori.
Gli amministratori della piattaforma ottengono un'unica visualizzazione nella dashboard per tutti i processi di addestramento nel cluster. Potranno visualizzare metriche coerenti indipendentemente dal fatto che un processo utilizzi DDP, FSDP o DeepSpeed, e prendere decisioni migliori sulla pianificazione della capacità, sapendo quali processi procedono, quali sono in stallo e quali sono prossimi al completamento.
Negli ambienti GPU multi-tenant in cui più team condividono lo stesso cluster, questa visibilità migliora direttamente l'utilizzo delle risorse e il ROI. Per le organizzazioni che creano un modello GPU-as-a-Service, il monitoraggio dell'avanzamento colma una lacuna critica, trasformando la "scatola nera dell'utilizzo della GPU" in un sistema osservabile e gestibile. In definitiva, questo consente ai team della piattaforma di eliminare rallentamenti sull'infrastruttura e fornire ai Data Scientist le risorse necessarie per accelerare l'innovazione dell'IA.
Oltre il monitoraggio: crea le basi per un addestramento più intelligente
Il monitoraggio dell'avanzamento non è solo una funzione di monitoraggio: è la base. Dal momento in cui la piattaforma ha accesso ai dati sull'avanzamento dell'addestramento in tempo reale, diventa possibile implementare una serie di comportamenti più intelligenti. Sebbene queste funzionalità avanzate non rappresentino ancora impegni ufficiali per i prodotti Red Hat, le basi sono già pronte. La community upstream di Kubeflow Trainer sta esplorando attivamente in diverse direzioni.
- Ottimizzazione intelligente degli iperparametri: oggi i motori di ottimizzazione degli iperparametri come Katib si affidano all'analisi dei log con modelli regex fragili per valutare le prestazioni dei trial. Con le metriche di addestramento disponibili direttamente nell'API di Kubernetes, Katib può leggere lo stato dell'addestramento in modo nativo, consentendo un'integrazione più stretta e un'orchestrazione dei trial più efficiente. Questo è il KEP attualmente in discussione nella community upstream.
- Scalabilità elastica: i dati sulla velocità di convergenza e sull'ETA potrebbero influenzare le decisioni di scalabilità verticale. Un modello che converge rapidamente potrebbe liberare GPU per altri team, mentre uno in fase di stallo potrebbe richiedere nodi worker aggiuntivi. La community upstream sta esplorando il supporto elastico per PyTorch in TrainJob per rendere possibile tutto questo.
- Visibilità dell'avanzamento da CLI: il comando
kubectl get trainjobcon una colonnaPROGRESS %integrata porterebbe l'avanzamento dell'addestramento direttamente sulla riga di comando, offrendo agli operatori una visibilità immediata senza necessità di dashboard o SDK. - Checkpoint più intelligenti: sebbene OpenShift AI supporti già i checkpoint del modello periodici e just-in-time, grazie alla disponibilità dei dati sull'ETA e sull'avanzamento, la piattaforma potrebbe prendere decisioni più intelligenti su quando eseguire i checkpoint, ad esempio salvando lo stato automaticamente in base all'ETA del processo. La community upstream sta esplorando i checkpoint trasparenti per GPU con CRIU per migliorare la tolleranza ai guasti e la resilienza dei TrainJob.
Queste sono aree di esplorazione attiva nel progetto Kubeflow, non impegni relativi ai prodotti, ma illustrano perché il monitoraggio dell'avanzamento sia importante oltre la singola funzione: crea il livello di dati su cui può basarsi l'intero stack di addestramento.
Il monitoraggio dell'avanzamento per l'addestramento distribuito è disponibile a livello generale in Red Hat OpenShift AI 3.4. Per ulteriori informazioni, consulta la documentazione di Red Hat OpenShift AI. Oppure richiedi la prova di 60 giorni di Red Hat OpenShift AI.
Risorsa
L'azienda adattabile: adotta l'IA per innovare
Sull'autore
I am a Software Quality Engineer at Red Hat specializing in Kubeflow and distributed AI training. I am focused on making large-scale infrastructure efficient and resilient, and I share insights on distributed model training and fine-tuning on Kubernetes.
Altri risultati simili a questo
Perché il tuo framework degli agenti di IA non è completo: 7 funzionalità della piattaforma mancanti in produzione
Introduzione ad asago: orchestrazione della sicurezza e della governance dell'IA open source
Can agentic AI patch the internet?
How Red Hat cleared IT debt for scalable AI
Ricerca per canale

Automazione
Novità sull'automazione IT di tecnologie, team e ambienti

Intelligenza artificiale
Aggiornamenti sulle piattaforme che consentono alle aziende di eseguire carichi di lavoro IA ovunque

Hybrid cloud open source
Scopri come affrontare il futuro in modo più agile grazie al cloud ibrido

Sicurezza
Le ultime novità sulle nostre soluzioni per ridurre i rischi nelle tecnologie e negli ambienti

Edge computing
Aggiornamenti sulle piattaforme che semplificano l'operatività edge

Infrastruttura
Le ultime novità sulla piattaforma Linux aziendale leader a livello mondiale

Applicazioni
Approfondimenti sulle nostre soluzioni alle sfide applicative più difficili

Virtualizzazione
Il futuro della virtualizzazione negli ambienti aziendali per i carichi di lavoro on premise o nel cloud
