In this post we're going to look at the next part of our fictional company's journey to digital transformation. Over the past several months Davie Street Enterprises’ (DSE) digital transformation has progressed quickly with much success. Now it's time to tackle predicting and preventing, if possible, outages and improving user experience.
Ranbir Ahuja, Senior Director of Operators, has been following the efforts with much curiosity. For the most part, Ahuja is excited at the progress yet is concerned that from his perspective one of the largest single drivers for this transformation hasn’t been directly addressed.
Last year, there was a 46-hour outage of the main DSE website. His team spent many hours, including some sleepless nights, trying to resolve the issue and he is concerned this may happen again. Ahuja decides to take his concern to Susan Chin, Senior Director of Development.
He and Chin have been working closely now that DSE is building a DevOps practice. Chin informed Ahuja that indeed they have been working on moving all critical workloads including this website into Red Hat OpenShift, both for development as well as production.
In addition, they are deploying Dynatrace on Red Hat OpenShift to monitor and respond to any abnormalities in applications like the DSE website. Chin tells Ahuja that Dynatrace can not only detect a problem but predict them and help determine the root cause so they may be corrected well before an outage occurs.
Chin says that beyond preventing outages they will be able to measure user experience. Ahuja is intrigued but a bit skeptical that all this can be done so he says "Make me a believer, Susan. Can you show me?" Chin says "seeing is believing," and proceeds to demonstrate how OpenShift and Dynatrace can meet and exceed Ahuja’s expectations and calm his concerns
Chin says that Dynatrace was built to help teams solve problems faster, and in many cases immediately. This means most operations teams will only have to engage to verify and not to resolve the issue. This is because Dynatrace is fully automated and can monitor the full stack of your applications. Built with AIOps in mind it truly takes IT operations to another level.
Ahuja being a bit skeptical says "OK sure. It sounds amazing but I bet it's a pain to install and configure!" To that Chin says, "nope. Dynatrace comes with a OneAgent Kubernetes Operator that installs quickly using OpenShift Operator advanced framework."
This allows OneAgent to run on OpenShift as a first-class citizen. OneAgent will monitor each application across all containers to collect a set of performance metrics. Thanks to the Operator SDK framework as new updates/fixes are needed OneAgent can be modified to the latest version without disruption to its monitoring services or your application.
Ahuja then says "Sounds great but we are moving towards tons of containers and microservices all running on OpenShift for all our applications, how will Dynatrace be able to handle that?"
Chin says Dynatrace monitors down to the code level giving you and your team full visibility into your containers, nodes, and microservices. Furthermore there is no need for developers to rewrite code for it to work at this level. Dynatrace does all the work for your teams to run as part of your OpenShift Platform.
Ahuja says "really amazing but can you show me how easy it is to set up. I still find it hard to believe it can do so much AND it's easy to get going as well?"
To demonstrate this to Ahuja, Chin created a SaaS account on the Dynatrace web site. Next she proceeded to create tokens, both an apiToken and paasToken. Here's the steps to see how Chin created an account:
-
Go to Settings->Integration->Dynatrace API->Click on Generate Token button and type a token name
 Click on generate token.
 Under API v2 type in a name for the API token and then enable Read metrics, Read entities, Read Settings and Write Settings.

Click on Generate and save the token in a secure location -
Go to Settings->Integration->Platform as a Service->
 Click on Generate Token.
 Type in a name for your PaaS token then click create token.
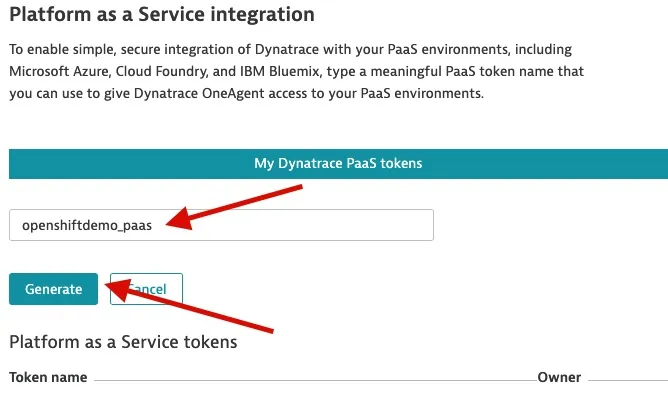 Click Generate and save the token in a secure location.
Now open up you OpenShift Console and follow these steps to finish setting up the Dynatrace Operator:
1) Log into OpenShift Container Platform dashboard and create a project 'dynatrace' (or any name you want).
 2) On the OpenShift Container Platform dashboard, select Operators -> OperatorHub from the side menu.

-
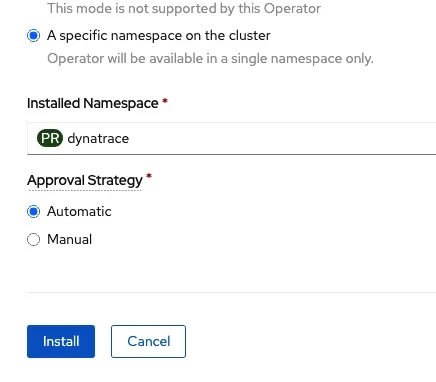
Select Dynatrace OneAgent Operator > Install.

-
Make sure the namespace is the project you created and click install.
-
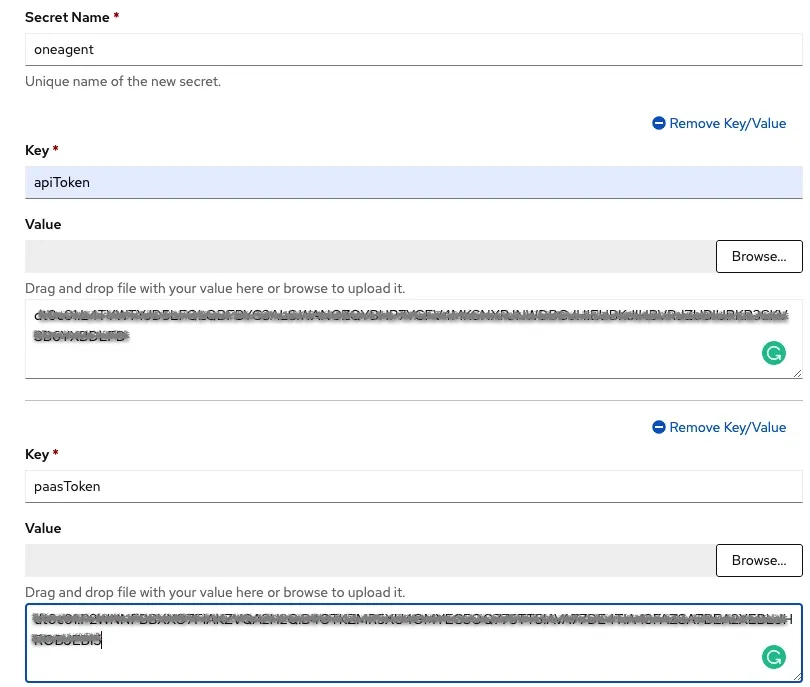
Go to Workloads > Secrets and create a new key named oneagent with two values:
apiToken (with the value of the token you made)
paasToken (with the value of the token you made)
-
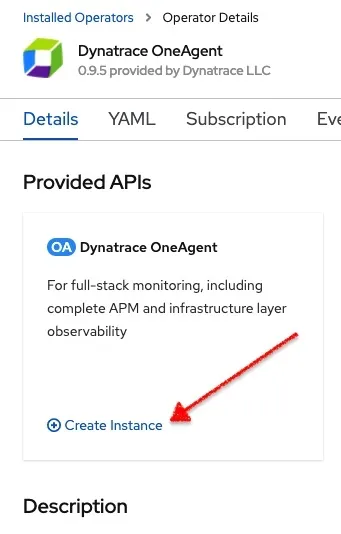
Go to Operators > Installed Operators from the side menu and select Dynatrace OneAgent Operator.

-
Select Create instance.
-
Replace 'API URL' value according to your SaaS URL. Note this just the first part of the URL when you are in Dynatrace SaaS.

-
Click on Create
Wait for until you see the 'Running' status next to the 'oneagent' name in the console.
Post-setup for Dynatrace
Now Ahuja is more than intrigued. He has been able to install and deploy the OneAgent operator in a matter of minutes not weeks and is now curious how he would go about configuring Dynatrace to monitor that pesky website so that he and his team never have to deal with another nightmare 46 hour outage.
Chin goes on to explain not only will dynatrace track problems through detection and analysis, but through a life cycle that includes a root cause analysis.
Since Dynatrace is built with AI it can help identify dependencies between that one problem and any other detected so resources are not spread thin trying to resolve the issue. This allows for teams to work across silos to pinpoint the true root cause and resolve the issue.
Ahuja is ready to move all monitoring to Dynatrace on OpenShift. Of course, his very first action will be to move that pesky DSE website that went down for almost two days.
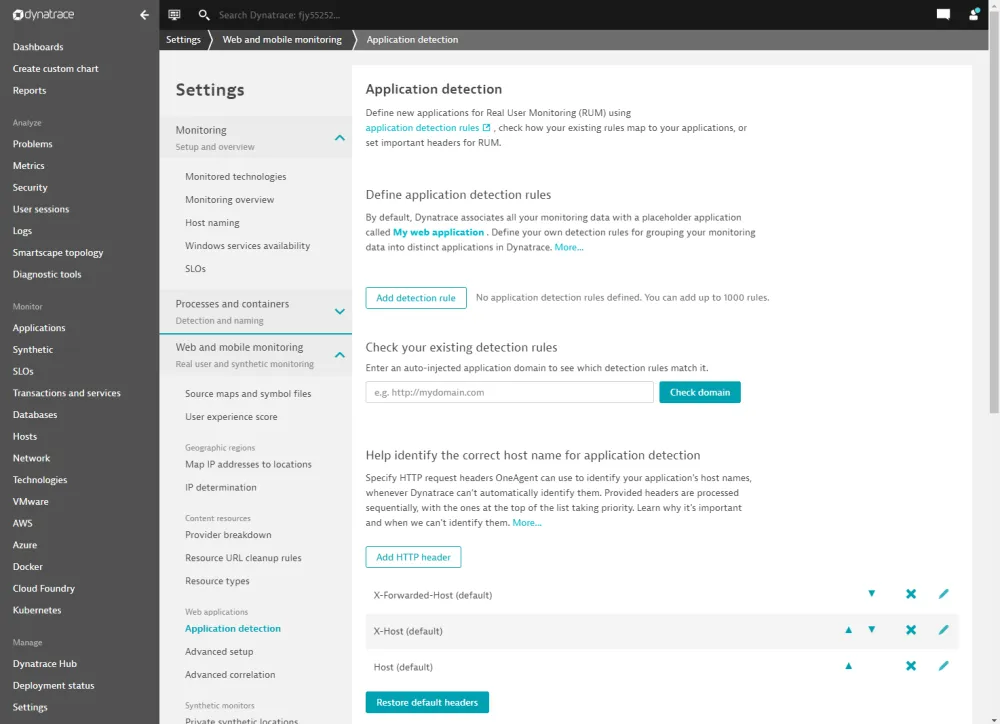
He is even more excited to find out that the work to get digital experience monitoring started is not itself a 46-hour task. While Dynatrace tracks user experience automatically, Ahuja wanted to more easily identify the DSE website as its own application. This was a very easy and basic task that looks like this:
-
From the navigation menu, select Settings > Web and mobile monitoring > Application detection settings and RUM.
-
In the Application detection rules section, you can see the list of defined rules.
-
Select Add detection rule.
-
Use the options offered on this page to create the appropriate detection rule for your application. In this case, we'll want to create a new application named <Whatever the team is naming their app> with a rule matching the domain of the DSE team's new application.
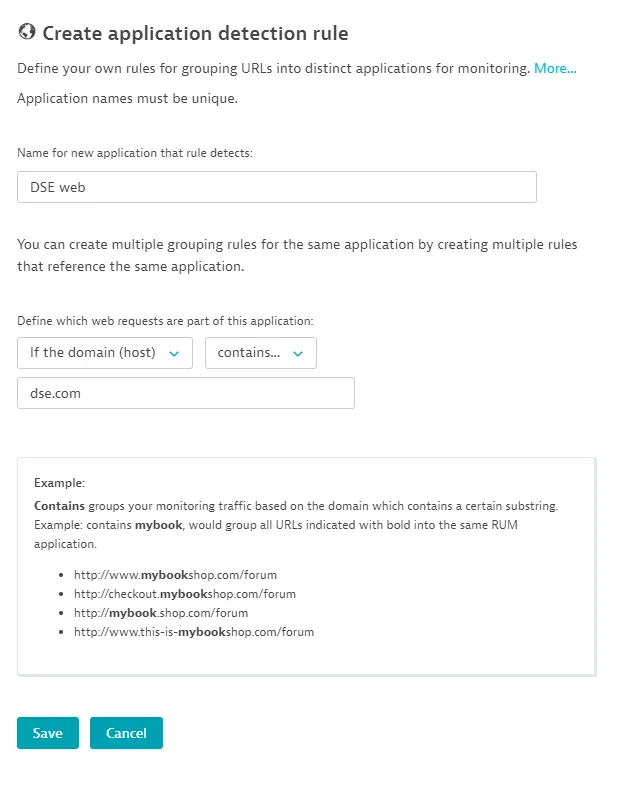
With this completed Ahuja and the full DSE organization can breathe easier about problems being detected and corrected before they ever become an issue. In the rare case they do become an issue, Dynatrace running on OpenShift will be ready to respond, find the root cause and correct the problem and help avoid a major impact to production.
With Dynatrace on their side, Ahuja and Chin part ways pleased that they have tooling in place to help detect and remediate problems. The DSE staff will continue their digital transformation journey. Join them in future posts to learn more of what they did and what you can do for your organization.
저자 소개
David Rojas is a leader with a demonstrated history of working in the information technology and services industry. He has a history in operations management, business development, IT service Management, and IT strategy. Rojas joined Red Hat in May 2019.
유사한 검색 결과
Why building fast does not guarantee success
Red Hat Desktop brings Kubernetes-aligned development to the desktop
Becoming a Coder | Command Line Heroes
Where Coders Code | Command Line Heroes
채널별 검색
오토메이션
기술, 팀, 인프라를 위한 IT 자동화 최신 동향
인공지능
고객이 어디서나 AI 워크로드를 실행할 수 있도록 지원하는 플랫폼 업데이트
오픈 하이브리드 클라우드
하이브리드 클라우드로 더욱 유연한 미래를 구축하는 방법을 알아보세요
보안
환경과 기술 전반에 걸쳐 리스크를 감소하는 방법에 대한 최신 정보
엣지 컴퓨팅
엣지에서의 운영을 단순화하는 플랫폼 업데이트
인프라
세계적으로 인정받은 기업용 Linux 플랫폼에 대한 최신 정보
애플리케이션
복잡한 애플리케이션에 대한 솔루션 더 보기
가상화
온프레미스와 클라우드 환경에서 워크로드를 유연하게 운영하기 위한 엔터프라이즈 가상화의 미래
