Red Hat Insights is a Software-as-a-Service (SaaS) offering developed to help identify and address operational and vulnerability risks before an issue results in operating environment downtime. Findings from your systems metadata analysis are surfaced on the Red Hat Hybrid Cloud Console.
Although the Hybrid Cloud Console offers a unified and centralized view of Red Hat environments, organizations may want to get access to the data and findings from the solution and leverage them in complement to existing operational tools and workflows. Their main goal is to offer a faster way for users to get greater value from combined platforms.
In this article, we consider different approaches to integrate Insights with third-party tooling, and use Grafana as an example to provide a concrete integration. We will show how you can query Insights via its APIs and retrieve key findings and data to populate visual dashboards or external data stores.
What is Red Hat Insights?
Red Hat Insights is a managed service that continuously analyzes your platforms and applications to identify security and performance risks. Insights provides recommendations to remediate potential risks in your environment and is included with Red Hat subscriptions for Red Hat Enterprise Linux (RHEL), Red Hat OpenShift and Red Hat Ansible Automation Platform.
The Insights product page provides additional information about how to get started and about how your data is handled by the platform. All findings identified as affecting your systems can be found on the Hybrid Cloud Console, which is a centralized view into operations, security, and subscriptions of your RHEL and OpenShift systems.
Additionally, many organizations proxy those findings by their local instance of Red Hat Satellite as part of their day-to-day management of operations.
For organizations that use other tools and wish to access Insights findings, the platform provides multiple ways to integrate and embed results into existing operations workflows and third-party application tools.
Different ways to integrate to Red Hat Insights
In a recent Red Hat webinar (now available on-demand) and associated blog post overview, we describe different integration capabilities offered by Insights. These can be classified into two categories: push and pull.
In a push integration, Insights sends HTTP POST messages with JSON body to specific endpoints. We refer to webhooks for generic integrations making use of these messages. They allow for any third-party application to integrate, and are the most flexible for customization, as long as a collector is available on the recipient endpoint. We make use of this type of integration as part of Splunk and ServiceNow integration capabilities that we recently published. Details about our certified Splunk application and its HTTP Event Collector (HEC) can be found in this announcement. Details about our certified ServiceNow application and its inbound REST API trigger can be found in this announcement.
In a pull integration, an external party application queries Insights data using REST APIs. The APIs provide CRUD (Create, Read, Update, and Delete) functionality for all services, and data is sent and received as JSON. Full API documentation is available, and OpenAPI specification for easy integration is included. Additionally, the Red Hat Insights API Cheat Sheet covers the use of the APIs (e.g. authentication and how to obtain system details and findings) and provides sample code in Python and Ansible.
In the rest of this article, we focus specifically on retrieving (“pulling”) data from Insights APIs using its read operations.
Using Insights APIs in a Grafana data source plugin
Grafana is an open source interactive data-visualization platform. It allows its users to query and view data coming from multiple sources in a centralized dashboard(s). This helps analyze what is going on and troubleshoot possible problems by correlating data sources. Red Hat Enterprise Linux (RHEL), Red Hat OpenShift, and Red Hat Virtualization all include Grafana visualization capabilities.
Grafana was built on open principles, and as such embraces the opportunity to foster an ecosystem of partners and users enhancing its platforms and capabilities. To that end, Grafana provides a Grafana Plugins catalog regrouping data sources, applications and panels aimed at extending its platform. Everyone (Grafana Labs, partners and the overall community) can create plugins and make them available for the user community to download and install.
Our goal is to develop one of these plugins to query and retrieve data from Insights APIs, then return it in a format that Grafana understands. For this, we are making use of the provided Grafana data source plugin toolkit to import data from Insights. More information on the toolkit and how to build a data source plugin can be found in this tutorial.
A data source plugin consists of a couple of files containing information about the plugin, its capabilities and its dependencies. For example, we provide configuration settings requirements for endpoint URL, security protocol and authentication to the Insights API. The toolkit makes it easy to provide users with a test mechanism (testDatasource()) to validate their connection during configuration, prior to starting pulling data (query()). We are not covering the implementation in depth in this article, but the plugin code is available to consult in this public GitHub repository.
Once built, the plugin is available for installation from the Grafana plugin catalog. Note that because it is a community plugin, it does not contain a signature and is only available in DEV mode.

Installing the plugin results in the creation of a new data source.

The only configuration required is to specify the authentication mechanism used to authenticate with our Insights API endpoints.

In our example, we select "basic authentication", fill in the "Basic Auth Details" and validate the connection with the "Save & test" button. Grafana performs an authentication request (testDatasource()) and reports back if the test is successful.
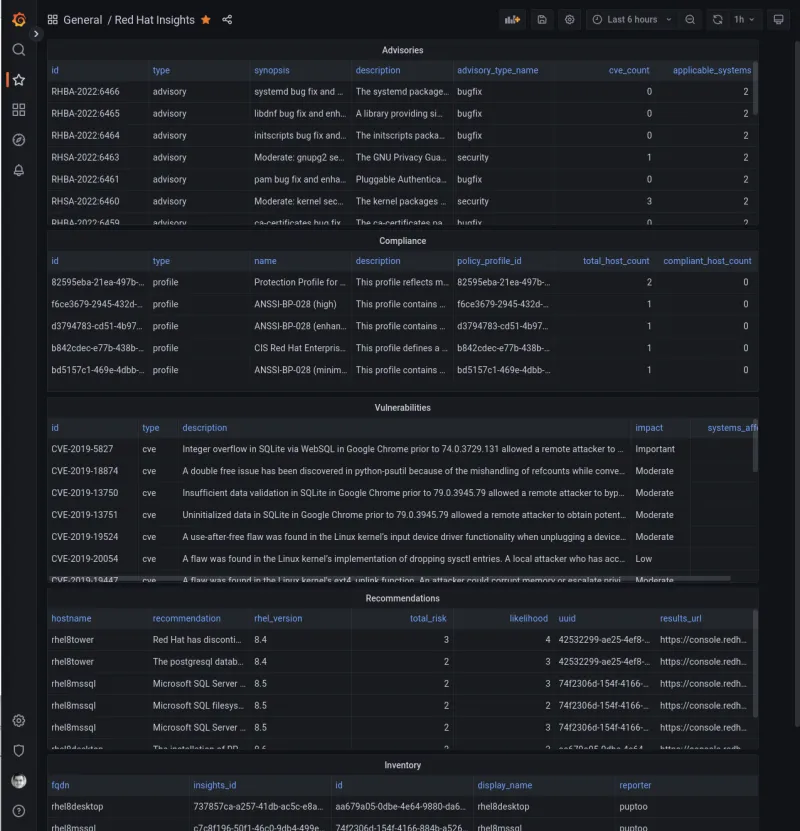
From now on, the plugin is configured to inspect Insights API endpoints and import data to a format that Grafana understands. At the time of this writing, the provided plugin code handles queries and responses from Advisor, Compliance, Inventory, Patch and Vulnerability service endpoints. The name of the service is passed as a "Query param", and is used by the plugin to determine which endpoint to query. In the example below, entering "advisor" as parameter results in the plugin querying the corresponding Advisor endpoint method on the API and parsing the resulting JSON to populate a Grafana data frame.

Those results can be used to create new widgets on dashboards according to your needs. You can find a generic dashboard in the repository as an example to get you started. From there, you can extend with charts and graphs, and use other available visualizations to support your use cases.
The frequency of data pulling can be configured on the dashboard itself. This causes the plugin to request an update from the appropriate API and refreshes the dashboard with the latest data.
Getting started and follow-up
This article provides an example of how third-party applications can use Red Hat Insights APIs to pull data, such as inventory and findings. We offer a Grafana data source plugin to demonstrate the feasibility and provide an example to get you started with the implementation. We encourage forking and improving our code and welcome pull requests from the community.
Please note that the supplied integration is an open source contribution and is not supported by Red Hat.
We hope this article is useful in providing a concrete example of the use of Insights APIs as a way to integrate data and findings into your existing organization workflows. For example, a similar approach can be used to query Insights inventory data and key findings to feed an external Configuration Management Database (CMDB) by creating or updating records.
We are always looking for additional use cases and welcome any feedback that can help the product grow. Product suggestions can be submitted using the Red Hat Customer Portal feedback form.
Sugli autori

Jerome Marc is a Red Hat Sr. Principal Product Manager with over 15 years of international experience in the software industry spanning product management and product marketing, software lifecycle management, enterprise-level application design and delivery, and solution sales.

Gianfranco Sigrisi is an experienced Infrastructure Automation Consultant with a demonstrated history of working in the computer software industry.
Recognized in leading challenging infrastructure and cloud-based projects and providing accurate technical expertise and leadership to achieve successful outcomes. Earned the respect of clients through diligent work and attention to detail with a solid customer focus.
Strong consulting professional skilled in Linux, Automation, Virtualisation, Storage and Cloud computing.
Altri risultati simili a questo
FedRAMP High Authorized Red Hat OpenShift Service on AWS GovCloud
Red Hat OpenShift Service on AWS supports Capacity Reservations and Capacity Blocks for Machine Learning
Communicating the Value of Connecting Systems | Code Comments
SREs on a plane | Technically Speaking
Ricerca per canale

Automazione
Novità sull'automazione IT di tecnologie, team e ambienti

Intelligenza artificiale
Aggiornamenti sulle piattaforme che consentono alle aziende di eseguire carichi di lavoro IA ovunque

Hybrid cloud open source
Scopri come affrontare il futuro in modo più agile grazie al cloud ibrido

Sicurezza
Le ultime novità sulle nostre soluzioni per ridurre i rischi nelle tecnologie e negli ambienti

Edge computing
Aggiornamenti sulle piattaforme che semplificano l'operatività edge

Infrastruttura
Le ultime novità sulla piattaforma Linux aziendale leader a livello mondiale

Applicazioni
Approfondimenti sulle nostre soluzioni alle sfide applicative più difficili
Virtualizzazione
Il futuro della virtualizzazione negli ambienti aziendali per i carichi di lavoro on premise o nel cloud