
As designers our role is to tell visual stories. I got brought in on a project to tell a story about our product technologies, and the relationships they share. I’m no computer wiz, but luckily at Red Hat there’s no short of them. After setting up some one-on-one time, I entered the room with a pen and paper. It was the first day of school again, and this was computer history 101. I’ve never thought too much about what was behind the technology that’s become part of our everyday life, but within 15 minutes my eyes were opened wide.
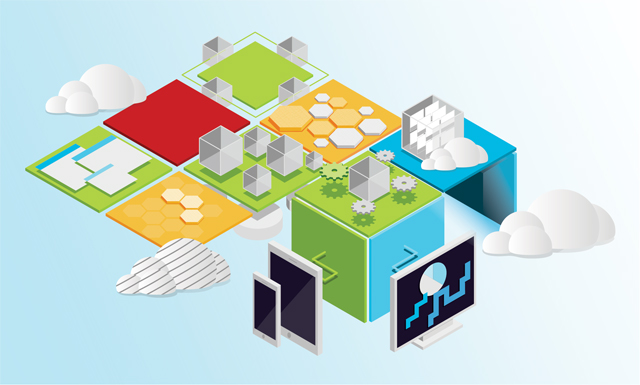
After a crash course in how the tech works, we started to dig into the products that Red Hat provides. Each has its own place in the blueprint of the server and we needed to figure out the best way to show it. The style landed on isometrics.

You’ve probably seen these before as we used them in Summit this year. It’s a method that represents three-dimensional objects in two dimensions. For us in telling this story, they are to be built upon, creating an environment. Each layer representations a product, showing its function, and how it works. Some you’re able to go into detail with while others are built more conceptual. The project is still in works, and will take some brain power – but in the end we’ll tell the story of how our products are built, and how they interact with each other.
저자 소개

유사한 검색 결과
채널별 검색

오토메이션
기술, 팀, 인프라를 위한 IT 자동화 최신 동향

인공지능
고객이 어디서나 AI 워크로드를 실행할 수 있도록 지원하는 플랫폼 업데이트

오픈 하이브리드 클라우드
하이브리드 클라우드로 더욱 유연한 미래를 구축하는 방법을 알아보세요

보안
환경과 기술 전반에 걸쳐 리스크를 감소하는 방법에 대한 최신 정보

엣지 컴퓨팅
엣지에서의 운영을 단순화하는 플랫폼 업데이트

인프라
세계적으로 인정받은 기업용 Linux 플랫폼에 대한 최신 정보

애플리케이션
복잡한 애플리케이션에 대한 솔루션 더 보기

오리지널 쇼
엔터프라이즈 기술 분야의 제작자와 리더가 전하는 흥미로운 스토리
제품
- Red Hat Enterprise Linux
- Red Hat OpenShift Enterprise
- Red Hat Ansible Automation Platform
- 클라우드 서비스
- 모든 제품 보기
툴
체험, 구매 & 영업
커뮤니케이션
Red Hat 소개
Red Hat은 Linux, 클라우드, 컨테이너, 쿠버네티스 등을 포함한 글로벌 엔터프라이즈 오픈소스 솔루션 공급업체입니다. Red Hat은 코어 데이터센터에서 네트워크 엣지에 이르기까지 다양한 플랫폼과 환경에서 기업의 업무 편의성을 높여 주는 강화된 기능의 솔루션을 제공합니다.