IT engineering operations teams need metrics and alerts about almost everything. Zabbix is an option for this type of monitoring, and can be configured to take an action when an unexpected behavior occurs.
Zabbix was designed to be a simple monitoring tool, so its configurations are flexible and offer users a lot of freedom. If configured accordingly, Zabbix can perform automatic actions such as executing a specific job or external script when a trigger occurs. It’s a helpful feature but can cause problems if you have scripts that are not well documented, implementations that don’t follow the best practices, or lack of maintenance and so on. This problem compounds if the person who created all those scripts leaves the company and other folks don’t understand what they do.
The lack of compliance or standards could bring up the following issues:
- The quality of a script depends on the coding skill of the writer
- Scripts written in multiple languages, which could bring complexity and become an issue
- Scripts not maintained in source control, or even worse, in a random directory on the filesystem without any back up
- Some languages might need modules to be used by Zabbix, which means more modules have to be installed on the system, and hence more maintenance is needed
Resolving those challenges isn’t an easy task, but can be managed with a good process and governance.
Besides the scripts, there is another issue that happens when an alert job is triggered. Zabbix, by default, does not expect any response if the action worked or not. So inside the dashboard, Zabbix does not mark the action item as executed. The lack of that information, leaves the administrator in the dark about the results of the action taken. All this happens because Zabbix does not understand that is a part of its job to audit or interpret an external script result.
For Zabbix, no matter whether the job was a case of success or failure, Zabbix will continue to either take another action or just ignore it. The main consequence of Zabbix missing script’s result, is that the Zabbix Administrator is not informed if their remediation was worked or not.
To solve the multiple language issue, the adoption of a simple code language which is easy to maintain and with a low learning curve as well as self documentation is a good alternative. Ansible playbooks are a good fit here since it’s written in a language designed to be readable: YAML. It’s also worth mentioning how easy it is to use Tower thanks to the web UI dashboard.
For the compliance and auditing challenge, Ansible Tower can help, since it is a full enterprise framework designed to control the Ansible Engine, bringing great features and improvements when compared with Ansible Core.
One helpful feature that is embedded in Tower is the Restful API, which can abstract security and machine integrations from the end user. Ansible Tower brings code standardization, control of what has been executed and the result of every playbook execution. Audit and compliance might not be a problem anymore since Ansible Tower complements Zabbix to solve those challenges. To integrate these two tools,Tower-cli must be installed on the Zabbix Server, and when a trigger is activated, Zabbix will run an external script that calls tower-cli, and then tower-cli runs the job template or workflow.
After executing the template, the Ansible Zabbix module sends a notification to Zabbix with the results. This module was developed by Andrew Nelson and can be found on his github here.
Zabbix-Ansible Tower Pipeline
When a server reports an unexpected event and Zabbix detects it, it triggers an action and executes the external script calling tower-cli. Tower-cli will call the Ansible Tower job and then run the job template to correct the failure. Upon finishing the template, Ansible Tower will notify Zabbix and register a message on Zabbix Event History. Figure 1 shows the workflow from how the whole environment works:

Figure 1: tower-zabbix flow chart
Making everything work together
Until now, we’ve discussed a lot of theory, so now let’s put it in action to make sure everything works. The main idea of this lab is that Zabbix detects that a libvirtd process is down and then takes action to call Ansible Tower, which works to bring the libvirtd process back up.
For this lab, the resources needed are:
- Ansible Tower
- Zabbix Server with a tower-cli installed on it
- Linux server with libvirtd as client to simulate the failure
Configuring Tower
On Tower the configuration is the same as it usually is for job templates, so create a new template to execute the playbook, as shown in Figure 2:

Figure 2: Ansible Tower Template creation
On the template vars there are declared three variables, same as are present on the yml playbook:
-
server_url: http://zabbix.example.com/zabbix
-
login_user: ansible
-
login_password: zabbix
Of course this value may change for correct values and data from your Zabbix-Server.
In Figure 3, the variables are set up according to Zabbix server credentials:

Figure 3: Template Variables
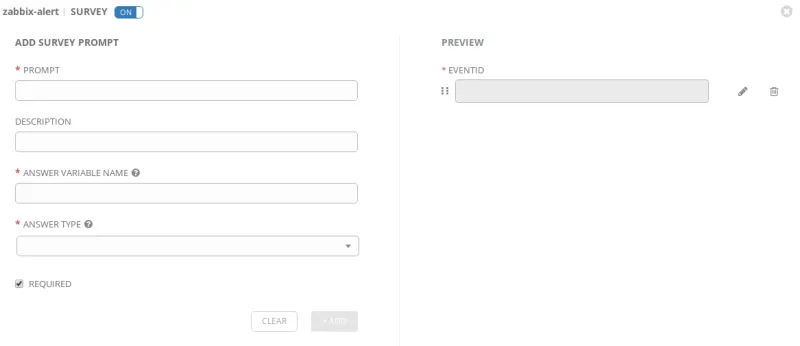
The eventid variable is presented as the “survey variable” to Ansible Tower. To create this an on-the-job template is needed, so click on “new survey” and that will prompt a screen. From there, set variable name as “eventid”, set the “result expected” field to ”integer number” and finally, check the box as “required”. See Figure 4:

Figure 4 : Survey variable configuration
Creating a Remediation Playbook
For example purposes, it is possible to create a playbook that will execute the actions needed to remediate the alert. In this example, it’s a libvirtd failure, but it can be a lot of other stuff including commands or functions. Playbooks document the history and all actions that will be actioned on the run. Here is an example playbook:
---
- hosts: all
 become: true
 tasks:
 - name: Restart Libvirt
   service:
     name: libvirtd
     state: restarted

 - name: Acknowledge alert
   become: false
   local_action:
     module: zabbix_ack
     server_url: "{{ server_url }}"
     login_user: "{{ login_user }}"
     login_password: "{{ login_password }}"
     eventid: "{{ eventid }}"
     message: "Remediation attempted via Ansible Playbook ({{ ansible_date_time.date }} {{ ansible_date_time.time }})"
     close_event: False
The first action is pretty clear: “Restart Libvirt”. The second step is much more complex but provides important information (eventid) that will allow it to notify the Zabbix Server correctly.
This eventid corresponds to the extra vars defined on Zabbix Server as EVENT.ID in the action configuration, and will be passed to Tower as a survey variable.
With all this information, it’s easy to make workflow templates as well, and these will work as a job template.
Working with an external module on Tower is pretty easy, you can put your module in a directory called library on top of the project, as described here.
Configuring Zabbix
First, install tower-cli on Zabbix server:
# yum install tower-cli -y
If you are using epel you can install this:
# yum install python-ansible-tower-cli -y
Tower-cli is a Python package that talks directly to the Tower API. They will call Tower from Zabbix-Server and execute the job template playbook.
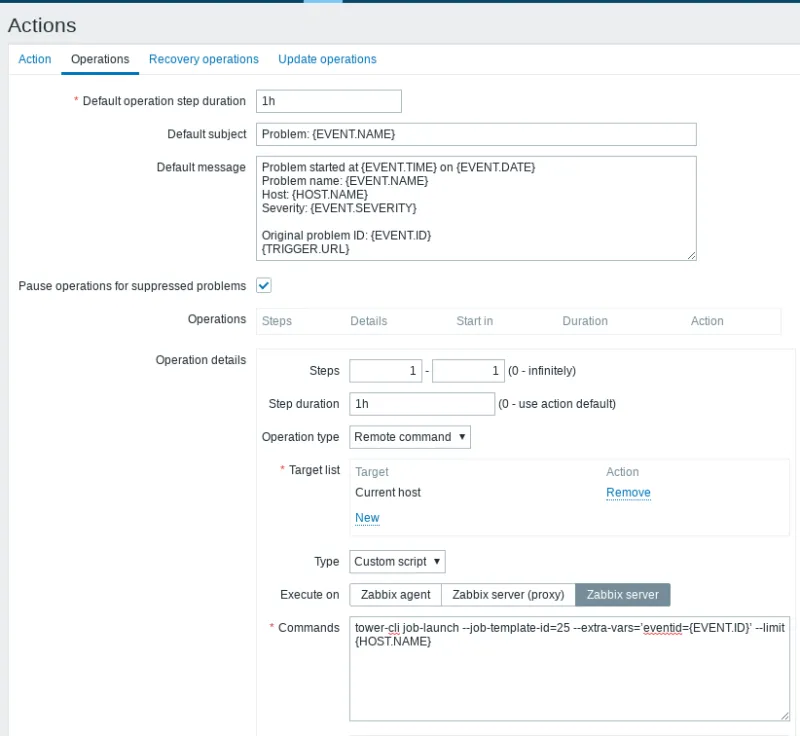
On the Zabbix GUI after creating a trigger, it’s necessary to create an action that responds to the trigger, as Figure 5 illustrates.
Go through: Configuration > Actions > Create new action

Figure 5: Zabbix action Item
The values are created automatically, but a double check is always good to do.
Default Operation skip Duration: 1h
Default subject: problem: {TRIGGER.NAME}
Default Message:
Problem started at {EVENT.TIME} on {EVENT.DATE}
Problem name: {TRIGGER.NAME}
Host: {HOST.NAME}
Severity: {TRIGGER.SEVERITY}
Original problem ID: {EVENT.ID}
{TRIGGER.URL}
Check the option: Pause operation while in maintenance.
The next move is to create a step with the values below:
Step:  1 - 1
Operation type: “remote command”
Target list: current host
Type: custom script
Execute on: Zabbix Server
Commands: tower-cli job-launch --job-template-id=<your job ID> --extra-vars=’eventid={EVENT.ID}’ --limit {HOST.NAME}
For testing purposes it's pretty simple to stop libvirtd on a monitored host and wait for the alert to be triggered. Then you can watch on Tower as the execution happens and when the task is finished, look at Zabbix and search for acknowledged, which is next to triggered alert. If everything works as it should, this message will appear:
Remediation attempted via Ansible Playbook 01/02/2019 12:40
Wrapping up
Zabbix is a flexible and extensible monitoring tool, but it doesn’t have the remediation commands that I would like to see. Ansible Tower is a good complement to Zabbix in two ways: running remediation and alerting Zabbix about the remediation results. The benefit of this configuration is to have a tool that extends Zabbix functionalities and helps improve reliability and ease of operation.
저자 소개
유사한 검색 결과
Friday Five — April 24, 2026 | Red Hat
Building a Center of Excellence for Ansible
Collaboration In Product Security | Compiler
Keeping Track Of Vulnerabilities With CVEs | Compiler
채널별 검색
오토메이션
기술, 팀, 인프라를 위한 IT 자동화 최신 동향
인공지능
고객이 어디서나 AI 워크로드를 실행할 수 있도록 지원하는 플랫폼 업데이트
오픈 하이브리드 클라우드
하이브리드 클라우드로 더욱 유연한 미래를 구축하는 방법을 알아보세요
보안
환경과 기술 전반에 걸쳐 리스크를 감소하는 방법에 대한 최신 정보
엣지 컴퓨팅
엣지에서의 운영을 단순화하는 플랫폼 업데이트
인프라
세계적으로 인정받은 기업용 Linux 플랫폼에 대한 최신 정보
애플리케이션
복잡한 애플리케이션에 대한 솔루션 더 보기
가상화
온프레미스와 클라우드 환경에서 워크로드를 유연하게 운영하기 위한 엔터프라이즈 가상화의 미래
