
Last year Tom Wilkie and I talked at KubeCon Barcelona about the future of Observability. One of our predictions was that correlation across signals would become more and more common. In this post I will demonstrate how we are leveraging those correlations every day within the production systems that the Red Hat Observability group operates, and how that helps us identify the right problems faster.
Our Stack
We use Prometheus, an open source monitoring for alerting on time-series. Our infrastructure runs on OpenShift, Red Hat’s distribution of Kubernetes. Kubernetes (and thus OpenShift) provides us with a simple API to read plaintext logs from our containers. To visualize and analyze latencies between and within individual parts of the infrastructure we use an open source distributed tracing tool Jaeger. And last but not least each of our processes exposes a pprof (the built-in profiles in the go runtime, but also available for rust, python, nodejs and java) endpoint for profiling, and we use Conprof to continuously collect profiles over time.
Debugging Time!
We recently rolled out a new version of Thanos in our infrastructure, and Prometheus quickly alerted us, about high latency.
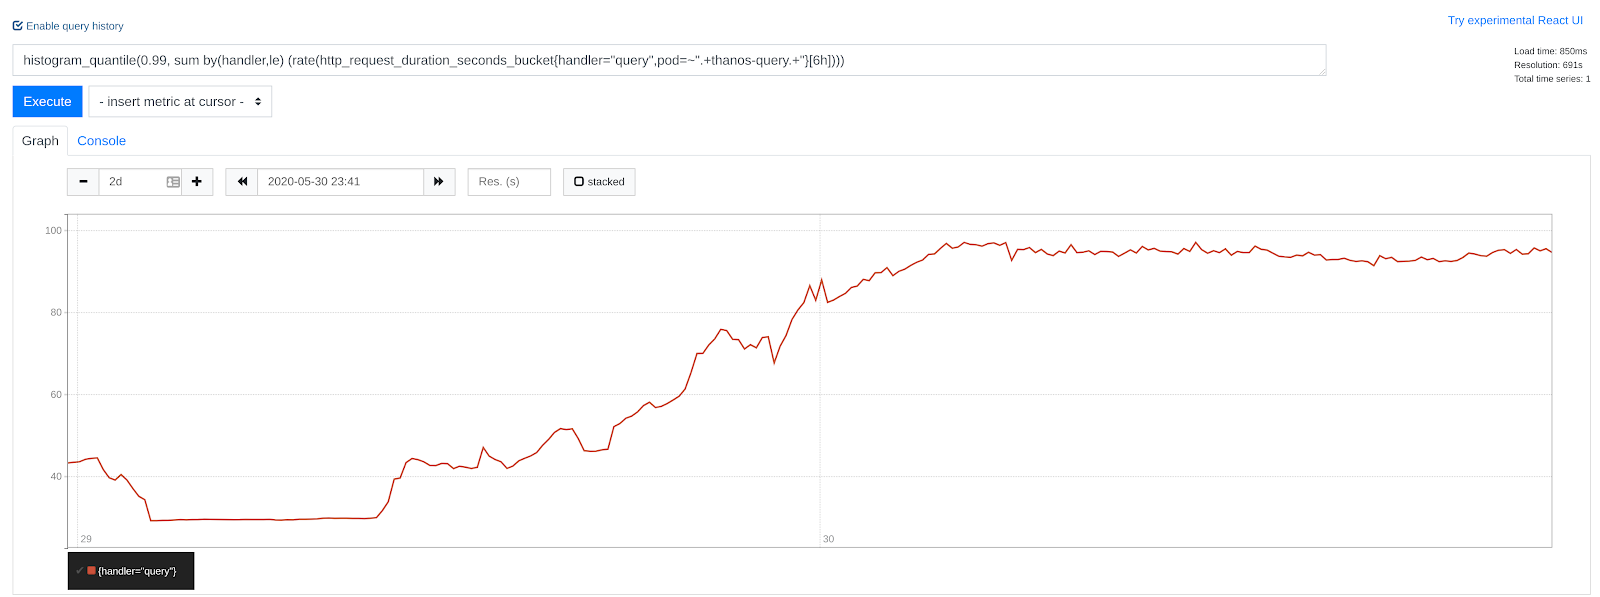
Prometheus graph showing a steady increase in latency after a deployment.
We took advantage of the tooling we had at hand, to debug the problem, rather than rolling back to the previous version. This helped us pinpoint the exact problem and resolved the situation. This kind of situation could happen on any project, even in house product systems, where similar workflows could be applied.
We checked our slow query logs, of our component that first accepts the requests for queries, which immediately revealed a trace ID to us. Any query with latency higher than 5 seconds is written to the slow query log.
ts=2020-06-04T10:59:57.6170538Z component=query-reader msg="request finished" trace-id=23957fb8181c10d4
Log line from a slow query log, showing a trace ID from a slow query.
With this Trace ID, we could immediately pull up a trace in Jaeger of a problematic query.
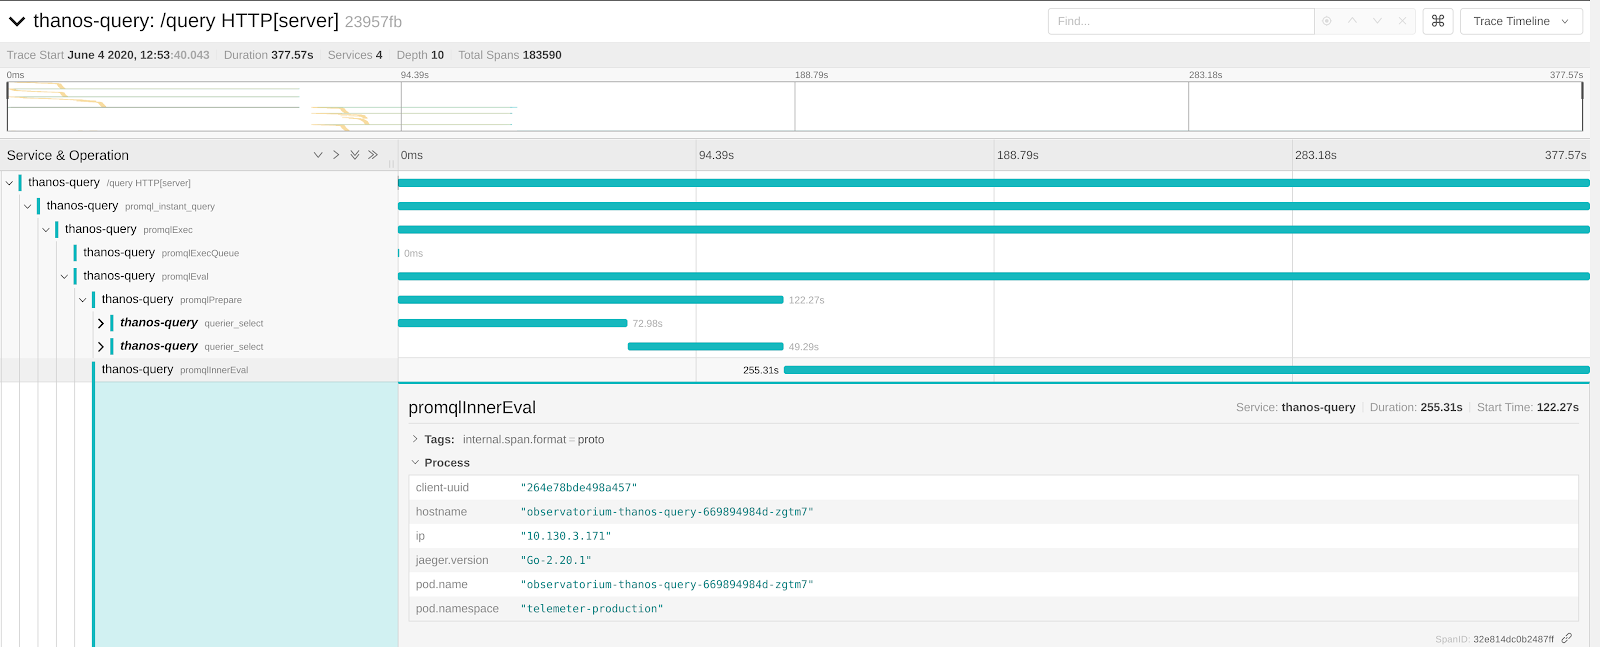
Jaeger’s Trace detail page with detailed information expanded about the process, which created the span.
This was interesting because we could clearly tell that the overwhelming majority of the query was spent in the query engine, and even more importantly, we knew exactly at what time, and which process was crunching away.
We in addition to metrics, logs, and tracing continuously profile all processes we run with Conprof. With the information available from the trace, we could immediately query Conprof.
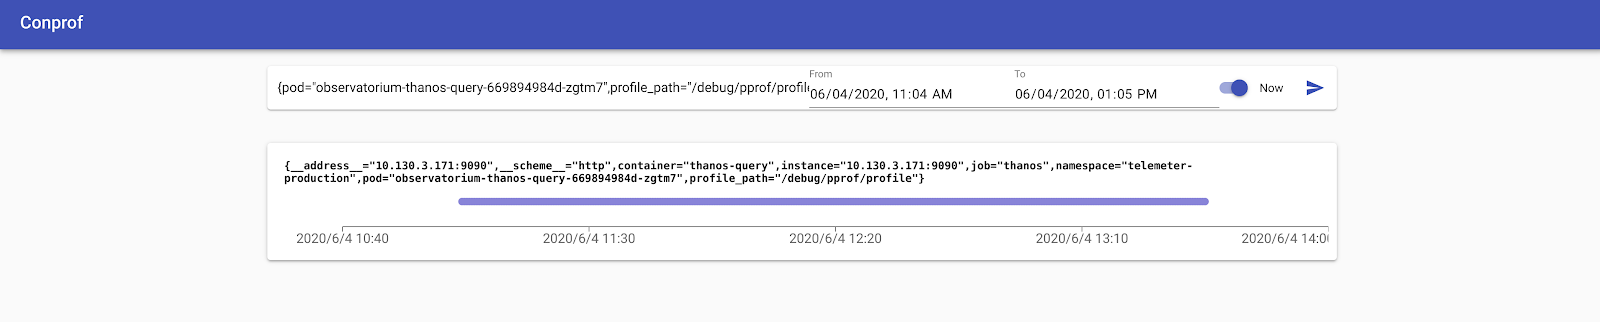
Conprof’s query interface showing many samples over time being collected.
And pull up a CPU profile from exactly that point in time, and lo and behold, we knew where the majority of CPU time was spent.
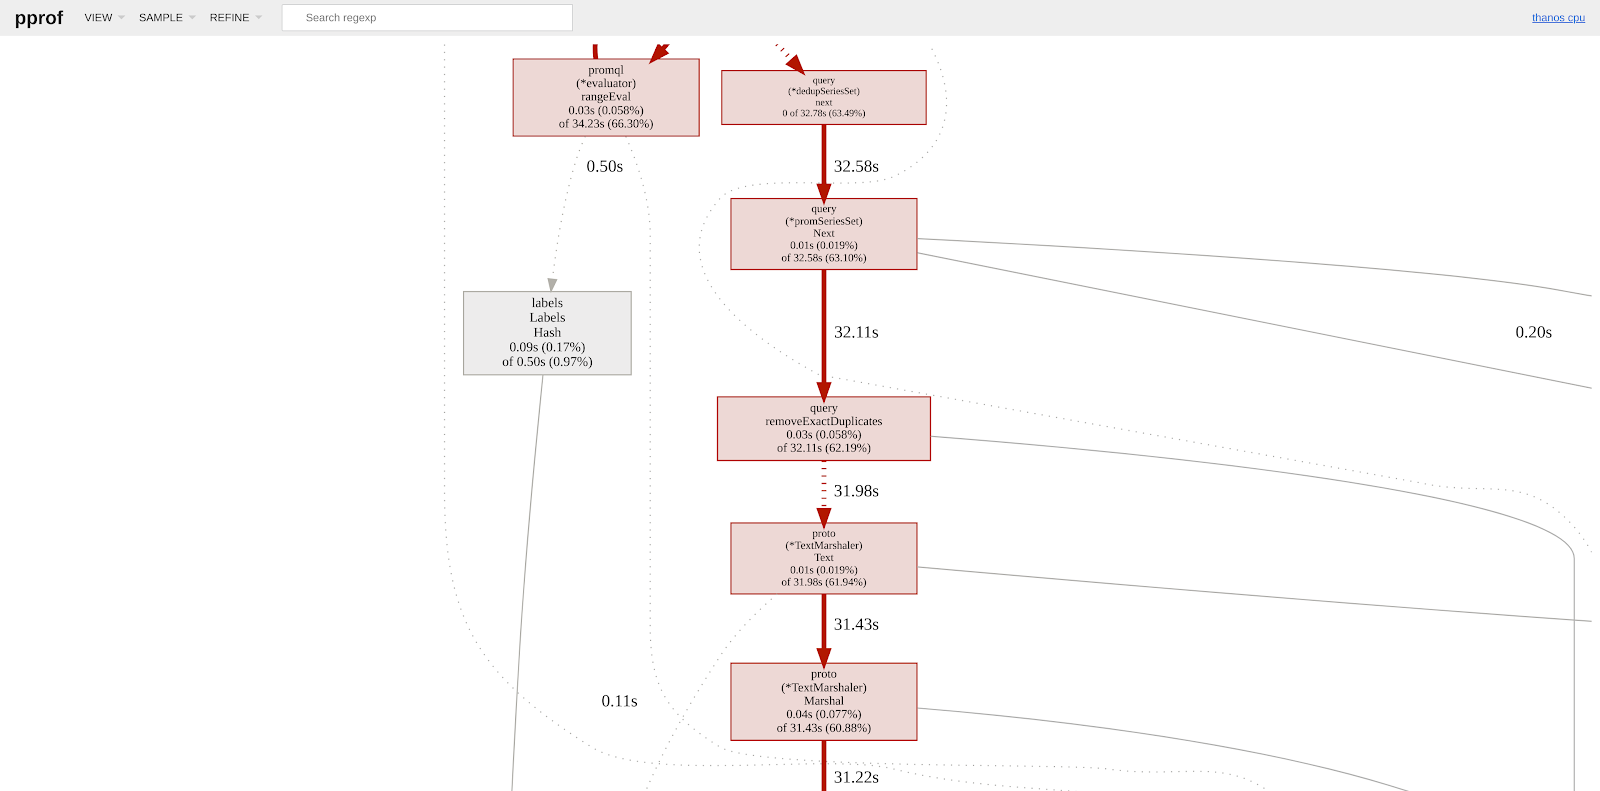
Graph representation of a CPU profile taken from Thanos, showing a clear dominant path.
Discovering this allowed us to cut ⅓ in query latency in Thanos.
Correlations Give Superpowers!
Only the combination of tools and correlating the information made this possible. The entire troubleshooting process took 2 minutes to find, for something that used to take up to days of searching for the needle in the haystack. While it is a bit of upfront effort to instrument applications with metrics, logging, and tracing, as this post hopefully shows, this effort pays off exponentially.
Ever since we have discovered this workflow it has been a powerful tool and has helped us uncover a number of performance improvements much more quickly than we used to.
Using these tools in this way almost felt like a superpower, it felt like cheating, because it was so easy. There is still a lot of work that can be done to integrate these signals more tightly, improve the user experience and automate the correlation aspects more, but what Tom and I predicted in the Keynote, is slowly becoming reality!
Über den Autor
Ähnliche Einträge
4 Gründe für den Image-Modus von Red Hat Enterprise Linux
Das agentische Paradoxon und die hybride KI-Strategie
Scaling with Orchestrators | Compiler
Container Roundup | Compiler
Nach Thema durchsuchen

Automatisierung
Das Neueste zum Thema IT-Automatisierung für Technologien, Teams und Umgebungen

Künstliche Intelligenz
Erfahren Sie das Neueste von den Plattformen, die es Kunden ermöglichen, KI-Workloads beliebig auszuführen

Open Hybrid Cloud
Erfahren Sie, wie wir eine flexiblere Zukunft mit Hybrid Clouds schaffen.

Sicherheit
Erfahren Sie, wie wir Risiken in verschiedenen Umgebungen und Technologien reduzieren

Edge Computing
Erfahren Sie das Neueste von den Plattformen, die die Operations am Edge vereinfachen

Infrastruktur
Erfahren Sie das Neueste von der weltweit führenden Linux-Plattform für Unternehmen

Anwendungen
Entdecken Sie unsere Lösungen für komplexe Herausforderungen bei Anwendungen
Virtualisierung
Erfahren Sie das Neueste über die Virtualisierung von Workloads in Cloud- oder On-Premise-Umgebungen