When it comes to performance metrics data collection and visualization on Linux, PCP metrics collection and visualization are key. Red Hat Enterprise Linux (RHEL) 8 provides an excellent framework for collecting performance metrics and visualizing them! The days of poring over command line output to try and figure out what is happening on a system are gone. In this series, I’d like to introduce the power of using Performance Co-Pilot (PCP) and Grafana to visualize system performance data in RHEL.
By default, Performance Co-Pilot is not installed on RHEL 8. We believe in giving users choices and as such, you have to opt-in to using Performance Co-Pilot.
Prerequisites
-
RHEL 8.3 installed on two servers (in this case our examples are servers with hostnames server-1 and server-2)
-
Grafana version: grafana-6.7.4-3.el8.x86_64
-
PCP version: pcp-5.1.1-3.el8.x86_64
On server-1, run these commands:
yum install pcp-zeroconf -y

systemctl restart pmcd
That’s it! We now have Performance Co-Pilot installed and running on the local server! We can do things like look at the pre-installed performance metrics:
pminfo | wc -l
3101
pminfo | grep kernel | head -n 15
kernel.all.load
kernel.all.intr
kernel.all.pswitch
kernel.all.sysfork
kernel.all.running
kernel.all.blocked
kernel.all.boottime
kernel.all.hz
kernel.all.uptime
kernel.all.idletime
kernel.all.nusers
kernel.all.nroots
kernel.all.nsessions
kernel.all.lastpid
kernel.all.runnable
And then we can report on a metric with pmrep, as such:
pmrep kernel.all.load -s 5
  k.a.load  k.a.load  k.a.load
  1 minute  5 minute  15 minut

  0.020  0.020 0.080
  0.020  0.020 0.080
  0.020  0.020 0.080
  0.020  0.020 0.080
  0.020  0.020 0.080
In the example, I’ve used “-s 5” to indicate that I only want 5 samples of the metric displayed.
Now that we have Performance Co-Pilot set up, it’s time to use Grafana to give us a good overview of our systems.
To do that, run the following commands on server-1 to install grafana:
yum install grafana grafana-pcp -y
systemctl enable grafana-server
systemctl start grafana-server
firewall-cmd –add-service=grafana –permanent
firewall-cmd –reload
Now in a browser, we can go to http://server-1:3000 and login with the username of admin and the password of admin. This is the default password, and as soon as you login, you will be prompted to change the admin user’s password to something more secure.

Next, we need to click the Configuration cog and then “Plugins.” Once on this page, we’ll search for “Performance Co-Pilot App,” click on it and then click “Enable.”

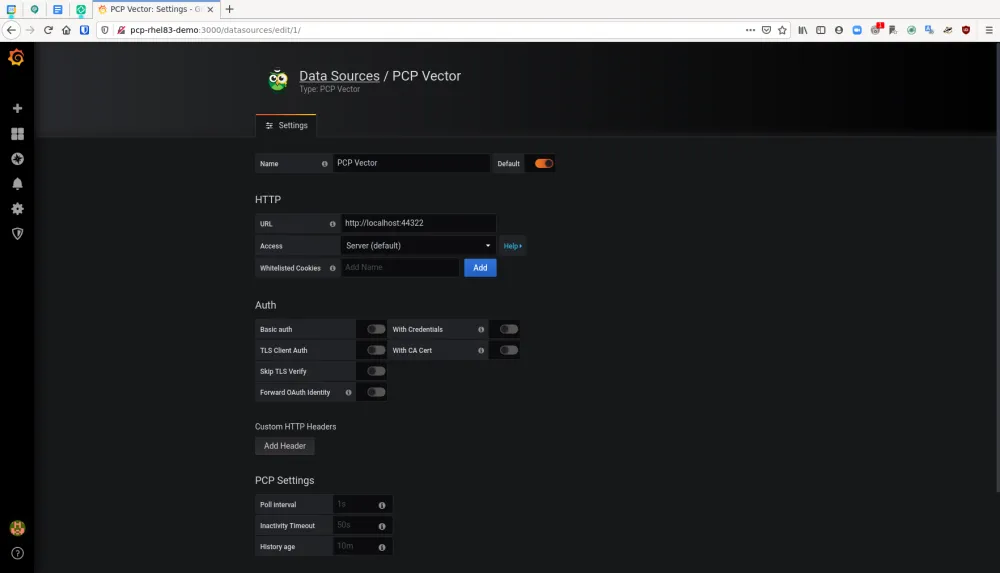
Click on the configuration cog again and go back to “Data Sources.” Click “Add Data Source,” mouse over “PCP Vector” and click the “Select” button that appears. On this form, in the HTTP section, add the url of “http://localhost:44322” and then at the bottom of the form, click “Save & Test.” You should get the message back “Data source is working.”

Click the Dashboard icon and then click “Manage.” You will see an option for “PCP Vector Host Overview.” Click that option.

On this Dashboard, we see a live view of metrics data for server-1. We get metrics such as:
-
CPU Percentage
-
Load Average
-
Memory Utilization
-
Disk Utilization
-
Per-CPU busy (user/system)
-
CPU user%,system%,interrupt%,wait%
-
Scheduler context switches per second and runnable processes.
-
Memory Used/Cached/Free/Page Fault Rate/Hard Fault Rate
-
Network throughput in/out
-
Network drops in/out
-
Network packets in/out
-
TCP connections/timeouts/close-waits/time wait/established/listen errors/retransmits
-
Disk latency/iops/throughput/utilization
 So once again, this is a very broad dashboard of host level data that is easy to enable on a RHEL server. When set up in this manner, PCP and grafana provide a nice, on-demand environment for analyzing performance metrics.
In the next post in this series, we’ll expand our use case to explore using pmseries and Redis to store metrics data from across our estate for historical analysis.
Über den Autor
Karl Abbott is a Senior Product Manager for Red Hat Enterprise Linux focused on the kernel and performance. Abbott has been at Red Hat for more than 15 years, previously working with customers in the financial services industry as a Technical Account Manager.
Ähnliche Einträge
Integrating Red Hat Lightspeed with CrowdStrike for enhanced malware detection coverage
Proving open source is ready for the industrial edge
The Overlooked Operating System | Compiler: Stack/Unstuck
Linux, Shadowman, And Open Source Spirit | Compiler
Nach Thema durchsuchen
Automatisierung
Das Neueste zum Thema IT-Automatisierung für Technologien, Teams und Umgebungen
Künstliche Intelligenz
Erfahren Sie das Neueste von den Plattformen, die es Kunden ermöglichen, KI-Workloads beliebig auszuführen
Open Hybrid Cloud
Erfahren Sie, wie wir eine flexiblere Zukunft mit Hybrid Clouds schaffen.
Sicherheit
Erfahren Sie, wie wir Risiken in verschiedenen Umgebungen und Technologien reduzieren
Edge Computing
Erfahren Sie das Neueste von den Plattformen, die die Operations am Edge vereinfachen
Infrastruktur
Erfahren Sie das Neueste von der weltweit führenden Linux-Plattform für Unternehmen
Anwendungen
Entdecken Sie unsere Lösungen für komplexe Herausforderungen bei Anwendungen
Virtualisierung
Erfahren Sie das Neueste über die Virtualisierung von Workloads in Cloud- oder On-Premise-Umgebungen
