Performance Co-Pilot (PCP) is an open source, distributed, metrics gathering and analysis system. In the latest release of Red Hat Enterprise Linux (i.e. 7.2), we're not only shipping PCP 3.10.6, but a new browser based dashboard, Vector, which is built on top of PCP, and contributed by Netflix. Together, they can provide a comprehensive overview of a local, or remote machine.
In this tutorial, we'll be utilizing two different machines to demonstrate
this powerful functionality.
The environment: our local machine is currently running Red Hat Enterprise Linux 7.2 (with the server-optional repo enabled for the dashboard packages) and a remote server (also on RHEL 7.2) is running our theoretical workload.
First, we want to get the PCP components up and running on our local workstation.
To do this, we'll need to set up PCP's Collector Daemon (PMCD), the Performance Metrics Web Daemon (pmwebd), as well as installing the vector bundle.
# yum install pcp-webapp-vector pcp-webapi
# systemctl start pmcd pmwebd
# systemctl enable pmcd pmwebd
Next - we'll check the output of running $pcp on the command line:
[lberk@toium ~]$ pcp
Performance Co-Pilot configuration on toium:

platform: Linux toium 3.10.0-327.el7.x86_64 #1 SMP Thu Oct 29 17:29:29 EDT 2015 x86_64
hardware: 4 cpus, 2 disks, 1 node, 3831MB RAM
timezone: EST+5
services: pmcd pmwebd
pmcd: Version 3.10.6-1, 7 agents, 1 client
pmda: root pmcd proc xfs linux mmv jbd2
At this point, by pointing our browser to:
http://localhost:44323/vector/index.html#/?host=localhost:44323&hostspec=localhost
...we'll be able to use an instance of Vector, communicating with our local pmwebd, displaying metrics about our localhost.
The screen should look something like this:
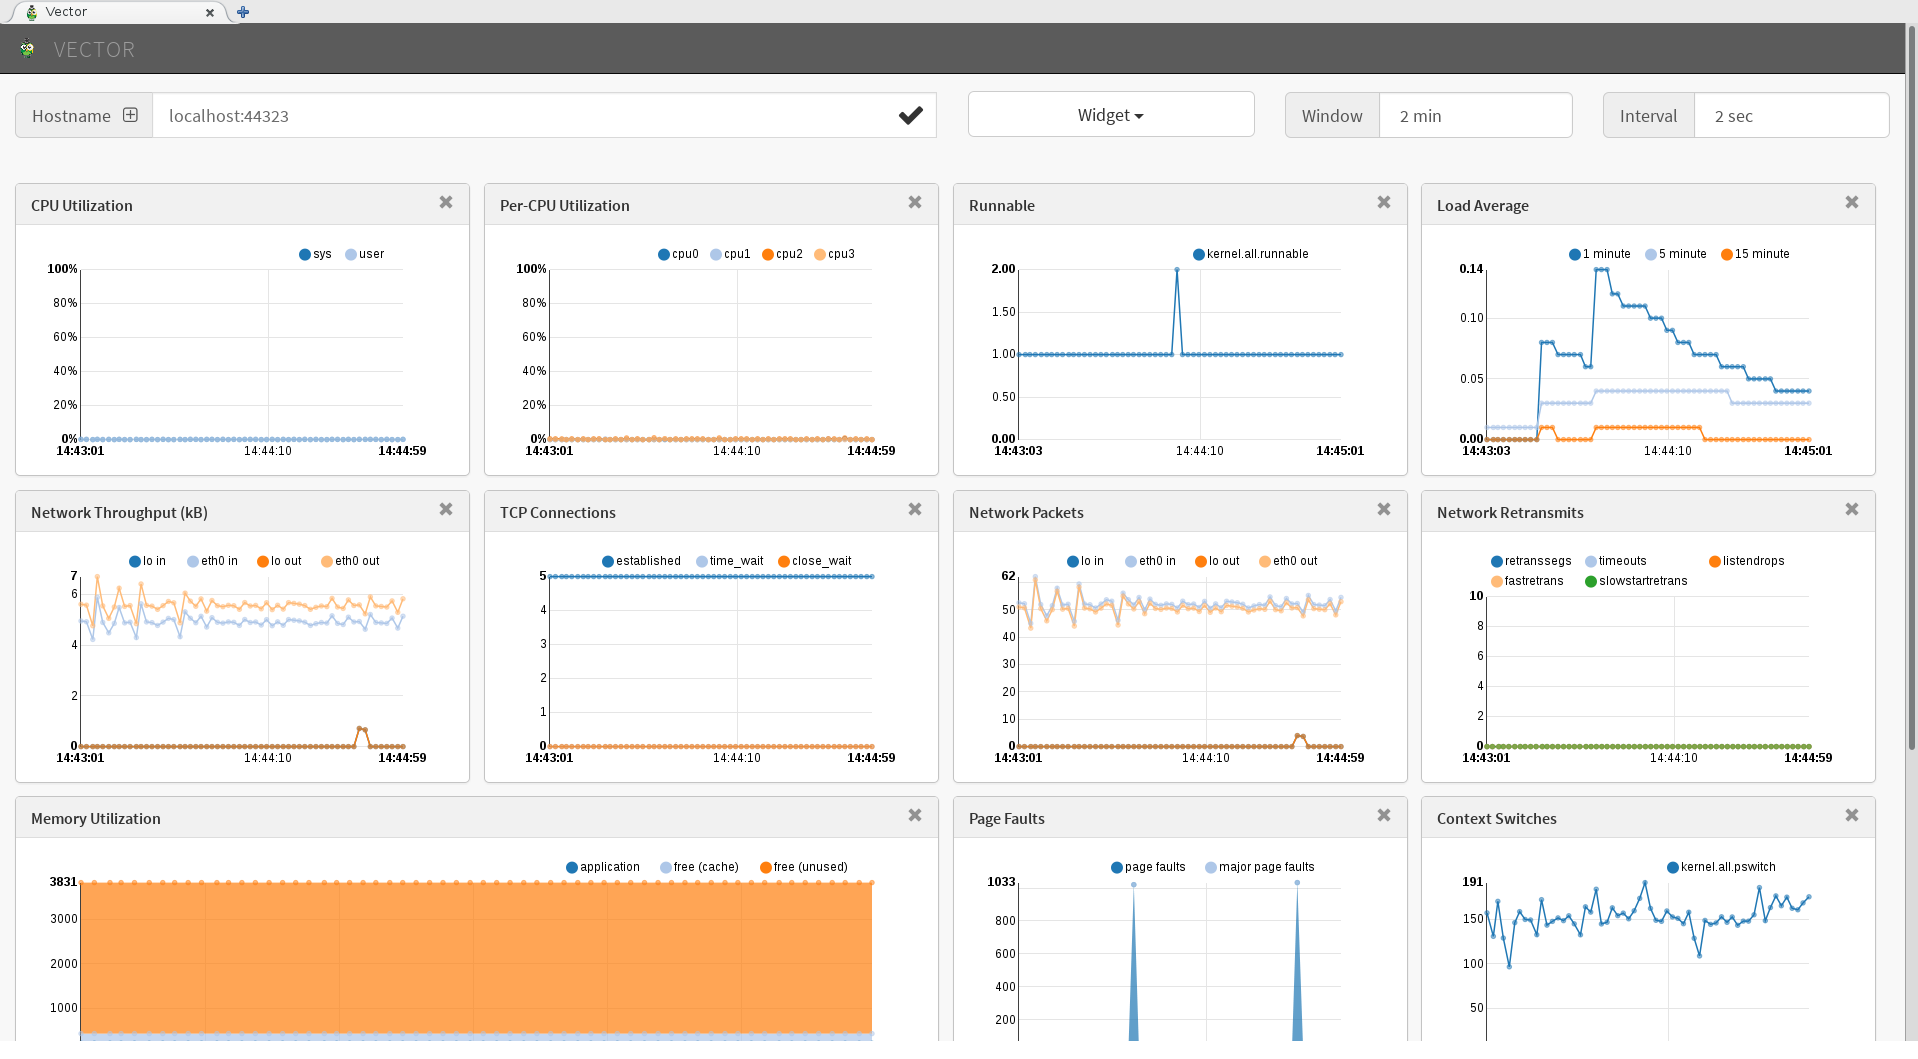
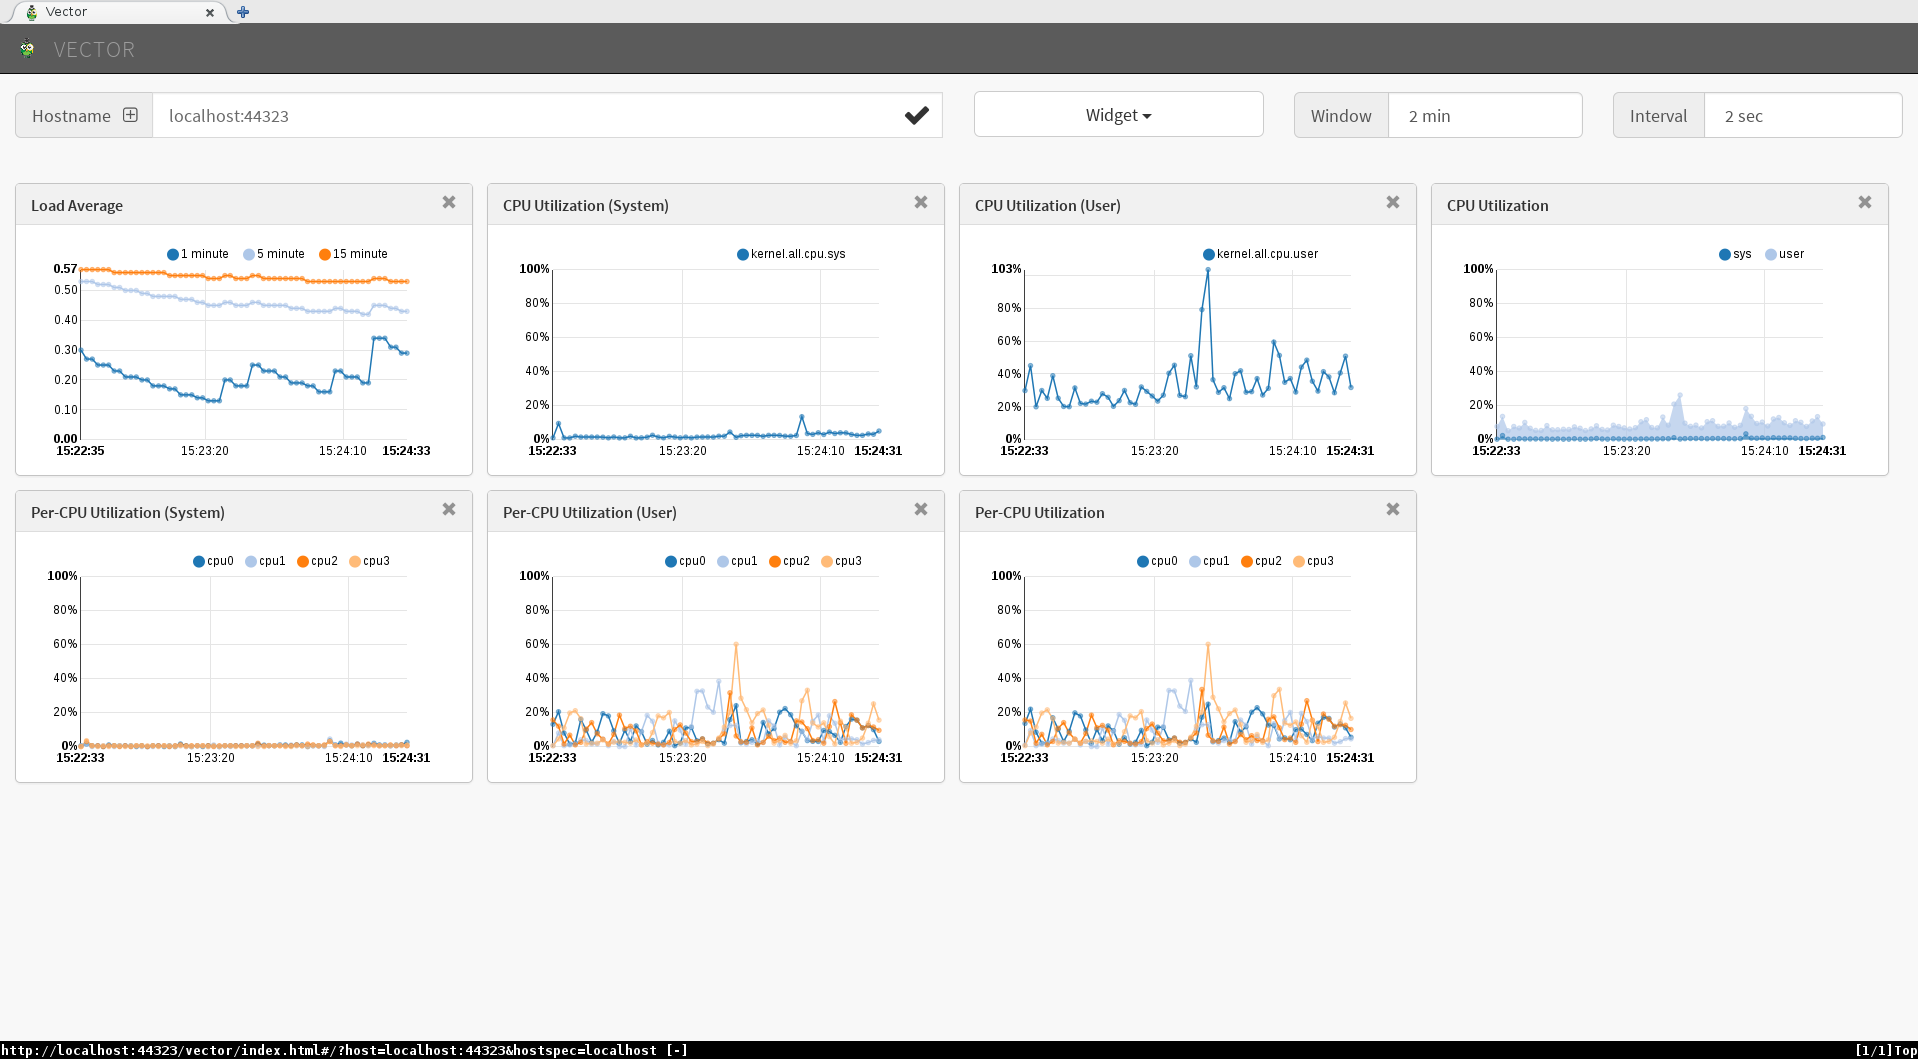
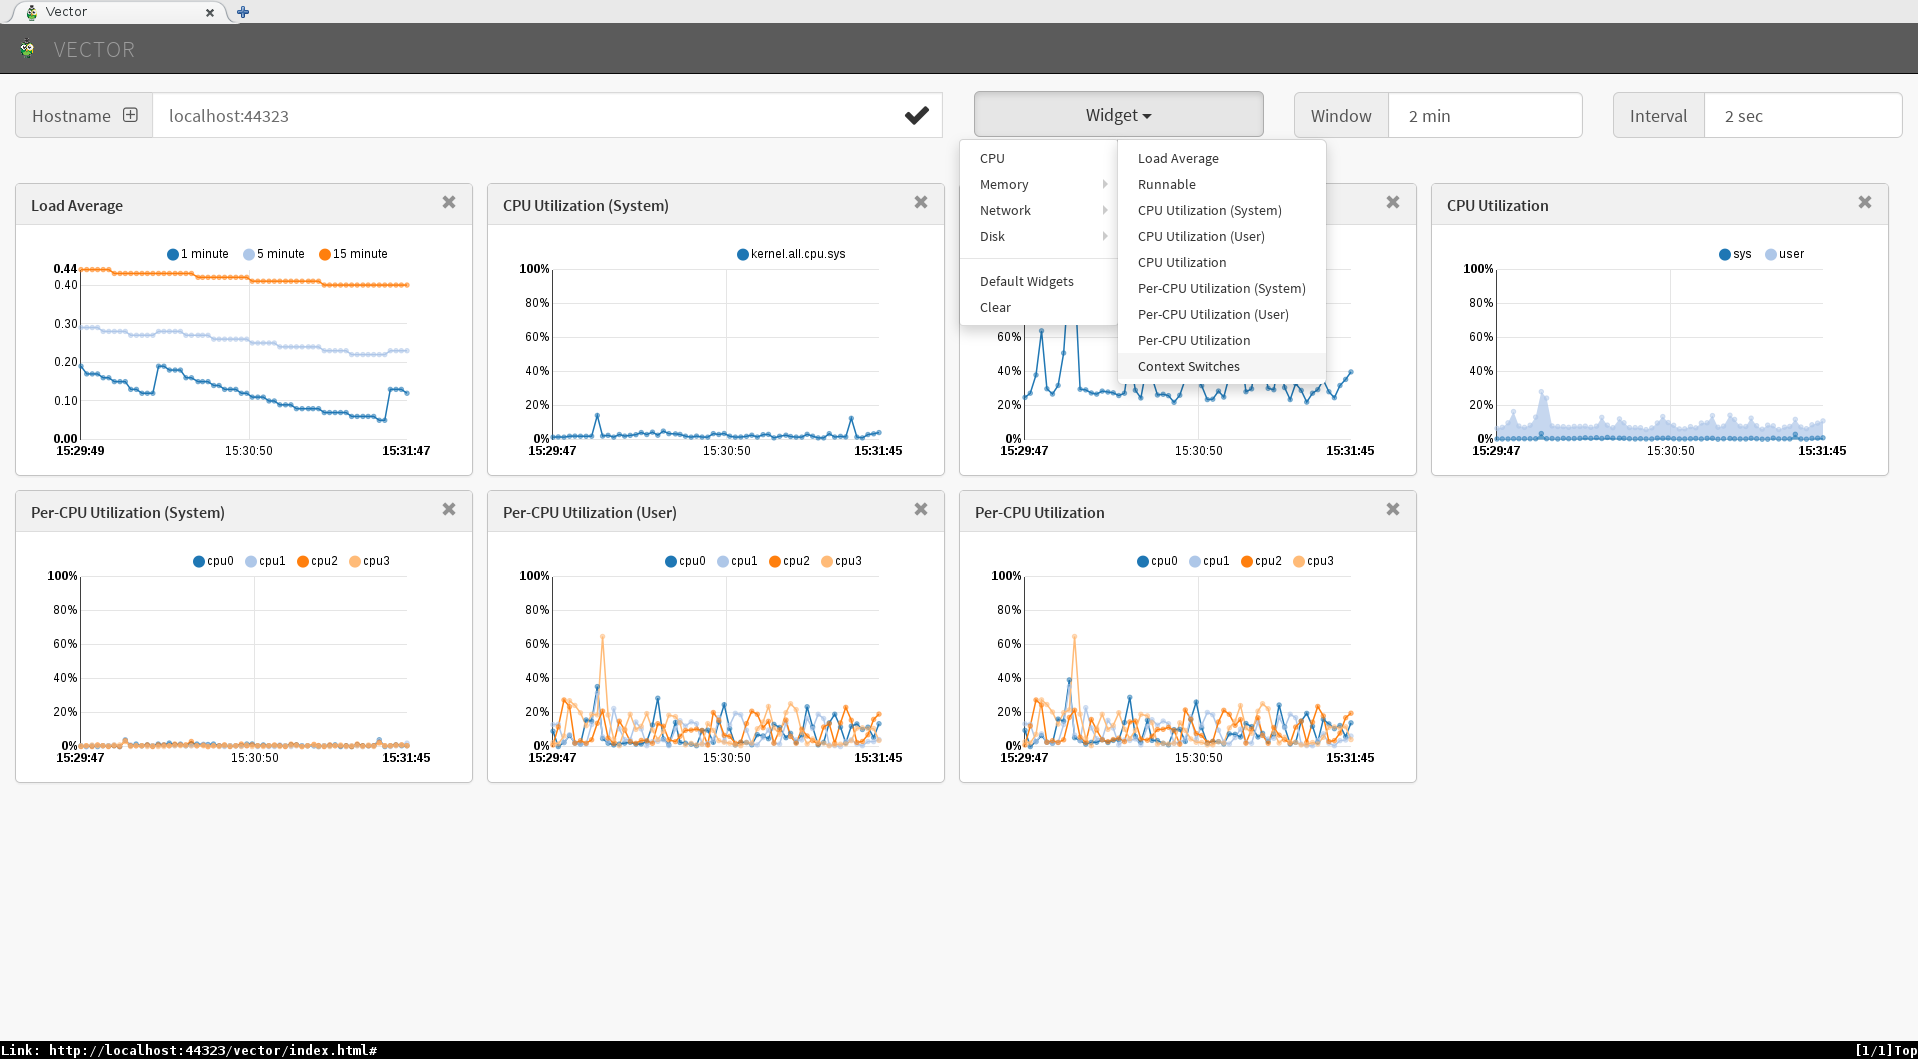
The default dashboard has metrics related to CPU usage, network, memory, and disk usage. However, we can explore a few more metrics about each subsystem by adding them via the 'widget' button. Below is an example adding the 'context switches' metric to a CPU focused dashboard.
While we are viewing and consuming the metrics on our local workstation, it wouldn't make sense to run our dashboard on the same server running our mission critical application. Luckily, PCP's distributed architecture allows for Vector to point our local pmwebd at remote pmcds (performance metric collection daemons).
To illustrate this, we'll set up our remote RHEL7 system to consume metrics through Vector.
# yum install pcp
# firewall-cmd --add-port=44321/tcp --permanent
# firewall-cmd --reload
# systemctl start pmcd
# systemctl enable pmcd

[lberk@rhel7 ~]$ pcp
Performance Co-Pilot configuration on rhel7:

platform: Linux rhel7 3.10.0-327.el7.x86_64 #1 SMP Thu Oct 29 17:29:29 EDT 2015 x86_64
hardware: 2 cpus, 1 disk, 1 node, 1840MB RAM
timezone: MST+7
services: pmcd
pmcd: Version 3.10.6-1, 7 agents, 2 clients
pmda: root pmcd proc xfs linux mmv jbd2
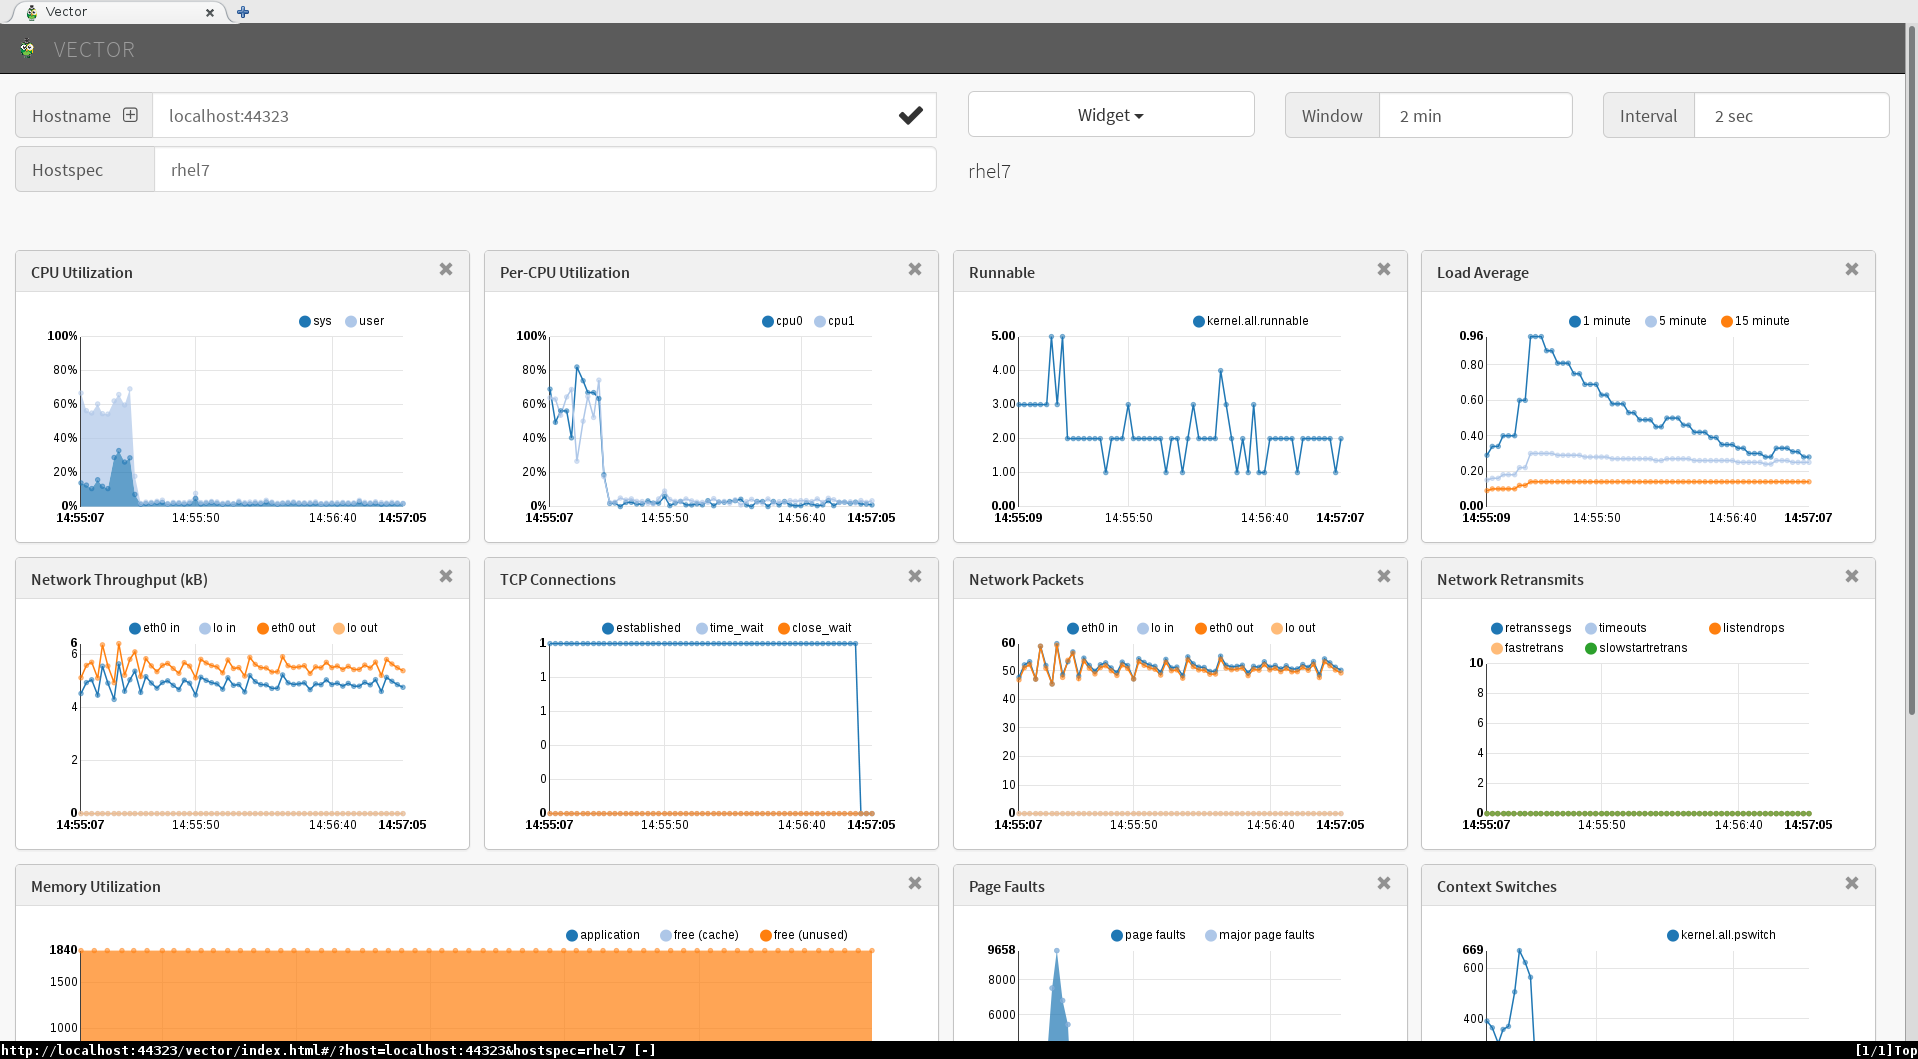
Now, back on our dashboard, the 'hostname' refers to the system which pmwebd is located on (still using localhost). If we hit the (+) operator however, the drop down field lists the Hostspec entry. We'll need to change this Hostspec field to the rhel7 hostname (in our case: 'rhel7'), such as in our screenshot.
 This Hostspec field can be used as a typical pmcd host specification, complete with the ability to monitor container instances on a specific host. It can also be pointed at any running pmcd from PCP version 3.10.4 and upward (making it compatible, for instance, with hosts running Red Hat Enterprise 6.7).
Interested in learning more? Click here. Alternatively, do feel free to reach out with questions using the comments section (below).
About the author

More like this
When AI finds the bugs: Why defense in depth was always the answer
AIOps and Ansible Automation Platform: Where AI intelligence meets trusted execution
Collaboration In Product Security | Compiler
Keeping Track Of Vulnerabilities With CVEs | Compiler
Browse by channel

Automation
The latest on IT automation that spans tech, teams, and environments

Artificial intelligence
Explore the platforms and partners building a faster path for AI

Cloud services
Get updates on our portfolio of managed cloud services

Security
Explore how we reduce risks across environments and technologies

Edge computing
Updates on the solutions that simplify infrastructure at the edge

Infrastructure
Stay up to date on the world’s leading enterprise Linux platform

Applications
The latest on our solutions to the toughest application challenges

Original shows
Entertaining stories from the makers and leaders in enterprise tech