The success of a number of industry applications, such as 5G, autonomous vehicles, industrial automation, and electrical power transmission, relies on the ability to support low-latency network transmission with zero packet loss tolerance. Achieving low latency in a network environment is a complex task, and it is critical to understand the performance of network components such as network adapters and switches. One technology that has shown promise in reducing packet latencies is DPDK (Data Plane Development Kit), which bypasses the kernel network stack and directly accesses network devices.
In this article, we present the results of DPDK latency tests conducted on a single node OpenShift (SNO) cluster. The tests were performed using the traffic generator MoonGen, which utilizes the hardware timestamping support for measuring packet latencies as they pass through the network adapters. The results of these tests provide insights into the performance of DPDK in a real-world environment and offer guidance for network architects and administrators seeking to optimize network latency.
In the first section, we provide an overview of the test methodology applied, which is a loopback test used for measuring key performance indicators such as throughput, latency and packet loss. We then describe the experimental setup used for the tests, including a high-level overview of the hardware and software configurations. The following section presents the results of the latency tests for different throughput rates and raises observations from the test experiments.
Overall, this article offers a comprehensive analysis of DPDK latency in single node OpenShift clusters and provides valuable insights into the performance of network components with low-latency requirements. It is intended for network architects, administrators, and engineers interested in optimizing network performance for real time and low-latency applications.
Test overview
The test generates bi-directional traffic; that is, using equipment with both transmitting and receiving ports. Traffic is sent from the traffic generator, capable of transmitting packets to the Device-Under-Test (DUT), and then receiving back to the traffic generator. By including sequence numbers in the transmitted frames, the traffic generator can check if the packets were successfully transmitted and verify that the packets were also received back.
In the context of DPDK latency in OpenShift, a loopback test is used to measure the round-trip latency of the DUT, a Pod running testpmd, a standard DPDK application. The testpmd application creates a loopback connection and forwards packets between two network ports on the same pod, which allows for the measurement of the round-trip latency for DPDK networking. On the other side of the test setup, MoonGen measures the time it takes for the packets to travel through the loopback connection by timestamping packets that pass through the network adapters.
Topology
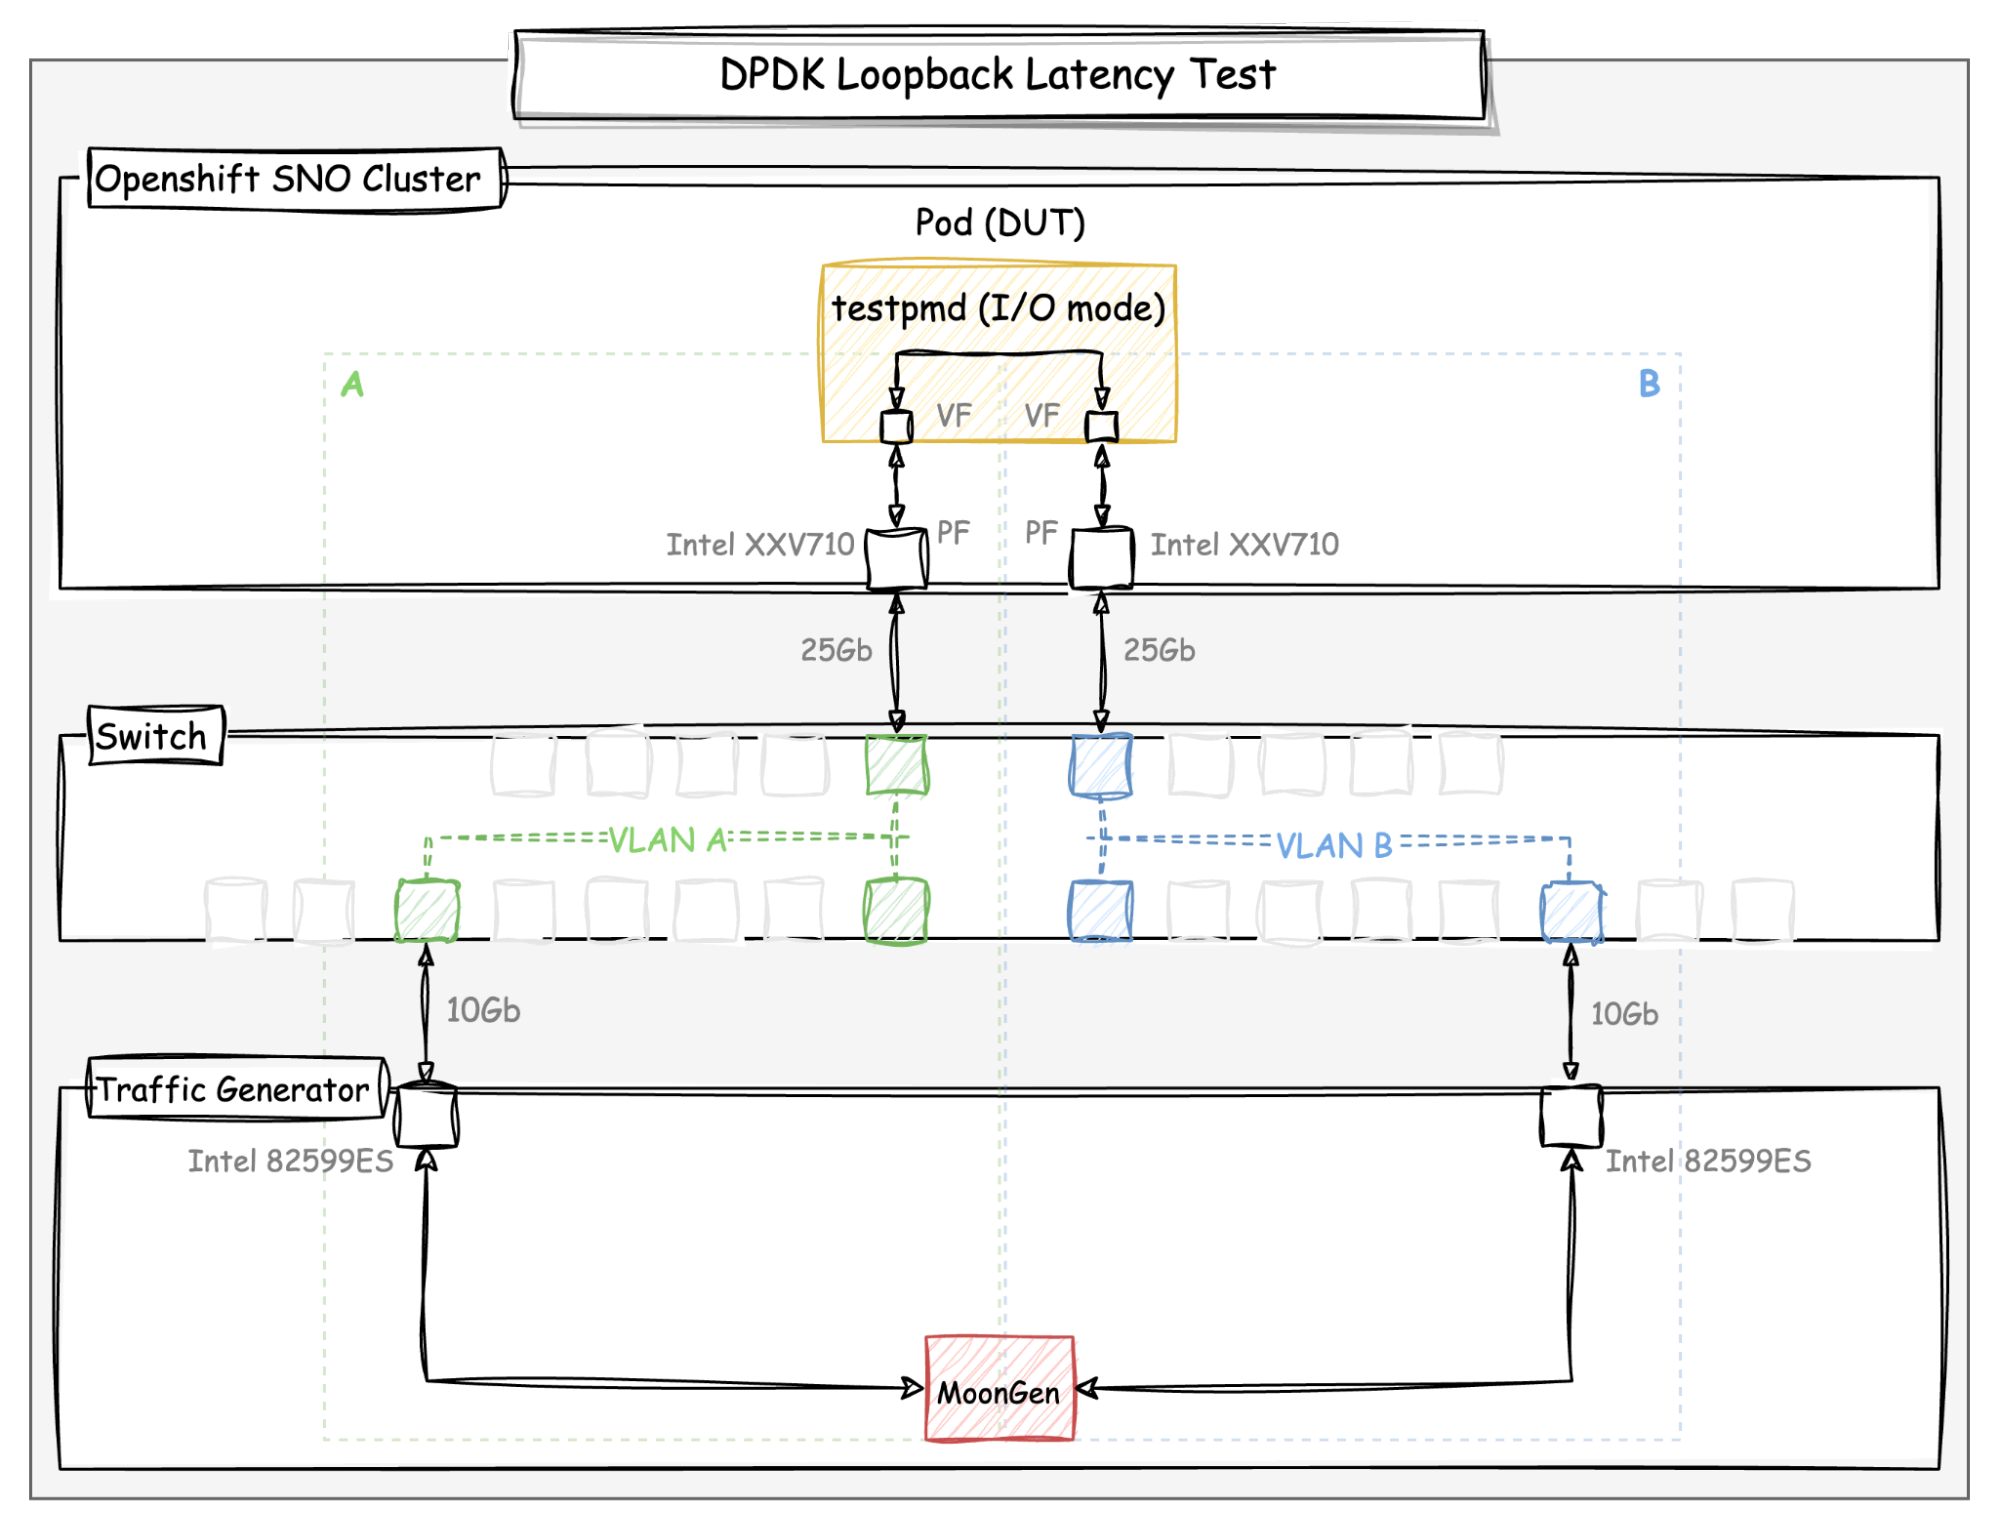
The following diagram shows the DPDK loopback setup used for the latency tests:

Diagram: DPDK loopback latency test setup
The topology is composed of the single node OpenShift cluster, the traffic generator server, and a switch. The loopback test consists of generating packets and measuring the round-trip latency. In this methodology, the setup is divided into two logical networks, A and B, by the VLANs created in the switch. This allows the packet to return from the other logical network, so the packet that is transmitted from network A should return to network B, and vice versa.
The packets are transmitted bi-directionally by MoonGen, so the interfaces at both sides of the network are sending and receiving packets at the same time. The latency measurement is performed by sending packets through the 10G adapters connected to the same VLANs as the other DPDK interfaces from the DUT and it takes advantage of the hardware timestamping support provided by these adapters.
Methodology
In this section, we'll briefly describe the test methodology applied to measure latency for low-latency applications running on a single node OpenShift cluster. The approach aims to determine the maximum (worst-case) round-trip latency for packets sent to the DUT from the traffic generator at a rate of ~10,000 packets per second. The test should run for at least 8 hours in order to confirm consistent and reproducible results.
MoonGen identifies the latency packets by sequentially numbering and checking CRC for each packet that is received back. The latency packet that is "in flight" is the only one that exists at a time; that is, MoonGen only sends the next packet when the previous one arrives. To get more precision from the measurements, the round-trip latency is captured through the hardware timestamping from the device, with no interference from software delays.
System configuration
Hardware
This test environment contains one single system that serves both the master and worker roles, also known as single node OpenShift cluster.
The SNO cluster is a Dell PowerEdge FC640 (Intel Xeon Gold 5218 CPU @ 2.30GHz), which is a “Cascade Lake” processor family. The system has 64GB of memory and 16 cores with two threads per core, and it has been configured with the following BIOS settings:

Table: DUT BIOS settings
The DUT system is equipped with two network interfaces (Intel E810), which are bound to the DPDK driver (vfio-pci) inside the pod. On the other side, the traffic generator server transmits packets through two network interfaces (Intel 82599ES) of 10Gb with the hardware timestamping support for latency measurement.
Software
For this latency measurement, two systems were used: 1) DUT: OpenShift version 4.10 has been installed into the SNO cluster to emulate a real environment on the edge computing for real-time applications; and 2) Traffic Generator (trafficgen): Running on a RHEL bare metal server, it generates traffic and measures the network latency w/ DPDK.
A brief description of each of these systems follows:
DUT
The component that we are measuring the performance of is a SNO cluster, running testpmd, a standard DPDK application. Testpmd runs inside a pod created in the SNO worker node on a dedicated CPU for single-queue transmission (testpmd parameters rxq/txq=1).
The SNO far edge cluster is a standard installation of OpenShift configured as a "ultra-low-latency" vDU (virtual Distributed Unit) host. The configuration includes the performance profile setup; in particular, a real-time CoreOS kernel and power consumption optimized for maximum determinism. Refer to the OpenShift documentation online for more details on how to configure low-latency nodes with the recommended settings.
OpenShift Performance Profile
The following Performance Profile settings have been applied to the SNO cluster for these tests:
apiVersion: performance.openshift.io/v2
kind: PerformanceProfile
metadata:
  name: performance-worker-pao-sno
spec:
  additionalKernelArgs:
  - nohz_full=2-15,18-31
  - idle=poll
  - rcu_nocb_poll
  - nmi_watchdog=0
  - audit=0
  - mce=off
  - processor.max_cstate=1
  - intel_idle.max_cstate=0
  - rcutree.kthread_prio=11
  - rcupdate.rcu_normal_after_boot=0
  cpu:
    isolated: "2-15,18-31"
    reserved: "0-1,16-17"
  globallyDisableIrqLoadBalancing: true
  net:
    userLevelNetworking: true
  hugepages:
    defaultHugepagesSize: "1G"
    pages:
    - size: "1G"
      count: 20
  realTimeKernel:
    enabled: true
  numa:
    topologyPolicy: "single-numa-node"
  nodeSelector:
    node-role.kubernetes.io/master: ""
JSON: OpenShift Performance Profile
Each of these settings will be described in more detail in the second part of this article. For more information, refer to the OpenShift documentation online.
Kernel boot parameters
After applying all of the recommended settings, check in the SNO cluster host the following kernel parameters at /proc/cmdline:
idle=pollWhen "idle=poll" is used, it instructs the kernel to avoid using the native low-power CPU idle states (e.g., C-states) and instead use a polling mechanism to check for workloads, with the cost of reduced energy efficiency.
intel_pstate=disableWhen "intel_pstate=disable" is used as a kernel parameter, it instructs the system to disable the intel_pstate driver in order to have a more stable frequency.
skew_tick=1Using the skew_tick=1 boot parameter reduces contention on kernel locks. The parameter ensures that the ticks per CPU do not occur simultaneously by making their start times 'skewed.' Skewing the start times of the per-CPU timer ticks decreases the potential for lock conflicts, reducing system jitter for interrupt response times.
nohz=on nohz_full=<workload cpus>
Using nohz=on parameter reduces the number of scheduling-clock interrupts (ticks). The second one, nohz_full, specifies "adaptive-ticks CPUs", that is, omit scheduling-clock ticks for CPUs with only one runnable task, ideal for real-time workloads.
rcu_nocbs=<workload cpus> rcu_nocb_poll
The kernel boot parameter rcu_nocbs offloads RCU callback processing to "rcuo" threads and allows idle CPUs enter "adaptive-tick" mode. When using rcu_nocb_poll, the RCU offload threads will be periodically raised by a timer to check if there are callbacks to run. In this case, the RCU offload threads are raised more often than when not using rcu_nocb_poll, so the drawback of this option is that it degrades energy efficiency and may increase the system's load.
systemd.cpu_affinity=<housekeeping cpus>
Overrides the CPU affinity mask for the service manager and the default for all child processes it forks.
isolcpus=managed_irq,<workload cpus>
Attempt to (best effort) isolate CPUs from being targeted by managed interrupts.
nosoftlockup
Disable the softlockup detector. A softlockup is defined as a bug that causes the kernel to loop in kernel mode for more than 20 seconds, without giving other tasks a chance to run.
tsc=nowatchdog
Disable watchdog interruptions from the clock source. The clock source is verified early at boot time.
intel_iommu=on iommu=pt
The parameter Intel_iommu enables SRIOV for Virtual Functions (VFs) in the kernel. The pt option only enables IOMMU for devices used in passthrough and will provide better host performance.
default_hugepagesz=<X>G hugepagesz=<X>G hugepages=<Y>
Pre-allocate Y huge pages of X G each for DPDK memory buffers.
Pod spec
To achieve low latency for workloads, use these pod annotations:
cpu-quota.crio.ioto reduce CPU throttling for individual guaranteed podscpu-load-balancing.crio.ioto disable the CPU load balancing for the pod
"annotations": {
    "cpu-quota.crio.io": "disable",
    "cpu-load-balancing.crio.io": "disable"
}
JSON: Pod annotation
Note: You may include irq-load-balancing.crio.io: "disable" to disable device interrupts processing for individual pods if you are not using globallyDisableIrqLoadBalancing: true in the Performance Profile.
For a pod to be given a QoS class of Guaranteed, every container in the pod must have a memory limit and a memory request. For every container in the pod, the memory limit must equal the memory request. Every container in the pod must have a CPU limit and a CPU request, as follows:
"resources": {
    "requests": {
        "cpu": "14",
        "memory": "1000Mi",
        "hugepages-1Gi": "12Gi"
    },
    "limits": {
        "cpu": "14",
        "memory": "1000Mi",
        "hugepages-1Gi": "12Gi"
    }
}
JSON: Pod resources
Traffic generator
The traffic generator host runs a pinned commit/version of MoonGen on a bare metal RHEL8 system for transmitting packets. MoonGen transmits packets through the 10Gb adapters, which support hardware timestamping, so we can measure the latency with more precision.
Results
This section presents the results from the latency tests executed on the single node Openshift cluster. The result summary is shown in the table below:

Table: Latency results summary (µs)
Before we deep dive into the results, let's understand what the performance metric "latency" means in this context. The definition of latency is explained as follows:
|
"Round Trip Time (RTT) latency, measured from the traffic generator host to the Device-Under-Test host at a throughput rate of 10 thousand packets per second (~10k pps), transmitted in both directions (bi-directional) by a hardware timestamping capable network adapter." |
The test runtime requirement adopted for these experiments is at least 8 hours. This is because short runs may result in inconsistent measurements that are unreproducible given the nature of the environment, which is subject to external interference over time. It's important to keep in mind that the goal of this experiment is not only to find the best latency, but also to determine the worst-case latency that can be sustained in a real-world scenario.

Chart: Minimum, median, and maximum latencies
In this test, we observed the minimum latency at 3 µs and the maximum approx. at 13 µs. Median latency is around 7 µs, with a standard deviation of 0.4 µs. For short runs, measured latencies were closer to the average number, while in the long runs we find more outliers. The full list of statistics is shown in the output below:
[INFO]  [Forward Latency: 0->1] Median:                7075.000000
[INFO]  [Forward Latency: 0->1] Minimum:               4951.000000
[INFO]  [Forward Latency: 0->1] Maximum:               12204.000000
[INFO]  [Forward Latency: 0->1] Std. Dev:              395.170234

[INFO]  [Reverse Latency: 1->0] Median:                7088.000000
[INFO]  [Reverse Latency: 1->0] Minimum:               3059.000000
[INFO]  [Reverse Latency: 1->0] Maximum:               12711.000000
[INFO]  [Reverse Latency: 1->0] Std. Dev:              396.890650
Output: Round trip latency statistics (in nanoseconds)
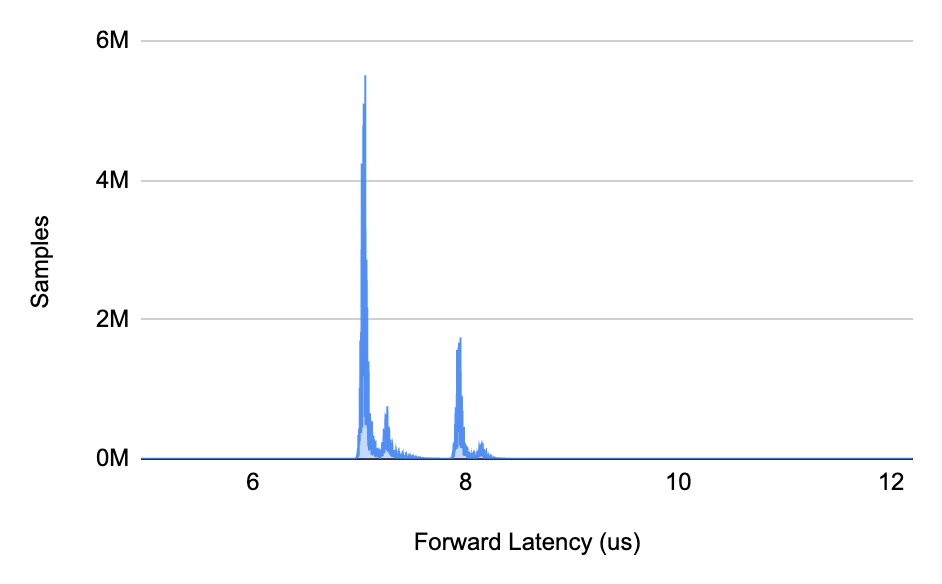
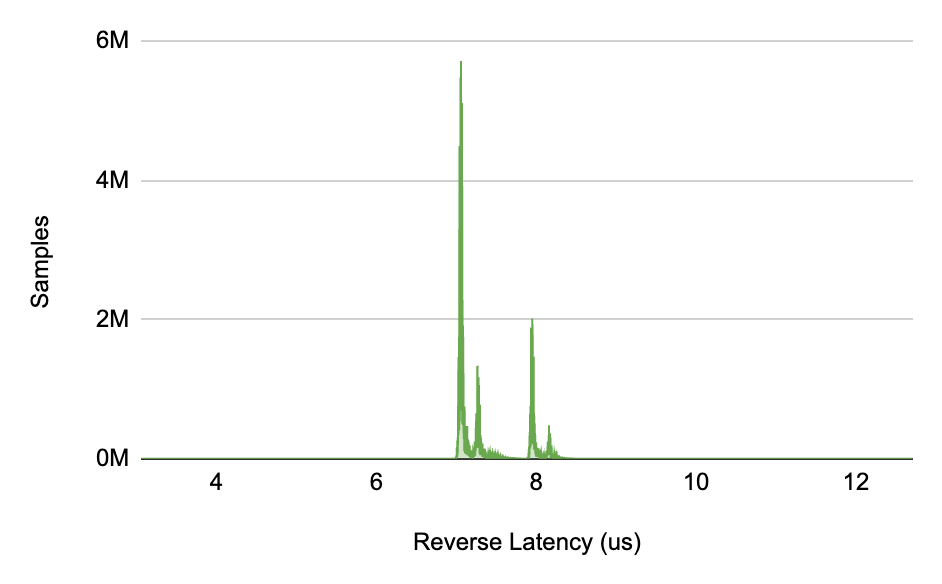
To better understand what these numbers mean, we can look at the distribution for the samples collected and observe the concentration of the samples around 7 µs. The following charts illustrate these latency sample distributions, separated by traffic direction. As we shift to the right of the charts, we barely see samples for latencies higher than 8, which clearly indicates outliers.


Chart: Latency distribution for forward and reverse directions (bi-directional traffic)
In order to ease our analysis and interpretation, the latency samples were collapsed/combined into ranges of 1 µs, the unit granularity adopted for these tests, which is also referenced as latency buckets. Latency buckets that are in the small range of 7-8 µs have the highest sampling count and are more likely to happen. On the other hand, latencies higher than 8 µs are much less representative in this data set.
An interesting way of interpreting what a number represents in a large data set is to calculate the percentile. A percentile, a common term used in statistics, expresses how a score compares to other scores in the same data set. For example, the Nth percentile indicates the percentage of scores that falls below a particular value N in a data set. By looking at our results, we observe that the 7 µs latency mark has the top count with more than 223 millions of samples, while a latency of 9 µs is ranked at the 99.9th percentile. In other words, the latency score of 8 µs is higher than 99.9% of all samples measured.
The percentiles for each latency bucket of 1 µs are shown in the table below:

Table: Latency buckets
Final remarks
This post is just the beginning of our performance journey, which has been enlightening. Through meticulous measurement and analysis, we were able to demonstrate that it is possible to run low-latency applications in a single node OpenShift cluster configured as an ultra-low-latency vDU host.
The results indicate that in the worst case, the maximum round trip latency is 13 µs, which is sustained for more than 8 hours of testing. The median score of 7 µs demonstrates the capacity of the real-time applications to consistently achieve low-latency requirements.
There is still margin for improvements through buffer tuning and parameters tweaking; for example, testing variations of SMT, number of queues, RX/TX descriptor sizing, memory buffer, interrupt throttling interval, etc. Finding optimal values for these parameters combined requires careful experimentation and the interpretation is very likely to be misleading.
This is the first in a series of articles about DPDK low latency in OpenShift. In this article, Part I, we covered the test methodology, a high-level view of the configuration, and the results. In Part II, we will describe the low-latency configurations in more detail, such as pod specifications, cpu isolation, and OpenShift settings.
We'll continue to explore options to identify the latency spikes and characterize the real-time workloads. Further analysis also includes fine-tuning, tracing, debugging, and code instrumentation.
Sugli autori
Rafael Folco is a member of the Performance and Scale Engineering Team.
Member of Red Hat Performance & Scale Engineering since 2015.
Andrew Theurer has worked for Red Hat since 2014 and been involved in Linux Performance since 2001.
Altri risultati simili a questo
Shift gears: 10 stories redefining enterprise IT
Friday Five — March 20, 2026 | Red Hat
Keeping Track Of Vulnerabilities With CVEs | Compiler
Post-quantum Cryptography | Compiler
Ricerca per canale
Automazione
Novità sull'automazione IT di tecnologie, team e ambienti
Intelligenza artificiale
Aggiornamenti sulle piattaforme che consentono alle aziende di eseguire carichi di lavoro IA ovunque
Hybrid cloud open source
Scopri come affrontare il futuro in modo più agile grazie al cloud ibrido
Sicurezza
Le ultime novità sulle nostre soluzioni per ridurre i rischi nelle tecnologie e negli ambienti
Edge computing
Aggiornamenti sulle piattaforme che semplificano l'operatività edge
Infrastruttura
Le ultime novità sulla piattaforma Linux aziendale leader a livello mondiale
Applicazioni
Approfondimenti sulle nostre soluzioni alle sfide applicative più difficili
Virtualizzazione
Il futuro della virtualizzazione negli ambienti aziendali per i carichi di lavoro on premise o nel cloud

