
The easiest way to get people to read what you write is to make diagrams and technical illustrations prominent in your documentation. A graphic should represent every key concept in your document. Why? Because pictures get attention and convey a lot of information quickly.
Don't believe me? Try this experiment.
Understanding the power of pictures
Below are two videos.
Take a look at this first one only once with no repeating or pausing.
Tell me, what's it about? Bet you can't answer the question.
Now take a look at the second video, again only once with no repeating or pausing.
(A description of the contents of each video is provided at the end of this article.)
I'll wager that you can figure out some of the content in the second video. Let me explain the details.
People read by pictures first
Back in the early 1990s, before the Internet was what it is today, the way people learned how to set up a computer was by reading the user manual that came along with it. Back then, I worked at the third-largest computer manufacturer in North America. The company used a direct-to-customer business model. People called up by telephone to purchase a computer which the company shipped to them via UPS. Part of the purchase was free tech support.
It turned out that non-technical users had a hard time setting up their machines, despite having a manual at hand. As a result, they called tech support for help, and each call to them cost the company a good deal of money. Wanting to reduce technical support costs, the company decided to find out why the user manuals weren't working. So they sent the problem to the Usability Department.
This is where I come in. At that time, I was attached to the Usability Department.
We ran a study where we put an unopened box with a computer in a laboratory room that looked like a home office. The room had several video cameras positioned at different angles to observe and record the activities in the lab.
We paid subjects to come in to unbox and set up the computer. We watched them very closely. The first thing most of the subjects did was to open the manual and try to follow the setup instructions. Just about all of the subjects leafed through the pages of the manual. However, when a subject came across a page with a picture, he or she stopped, looked at the picture, and read the page. This observation was an important piece of information.
After the study, the company implemented a new policy for writing user manuals: every page that described a concept or action had to have an illustration on it. The hope was that as the number of images went up, the call rate would go down. The correlation was hard to ignore. And, as I recall, I think that the call rate did go down.
No matter what, the lesson I learned from that study is one that I use today. People read by pictures first. The following is a concrete example that proves the point.
A concrete example
Consider the following piece of technical writing that uses only text.
In this scenario, you will install a demonstration microservice written under Node.JS and installed as a Docker container from DockerHub.
The application has two subordinate services, frontend and business. The frontend service delegates to business to call worldclockapi.com to get the current time. However, because the microservice will be running under a Kubernetes cluster controlled by an Istio service mesh, users cannot access the frontend service by default. An ingress rule is needed to allow access. Part of this scenario is to apply a pre-installed ingress rule to Istio.
However, even if users could access the microservice, the microservice would not be fully operational because the subordinate service, business, will still try to access worldclockapi.com. Istio will not permit this unless an egress rule is set to allow calls to the external site. The final part of this scenario is to apply a pre-installed egress rule to Istio to allow access to worldclockapi.com.
Now take a look at the same text with a diagram added.
In this scenario, you will install a demonstration microservice written under Node.js and described as a container.
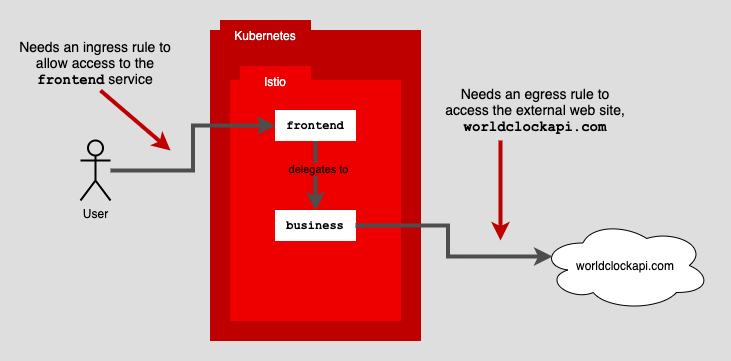
Figure 1: Using ingress and egress rules to control routing in an Istio service mesh under Kubernetes
The application has two subordinate services, frontend and business. The frontend service delegates to business to call worldclockapi.com to get the current time. However, because the microservice will be running under a Kubernetes cluster controlled by an Istio service mesh, users cannot access the frontend service by default. An ingress rule is needed to allow access. Part of this scenario is to apply a pre-installed ingress rule to Istio. (See Figure 1.)
However, even if users could access the microservice, the microservice would not be fully operational because the subordinate service, business, will still try to access worldclockapi.com. Istio will not permit this unless an egress rule is set to allow calls to the external site. The final part of this scenario is to apply a pre-installed egress rule to Istio to allow access to worldclockapi.com.
Which version of the documentation will get the reader's attention quickly and will be easier to comprehend? I'll hazard to say the version with the diagram will be your preference. As you can see, pictures work!
Putting it all together
Pictures are a powerful way to express complex concepts. Adding text to describe the abstract ideas in the given illustration provides the added clarity needed to ensure that the reader can comprehend content fully and quickly. Using text and pictures to communicate complex technical ideas goes hand in hand.
A good rule of thumb to follow is that an illustration should represent each concept in a piece of technical documentation. Then, once the image is in place, write "around the illustration" to provide the descriptive details necessary to express the idea or action at hand adequately.
Creating informative, engaging technical documentation is an essential part of software development and enterprise architecture. Using both text and illustrations will go a long way to creating technical documentation that users need and will actually read.
What's in the experimental viewing videos?
The first video used in the view experiment above is the front page of the New York Times reporting the assassination of Abraham Lincoln. The second video is the front page of the New York Times reporting the sinking of the Titanic.
About the author
Bob Reselman is a nationally known software developer, system architect, industry analyst, and technical writer/journalist. Over a career that spans 30 years, Bob has worked for companies such as Gateway, Cap Gemini, The Los Angeles Weekly, Edmunds.com and the Academy of Recording Arts and Sciences, to name a few. He has held roles with significant responsibility, including but not limited to, Platform Architect (Consumer) at Gateway, Principal Consultant with Cap Gemini and CTO at the international trade finance company, ItFex.
More like this
Red Hat Learning Subscription Course reimagines virtual training
Red Hat Learning Subscription Course: Skills for the future
Container Roundup | Compiler
Untangling Networks | Compiler
Browse by channel

Automation
The latest on IT automation for tech, teams, and environments

Artificial intelligence
Updates on the platforms that free customers to run AI workloads anywhere

Open hybrid cloud
Explore how we build a more flexible future with hybrid cloud

Security
The latest on how we reduce risks across environments and technologies

Edge computing
Updates on the platforms that simplify operations at the edge

Infrastructure
The latest on the world’s leading enterprise Linux platform

Applications
Inside our solutions to the toughest application challenges
Virtualization
The future of enterprise virtualization for your workloads on-premise or across clouds