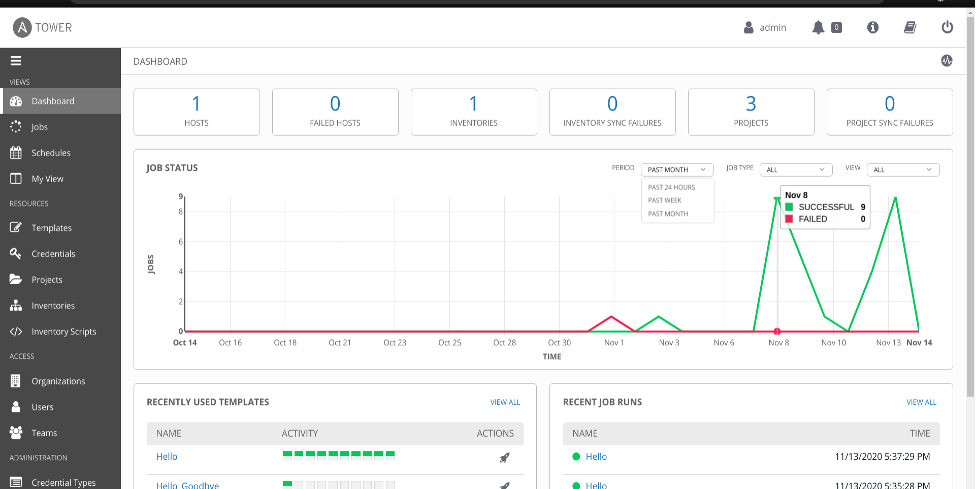
Most enterprise IT organizations deploy log aggregation facilities to support new ways of working through operational intelligence and various forms of automation. The Ansible Tower dashboard itself gives us a good view of the state of our inventory, hosts, scheduled tasks, and manual job runs. To supplement this, logging was introduced as a standalone feature to allow Tower to send detailed logs to several third party external log aggregation services that most IT organizations already have.
As discussed here, this feature enables admins to gain insights and a better view of Tower utilization and trends. This information is then used to analyze infrastructure events and anomalies, and how they are related to one another, achieving operational intelligence. The feature currently works with Splunk, Loggly, Sumologic, and Elastic Stack (formerly ELK stack).

Splunk HTTP Event Collector (HEC)
In this article, I’ll walk you through the process to forward Ansible Tower logs to an existing Splunk deployment using its HTTP Event Collector (HEC). HEC allows applications and services to send data and events to your Splunk facility using HTTP and HTTPS protocols without the need for a forwarder. It utilizes HEC tokens as a means of authentication.
The next set of instructions shows you how to configure log aggregation from Ansible Tower 3.7.1 to Splunk Enterprise 8.1.0 using HEC (the process should be similar on lower versions). These procedures were tested on my local RHEL 8.2 machine for one of our Red Hat TAM customers in New Zealand.
Part 1 - Enabling HEC for first-time use
If this is the first time you’ve used HEC on your Splunk deployment, you need to enable it before it can receive the Tower events over HTTP.
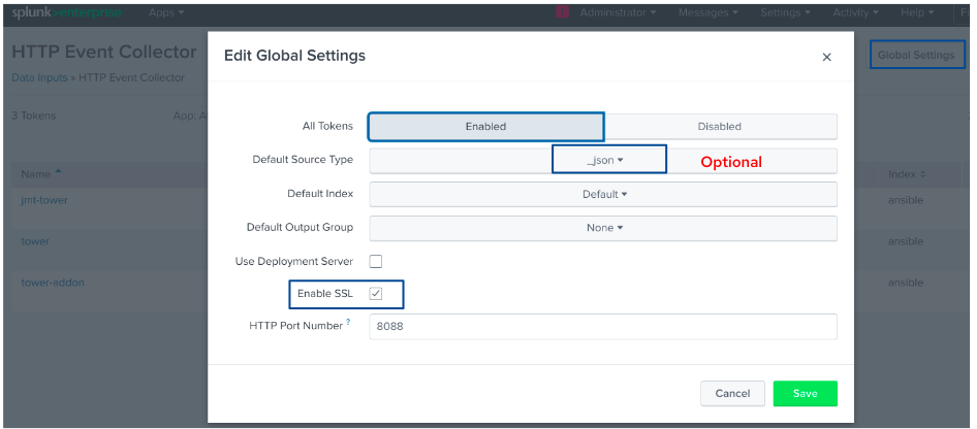
1. Click on Settings → Data Inputs → HTTP Event Collector.
2. Click on Global Settings in the upper right corner.

3. Select Enabled in the All Tokens toggle options.
4. Optionally choose Default Source Type for all HEC tokens, Default Index, and Default Output Group.
5. You can opt to Use Deployment Server to distribute tokens across indexers for both clustered and non-clustered deployments.
6. Tick on the Enable SSL if you prefer HEC to use HTTPS over HTTP.
7. Make sure the HTTP Port Number you specify is not currently used and is not blocked by the firewall. This defaults to port 8088.
8. Click Save.
[ You might also like: Setting up logrotate in Linux ]
Part 2 - Generating an HEC Token
Once HEC is enabled, we can generate an HEC token to be used for Ansible Tower authentication. We can create the token in a specific configuration to choose the source type, create or use a particular index, and even forward to a given output group. This all depends on your approach to using the events and data gathered.
1. Click Settings → Add Data.
2. Select Monitor at the bottom of the page.
3. Click HTTP Event Collector.
4. Key in your preferred token name in the Name field.
5. You can choose to have a Source name override and Description for the token.
6. Optionally, specify an Output Group if you’re using them as described here.
7. Click Next.
8. For Ansible Tower tokens, click Select and type in _json in the Select Source Type field.
9. Keep the default value in App Context: Search and Reporting.
10. For the Index, you can create a new one and select it for a quicker search. I made an ansible index as an example (read more about Splunk indexing here).

11. Review all the details and click Submit or Back to edit.
12. Copy the resulting token to be used in configuring Ansible Tower authentication to Splunk.

13. Click on Start Searching to quickly redirect to the search button and have the search string ready for the token we’ve just created.

Part 3 - Configuring Ansible Tower for Splunk Log Forwarding
Now that we have configured Splunk’s HEC and created a token, Splunk is ready to accept events and data. Let’s move to the configuration on the Ansible Tower side.
1. Log in to the Tower console as an admin user.
2. Navigate to the bottom left of the home screen and choose Settings.
3. Click on System → Logging.
4. Tick on Enable External Logging.
5. Take note of the following example input information from Splunk based on the procedures from Part 1-2.

LOGGING AGGREGATOR: https://<splunk.host>:8088/services/collector/event
→ specify the port number if you did not use 8088
LOGGING AGGREGATOR TYPE: splunk
LOGGING AGGREGATOR TOKEN: token value from Part 2.12
LOGGING AGGREGATOR PROTOCOL: HTTPS/HTTP
6. Feel free to adjust the other options and settings from the screenshot above. For example, if you choose to enable HTTPS Certificate Verification, the certificate sent by an external log aggregator is verified before establishing a connection. We’ll keep it disabled in this example.
7. Click Save and Test to send sample events to Splunk.

Part 4 - Verifying events sent to Splunk
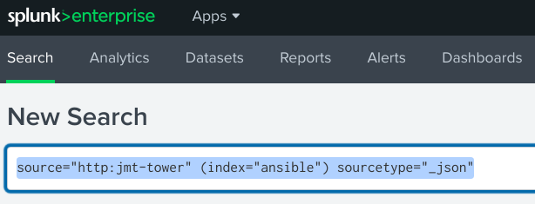
If you click Test after saving the Ansible Tower configuration, wait for a few minutes, and then key in the sample search in Splunk’s Search and Reporting field. You should see the AWX Connection Test Message in Splunk.


From here on, you can start creating reports and dashboards based on the events and data that you want to monitor. Below is a sample event log from a Tower Workflow job. Notice the source and sourcetype as the ones we defined in the HEC token. Splunk admins and developers can now start analyzing the fields received by Splunk and put some intelligence in interpreting this information for their operations.

Splunk app for Ansible monitoring and diagnostics
There is an existing Splunk app for Ansible monitoring. The app is designed to work alongside the Ansible Splunk Callback developed by Deloitte, which has been submitted for inclusion in the main Ansible distribution. Both of these are open source. They are another example of the Power of Open, which allows innovation to prosper using collaboration with open source technologies.
[ Need more on Ansible? Take a free technical overview course from Red Hat. Ansible Essentials: Simplicity in Automation Technical Overview. ]
Wrap up
The ability to centralize logs is a great benefit to IT organizations. The addition of log forwarding to Ansible Tower makes it an even better enterprise solution. Many organizations already have solutions such as Splunk, and now you know how to integrate the tools.
References:
About the author
Joseph is a Technical Account Manager at Red Hat based in Wellington, New Zealand. He currently supports and works with local government agencies and financial services institutions. He is a Unix systems admin at heart who participated in service improvement initiatives and automating mundane day-to-day tasks using Ansible. He worked on automation project deliveries with a number of clients and has been actively co-organizing Ansible and OpenShift Meetups in New Zealand. He loves to travel, participate in extreme adventures, and enjoys good food along the way.
More like this
Tackle critical vulnerabilities with the new Red Hat Lightspeed remediation workflow
Take your automation to the next level with Ansible Content Collections for Windows, Splunk, AIOps, MCP, and more
Technically Speaking | Taming AI agents with observability
You Can’t Automate Cultural Change | Code Comments
Browse by channel
Automation
The latest on IT automation for tech, teams, and environments
Artificial intelligence
Updates on the platforms that free customers to run AI workloads anywhere
Open hybrid cloud
Explore how we build a more flexible future with hybrid cloud
Security
The latest on how we reduce risks across environments and technologies
Edge computing
Updates on the platforms that simplify operations at the edge
Infrastructure
The latest on the world’s leading enterprise Linux platform
Applications
Inside our solutions to the toughest application challenges
Virtualization
The future of enterprise virtualization for your workloads on-premise or across clouds
