

The energy efficiency of data centers and high-performance systems is becoming increasingly important. Energy costs can make up a substantial portion of the operating expenditure (OPEX) budget, potentially serving as a critical factor in the success or failure of a business. This article breaks down the issue of energy efficiency in modern server platforms, presenting tools and an example methodology for measuring power consumption and performance. As a case study, we present measurement results from two server platforms with different CPU architectures. We will emphasize network performance (including throughput measurements), CPU utilization, and power consumption, with a particular emphasis on achieving the highest possible throughput per watt of energy consumed.
Testing methodology
Evaluating the relationship between a computer’s performance and its power requirements can be broken down into three key steps:
- Assess the computer’s performance
- Measure the computer’s power requirements
- Normalize performance relative to power consumption
We measure system performance in terms of gigabits per second of achievable throughput per physical CPU core. It is important to note that with modern, high-speed (100 Gbps and above) Ethernet adapters, it's virtually impossible for a single user-space process to utilize all available bandwidth. Moreover, network throughput is only part of the performance story. Handling network traffic ideally consumes minimal resources, leaving the majority of the system available for creating or processing the data transmitted over the network. Ideally, the CPU is saturated with as few cores as possible.
To quantify these requirements, we monitor the following metrics:
- Maximum achievable throughput in gigabits per second.
- Total CPU utilization, measured in cores. For simplicity, two half-loaded cores are counted as one fully loaded core.
- Computational efficiency, calculated as the ratio of throughput in gigabits per second (Gbps) to CPU utilization. For example, a system handling 60 Gbps of throughput using two CPU cores has a computational efficiency of 30 Gbps per core.
Measuring network throughput
To measure network throughput, we use the open source iperf3 benchmarking tool, widely regarded as an industry standard. The exact command used for benchmarking:
iperf3 --json --client 172.16.0.42 --time 30 --port 5201 --parallel 8
The --parallel 8 option specifies that traffic is sent using 8 simultaneous TCP sockets, but only a single user-space process. This approach helps mitigate artifacts from the Receive Side Scaling (RSS) hashing function and ensures reproducible results. An alternative method involves pinning remote and local TCP ports and configuring RSS to distribute flows evenly among CPUs using the ethtool ntuple feature. We chose the parallel-socket approach because not every network interface controller (NIC) used in our tests initially supported an ntuple RSS configuration. One potential drawback of this method is suboptimal cache behavior when data is processed across multiple CPU cores. However, because the same configuration is used for all tests, the results remain comparable.
Measuring CPU utilization
To measure CPU utilization, we use the mpstat command:
mpstat -P ALL 30
We launch the mpstat process programmatically, just before starting the iperf3 benchmark. The number 30 in this example indicates that CPU usage will be monitored for 30 seconds, matching the duration of the iperf3 run.
Even if throughput remains the same on the local and remote ends, CPU utilization differs. Receiving data is typically more CPU-intensive than sending, because the sender offloads data fragmentation to the NIC using TCP segmentation offload (TSO), whereas the receiver must reassemble the data in software. For this reason, CPU utilization should be monitored on both sending and receiving sides. In most cases, we report remote CPU utilization, because it's the more significant factor in determining achievable throughput.
Computational efficiency
To evaluate computational efficiency, we divide throughput by total system load, adjusted by a factor of 100. Division by 100 is necessary because mpstat reports CPU utilization as a percentage, and we want to represent it in terms of fully loaded cores:
This equation provides a hypothetical performance of a single fully loaded core.
Network-intensive process operating regimes
The system under test can behave differently under varying operating conditions. We test the system in the following operating models:
Single process
Only one user-space process is running. Typically, two CPU cores are used: One for the iperf3 process and another for handling interrupts. Here, CPU clock frequency and instructions per cycle determine the achieved throughput, which should ideally be as high as possible.
Multi-process
Multiple user-space processes are running, but they still do not fully saturate the available bandwidth. CPU multi-core performance becomes the denominator for achieved throughput. Ideally, throughput should scale linearly. Doubling the number of cores should roughly double the throughput.
Saturated
In this model, enough user-space processes are running to saturate the link, meaning throughput reaches the line rate, or maximum potential throughput, of the NIC. Adding more processes does not increase throughput or overall system load. Instead, additional processes should be scheduled onto the same set of CPU cores.
To measure multi-core and saturated performance, we run several parallel iperf3 instances simultaneously. The orchestration of iperf3 and mpstat processes is handled by Nepta, a benchmarking tool developed at Red Hat.
Processing a single network stream involves two main tasks handled by the operating system:
- Running a network-intensive user-space process that generates or receives network traffic
- Handling the large number of interrupts generated by the network card
Optimizing workloads for hardware locality
At this stage, it is essential to understand your hardware. Almost all server hardware uses non-uniform memory access (NUMA) architecture, meaning that access times vary depending on which memory regions are being accessed.
Each CPU core has local memory—memory attached to the memory controller physically closest to the core (typically on the same silicon die or socket)—and remote memory, which is attached to memory controllers on different sockets or dies.
Similarly, PCI devices connected to the controller on the same silicon are considered local PCI devices, while all others are considered remote PCI devices.
A combination of CPU cores, PCI devices, memory controllers, and adjacent memory modules forms a NUMA node.
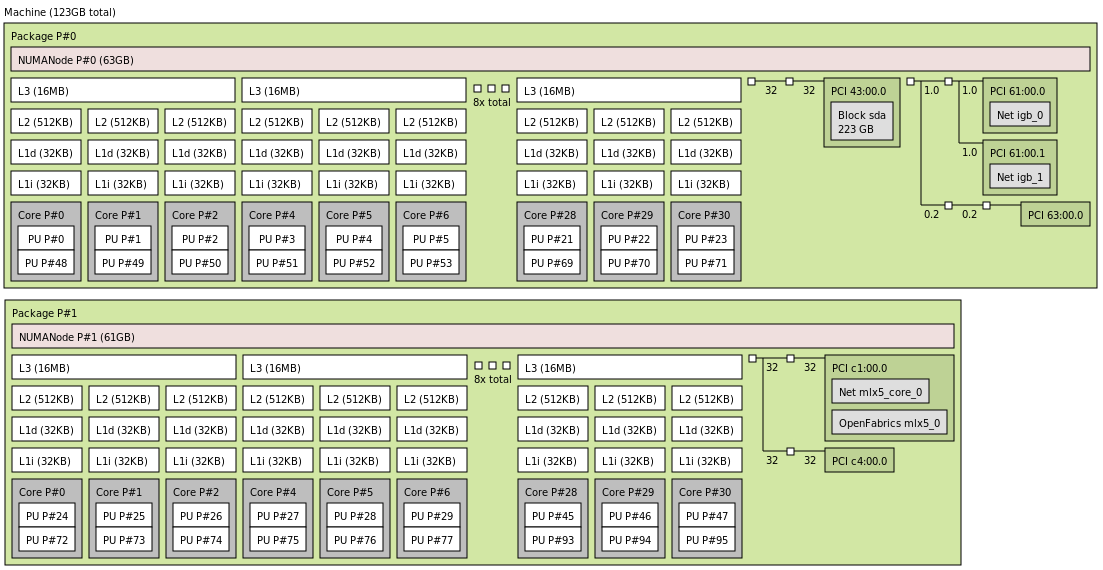
Hardware topology can be visualized using the lstopo utility. You can view its output as text:
lstopo
You can generate an image by defining an output graphic file:
lstopo topology.png
Below is an example of a generated PNG file representing the hardware topology:
NUMA-aware resource allocation for network-intensive processes
From the perspective of network-intensive processes, a network card can be located on either a local NUMA node or a remote NUMA node. Running processes on remote nodes typically incurs a double-digit performance penalty. However, this doesn't mean a remote core should be left idle—using it, even with some performance penalty, is often better than leaving it completely unused.
Currently, the Linux scheduler considers memory locality but does not optimize for the I/O requirements of processes. Optimizing this aspect is entirely the responsibility of the user.
Based on empirical experience, the following strategies are recommended for resource allocation:
1. Fewer network-intensive processes than CPU cores on the NUMA node with the network card:
- Dedicate some CPU cores on the local NUMA node to the network-intensive processes.
- Dedicate other CPU cores on the same node to handling interrupts.
2. More network-intensive processes than CPU cores on the NUMA node, but not exceeding twice the total CPU cores in the system:
- Dedicate all CPU cores on the local NUMA node to serving interrupts.
- Dedicate all remaining CPU cores in the system to network-intensive processes.
3. Thousands of network-intensive processes or processes requiring resources across multiple NUMA nodes:
- Use the default Red Hat Enterprise Linux (RHEL) configuration. RHEL is optimized for this scenario by default.
Pinning interrupts and processes
Interrupts generated by a specific network driver can be pinned to a subset of CPUs using the tuna utility:
sudo tuna --spread=0-12 --irqs=$(grep ice /proc/interrupts | \
awk '{print $1}' | sed 's/://')
This command spreads all network interrupts generated by the ice driver across CPUs 0–12.
Network-related processes can be pinned to specific CPU cores using taskset. For a newly started process:
taskset -c 1 ./process
For a process already running, obtain the PID of the process with pgrep or pidof or ps and pass that to tasksel:
taskset -cp 1 <PID>
When running multiple network-related processes, each should be pinned to its own dedicated CPU. Many network daemons also provide configuration options to pin child processes to specific CPUs, which can further optimize performance.
Hardware environment in the test
The goal of this document is not to compare performance or power consumption across different computational platforms. Red Hat’s objective is not to benchmark systems against each other, but to provide optimal performance on all available hardware.
For this case study, we use three different server systems with varying CPU architectures, core counts, and system memory sizes. These systems serve solely to illustrate the analysis of computational and power efficiency. For benchmarking, we focus on a simple scenario where the number of network-intensive processes is smaller than the number of CPU cores on the closest NUMA node.
System 1: Entry-level ARM server
- CPU: 32 cores @ 1.7 GHz
- Benchmark configuration: Up to 16
iperf3instances, with 16 cores dedicated to handling interrupts and 16 cores dedicated to running iperf processes
System 2: High-performance ARM server
- CPU: 80 cores @ 2.2 GHz
- Benchmark configuration: Up to 40
iperf3instances, with 40 cores dedicated to handling interrupts and 40 cores dedicated to running iperf processes
System 3: Traditional x64 server
- CPU: 32 cores @ 3.2 GHz
- Benchmark configuration: Up to 40
iperf3instances, with 40 cores dedicated to handling interrupts and 40 cores dedicated to running iperf processes
The CPU pinning configuration for each system is summarized in the following table:
Count of processes | System 1 ARM 32 cores | System 2 ARM 80 cores | System 3 x64 cores | |||
Process cores | Interrupt cores | Process cores | Interrupt cores | Process cores | Interrupt cores | |
1 | 0 | 1 | 0 | 1 | 0 | 1 |
2 | 0,1 | 2,3 | 0,1 | 2,3 | 0,1 | 2,3 |
4 | 0-3 | 4-7 | 0-3 | 4-7 | 0-3 | 4-7 |
8 | 0-7 | 7-15 | 0-7 | 7-15 | 0-7 | 7-15 |
16 | 0-15 | 16-31 | 0-15 | 16-31 | 0-15 | 16-31 |
32 | Not run | Not run | 0-31 | 32-63 | Not run | Not run |
40 | Not run | Not run | 0-39 | 40-79 | Not run | Not run |
Evaluating computer system power consumption
There are three common approaches to measuring the power consumption of a computer system:
External power meter
Using a calibrated external power meter (wattmeter) is the most reliable method for measuring total system power. However, it provides limited insight into the power consumption of individual components such as the CPU, SSDs, or memory. Some advanced power meters include serial interfaces for automated reading, but automation via serial line is often cumbersome and complicated.
System utility
Certain CPU vendors provide command-line utilities for in-depth power analysis. These tools offer detailed insights into CPU behavior, including power consumption of caches, memory controllers, and PCI controllers. However, they only measure CPU power and cannot monitor the rest of the system, such as power supplies or storage devices.
Platform management
Some platform vendors integrate power measurement into platform management interfaces. This approach combines the advantages of external meters and CPU utilities: it is reliable, can be automated, and provides component-level insights. Unfortunately, such capabilities are not universally available across all systems.
Fortunately, all of our test systems are equipped with chassis-level power monitoring, accessible with ipmitool:
sudo tuna --spread=0-12 --irqs=$(grep ice /proc/interrupts | \
awk '{print $1}' | sed 's/://')
This command returns readings from all hardware sensors, including fan speeds, voltages, and (most importantly) power consumption values. On our systems, the following power metrics are available:
- PSU1 Power In: AC input power of power supply 1
- PSU1 Power Out: DC output power of power supply 1
- PSU2 Power In: AC input power of power supply 2
- PSU2 Power Out: DC output power of power supply 2
- CPU_Power: DC power consumed by the CPU, measured at the motherboard voltage regulator
- Memory_Power (x64 system only): DRAM power measured at the motherboard voltage regulator
We verified these readings against an AC wattmeter (AC side) and a DC clamp meter (DC side). All readings from ipmitool were within 5% of the external measurements, giving us confidence in their accuracy.
It is important to note that ipmitool reports momentary readings. During initial tests, we observed that power stabilizes after the first second of a benchmark and remains steady until completion. Therefore, for simplicity, we take a single reading 15 seconds into each benchmark run.
Normalizing performance against power consumption
To consolidate our experiment into a single metric, we divide the maximum achieved throughput by power consumption. Metrics are calculated both at the DC side of the PSU and for the CPU itself.
The final performance metrics for our tests are:
- CPU Energetic Efficiency: Mbit/s per watt (throughput per watt consumed by the CPU)
- System Energetic Efficiency: Mbit/s per watt (throughput per watt consumed by the entire system, excluding PSU losses)
A note about power supplies
A detailed discussion of switching-mode power supply efficiency is beyond the scope of this document. However, it is important to highlight some key points.
Modern server power supplies generally achieve high efficiency across a broad range of loads, typically from 20% to 90% of rated capacity. Outside this range, efficiency can drop quickly. Most modern PSUs certified with the 80 Plus Platinum standard must achieve efficiency above 90% at loads greater than 20% of their rated capacity. While impressive, this can be less relevant when working with low-power, efficient CPUs.
Our systems are equipped with two redundant 800W power supplies, giving a combined capacity of 1600W. To reach their rated efficiency, these PSUs require a minimum load of 320W (20% of combined capacity). Modern server CPUs often have a TDP of 100W or less. In our tests, none of the systems reached the 320W threshold, even under full load.
Mitigation strategies
To improve efficiency under low-power conditions, we implemented the following:
Use lower-rated power supplies
We replaced the original 800W PSUs with 400W units, reducing the minimum load required for reasonable efficiency.
Enable hot standby mode
We configured platform management so that all load is drawn from the first PSU, while the second PSU remains in hot standby for redundancy. For example, a 32-core ARM system drawing 72W from a single 400W PSU operated at 18% of rated capacity, slightly below the 20% threshold, yet still achieved 82% efficiency.
Measure DC output directly
To avoid the non-linearity of PSU efficiency, all power-efficiency metrics in this paper are based on DC output measurements rather than AC input.
Benefits of considering PSU efficiency
By evaluating system power input and tailoring PSUs accordingly, it is possible to:
- Reduce CAPEX by avoiding over-provisioned, expensive power supplies.
- Reduce OPEX by improving overall efficiency, lowering the system’s power consumption and operational costs.
Conclusion
In this study, we evaluated the relationship between computer system performance and power consumption, focusing on network-intensive workloads. Our methodology in summary:
- Evaluating system performance
- Performance was measured as achievable network throughput per CPU core.
- We considered CPU utilization, maximum throughput, and computational efficiency (throughput per fully loaded core).
- Different operating regimes—single process, multi-process, and saturated—were tested to capture realistic performance behavior.
- Optimizing workloads for hardware locality
- We emphasized NUMA awareness, aligning network-intensive processes and interrupt handling with local memory and PCI devices.
- CPU pinning and interrupt distribution were leveraged to reduce performance penalties from remote memory access.
- Measuring power consumption
- Power was monitored using platform management interfaces via ipmitool, validated with external AC/DC meters.
- Both CPU power and system-wide power were recorded, and DC-side measurements were used to account for PSU efficiency.
- Normalizing performance against power
- The final metric combines throughput and power consumption, yielding CPU and system-level energetic efficiency (Mbit/s/W).
- Considerations were made for PSU efficiency, with strategies to optimize low-load operation and reduce waste.
- The goal of this article is to provide our customers with a practical methodology for measuring network performance and optimizing power usage, helping them make informed decisions when designing, tuning, or scaling network-intensive systems.
Overall, this approach highlights the importance of hardware-aware scheduling, accurate power measurement, and energy-efficient system design, offering actionable insights for modern data center environments.
Product trial
Red Hat Ansible Automation Platform | Product Trial
About the authors
I joined Red Hat as an intern in 2010. After my graduation at Brno University of Technology, I started in Red Hat full time in 2012. I focus on kernel network performance testing, and network card drivers and testing. I am also maintaining an onsite hardware lab environment for testing network setups.
I started at Red Hat in 2014 as an intern, learning much about Linux and open source technology. My main focus is improving the Linux kernel's performance, especially for network performance testing with IPsec and Macsec.
I also have experience in test automation, creating tools and services, and working with CI/CD systems like GitLab, Jenkins and OpenShift. I am skilled in maintaining Linux-based systems and configuring services to ensure they run smoothly.
More like this
The evolution of infrastructure automation in the age of AI: 4 key takeaways from Red Hat Summit 2026
From alert fatigue to automated action: Automated patching in the AI era
Untangling Networks | Compiler
Operating System Management | Compiler
Browse by channel

Automation
The latest on IT automation for tech, teams, and environments

Artificial intelligence
Updates on the platforms that free customers to run AI workloads anywhere

Open hybrid cloud
Explore how we build a more flexible future with hybrid cloud

Security
The latest on how we reduce risks across environments and technologies

Edge computing
Updates on the platforms that simplify operations at the edge

Infrastructure
The latest on the world’s leading enterprise Linux platform

Applications
Inside our solutions to the toughest application challenges
Virtualization
The future of enterprise virtualization for your workloads on-premise or across clouds