OpenShift Container Platform 4 comes with a Prometheus monitoring stack preconfigured. This stack is in charge of getting cluster metrics to ensure everything is working seamlessly, so cool, isn't it?
But what happens if we have more than one OpenShift cluster and we want to consume those metrics from a single tool, let me introduce you to Thanos.
In the words of its creators, Thanos is a set of components that can be composed into a highly available metrics system with unlimited storage capacity, which can be added seamlessly on top of existing Prometheus deployments.
NOTE: Prometheus instances and Thanos components deployed by prometheus-operator don't have Red Hat commercial support yet, they are supported by the community.
NOTE: Prometheus
remote_writeis an experimental feature.
Architecture
In this blog post we are going to go through the deployment and configuration of multiple Prometheus instances, for such task we are going to use the Prometheus Operator available in the in-cluster Operator Marketplace.
We will have two OpenShift 4 clusters, each cluster comes with a pre-configured Prometheus instance managed by the OpenShift Cluster Monitoring Operator, those Prometheus instances are already scraping out our clusters.
Since we cannot modify the configuration for the existing Prometheus instances managed by the Cluster Monitoring Operator yet (We will be able to modify some properties in OCP 4.2), we will deploy new instances using the Prometheus Operator. Also, we don't want to configure the new Prometheus instances to scrape out the exact same cluster data, instead we will configure the new instances to get the cluster metrics from the managed Prometheus instances using Prometheus Federation.
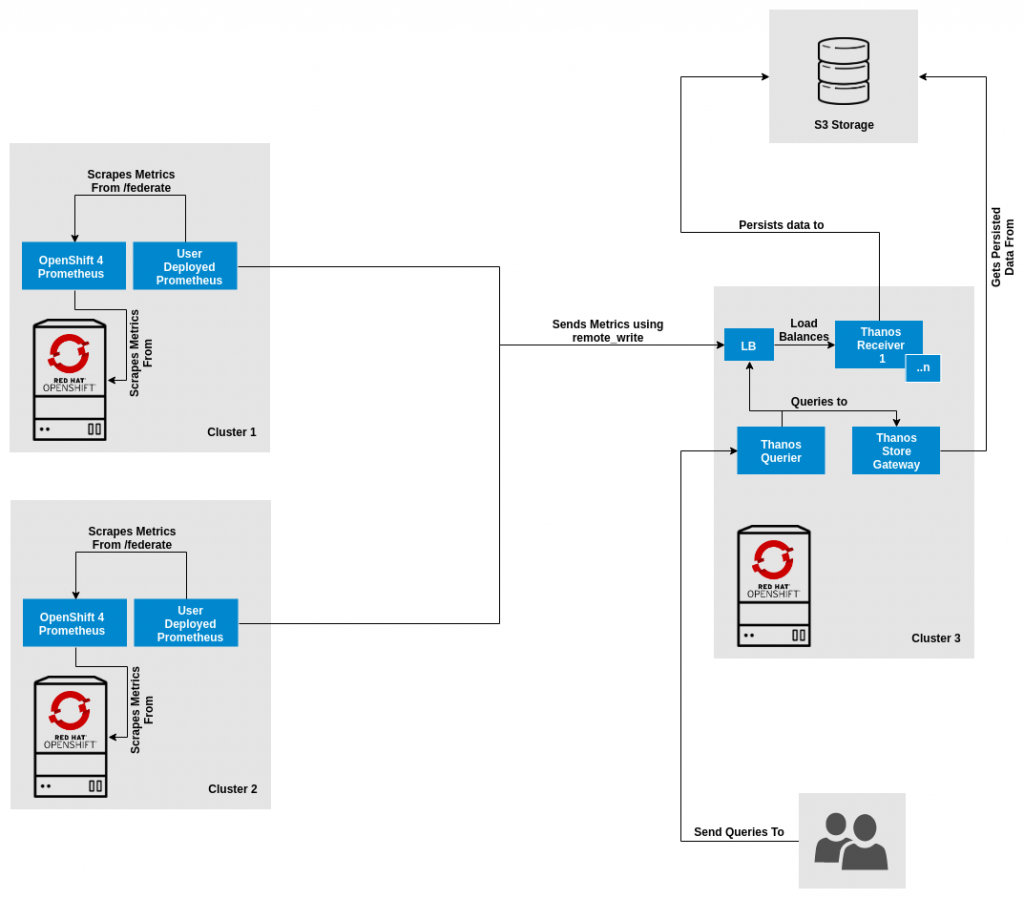
Prometheuswill be configured to send all metrics to theThanos Receiveusing remote_write.Thanos Receivereceives the metrics sent by the different Prometheus instances and persist them into the S3 Storage.Thanos Store Gatewaywill be deployed so we can query persisted data on the S3 Storage.Thanos Querierwill be deployed, the Querier will answer user's queries getting the required information from theThanos Receiverand from the S3 Storage through theThanos Store Gatewayif needed.
Below a diagram depicting the architecture:
NOTE: Steps below assume you have valid credentials to connect to your clusters using
octooling. We will refer to cluster1 aswest2context, cluster2 aseast1context and cluster3 aseast2. Take a look at this video to know how to flatten your config files.
Deploying Thanos Store Gateway
The Store Gateway will be deployed only in one of the clusters, in this scenario we're deploying it in Cluster3 (east2).
We want our metrics to persist indefinitely as well, an S3 Bucket is required for that. We will use AWS S3 for storing the persisted Prometheus data, you can find the required steps to create an AWS S3 Bucket here.
We need a secret that stores the S3 configuration (and credentials) for the Store Gateway to connect to AWS S3.
Download the file store-s3-secret.yaml and modify the credentials accordingly.
oc --context east2 create namespace thanos

oc --context east2 -n thanos create secret generic store-s3-credentials --from-file=store-s3-secret.yaml
At the moment of this writing the Thanos Store Gateway requires of anyuid for work on OCP 4, we are going to create a service account with such privileges:
oc --context east2 -n thanos create serviceaccount thanos-store-gateway

oc --context east2 -n thanos adm policy add-scc-to-user anyuid -z thanos-store-gateway
Download the file store-gateway.yaml containing the required definitions for deploying the Store Gateway.
oc --context east2 -n thanos create -f store-gateway.yaml
After a few seconds we should see the Store Gateway pod up and running:
oc --context east2 -n thanos get pods -l "app=thanos-store-gateway"

NAME                     READY   STATUS    RESTARTS   AGE

thanos-store-gateway-0   1/1     Running   0          2m18s
Deploying Thanos Receive
Thanos Receive will be deployed only in one of the clusters, in this scenario we're deploying it in Cluster3 (east2).
Thanos Receive requires a secret that stores the S3 configuration (and credentials) in order to persist data into S3, we are going to re-utilize the credentials created for the Store Gateway.
Our Thanos Receive instance will require clients to provide a Bearer Token in order to authenticate and be able to send metrics, we are going to deploy an OAuth Proxy in front of the Thanos Receive for providing such service.
We need to generate a session secret as well as annotate the ServiceAccount that will run the pods indicating which OpenShift Route will redirect to the oauth proxy.
oc --context east2 -n thanos create serviceaccount thanos-receive

oc --context east2 -n thanos create secret generic thanos-receive-proxy --from-literal=session_secret=$(head /dev/urandom | tr -dc A-Za-z0-9 | head -c43)

oc --context east2 -n thanos annotate serviceaccount thanos-receive serviceaccounts.openshift.io/oauth-redirectreference.thanos-receive='{"kind":"OAuthRedirectReference","apiVersion":"v1","reference":{"kind":"Route","name":"thanos-receive"}}'
On top of that using delegating authentication and authorization requires a cluster role system:auth-delegator to be assigned to the service account the oauth_proxy is running under, so we are going to add this role to the service account we just created:
oc --context east2 -n thanos adm policy add-cluster-role-to-user system:auth-delegator -z thanos-receive
Download the file thanos-receive.yaml containing the required definitions for deploying the Thanos Receive.
oc --context east2 -n thanos create -f thanos-receive.yaml
After a few seconds we should see the Thanos Receive pod up and running:
oc --context east2 -n thanos get pods -l "app=thanos-receive"

NAME               READY   STATUS    RESTARTS   AGE

thanos-receive-0   2/2     Running   0          112s
Now we can publish our Thanos receive instance using an OpenShift Route:
oc --context east2 -n thanos create route reencrypt thanos-receive --service=thanos-receive --port=web-proxy --insecure-policy=Redirect
Create ServiceAccounts for sending metrics
Since our Thanos Receive instance requires clients to provide a Bearer Token in order to authenticate and be able to send metrics, we need to create two ServiceAccounts (one per cluster) and give them the proper rights so they can authenticate against the oauth-proxy.
In our case we have configured the oauth-proxy to authenticate any account that have access to the thanos namespace in the cluster where it's running (east2):
-openshift-delegate-urls={"/":{"resource":"namespaces","resourceName":"thanos","namespace":"thanos","verb":"get"}}
So it will be enough creating the ServiceAccounts in the namespace and granting view Role to them:
oc --context east2 -n thanos create serviceaccount west2-metrics

oc --context east2 -n thanos adm policy add-role-to-user view -z west2-metrics

oc --context east2 -n thanos create serviceaccount east1-metrics

oc --context east2 -n thanos adm policy add-role-to-user view -z east1-metrics
Deploying Prometheus instances using the Prometheus Operator
First things first, we need to deploy a new Prometheus instance into each cluster, we are going to use the Prometheus operator for such task, so let's start by deploying the operator.
We will deploy the operator on west2 and east1 clusters.
Deploying the Prometheus Operator into a new Namespace
A new namespace where the Operator and the Prometheus instances will be deployed needs to be created.
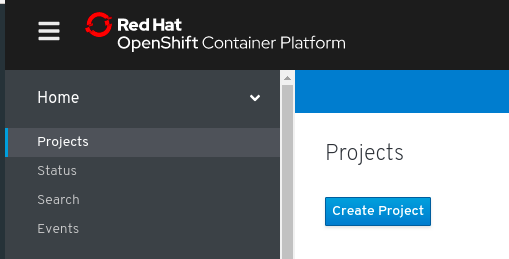
- Once logged in the OpenShift Console, on the left menu go to
Home -> Projectsand click onCreate Project: -
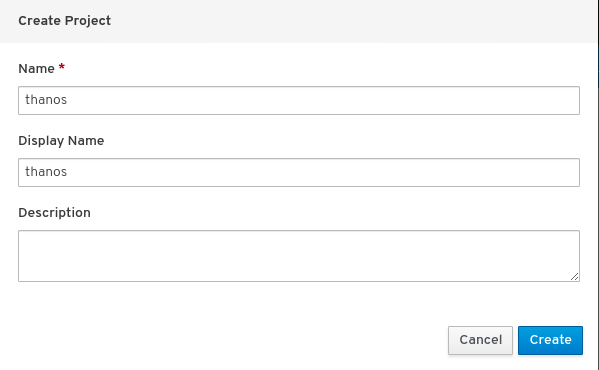
Fill in the required information, we've used
thanosas our namespace name: -
Now we are ready to deploy the Prometheus Operator, we're going to use the in-cluster Operator Marketplace for that matter.
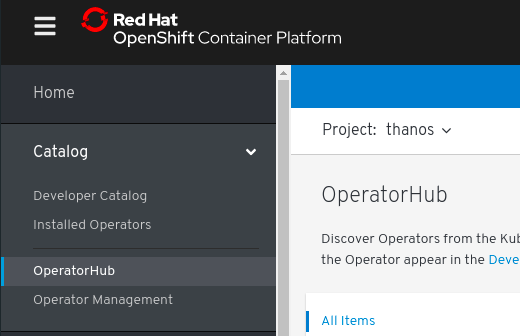
- On the left menu go to
Catalog -> OperatorHub: -
From the list of Operators, choose
Prometheus Operator: -
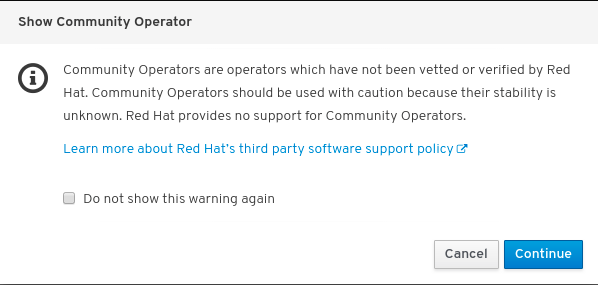
Accept the
Community Operatorsupportability warning (if prompted): -
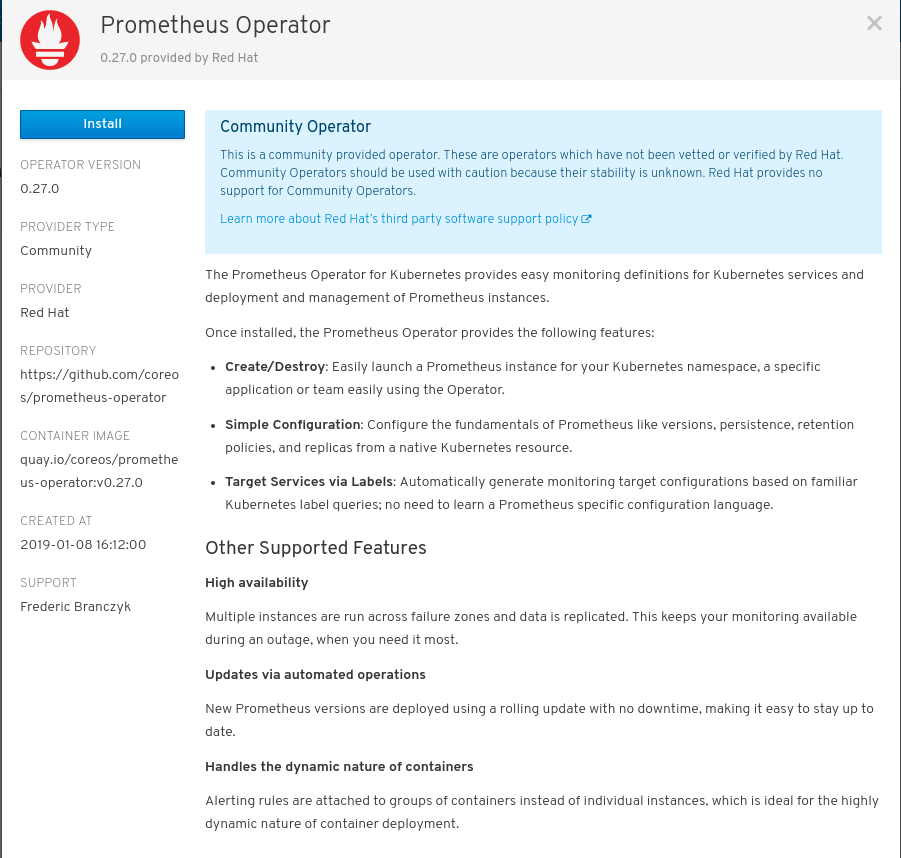
Install the Operator clicking on
Install: -
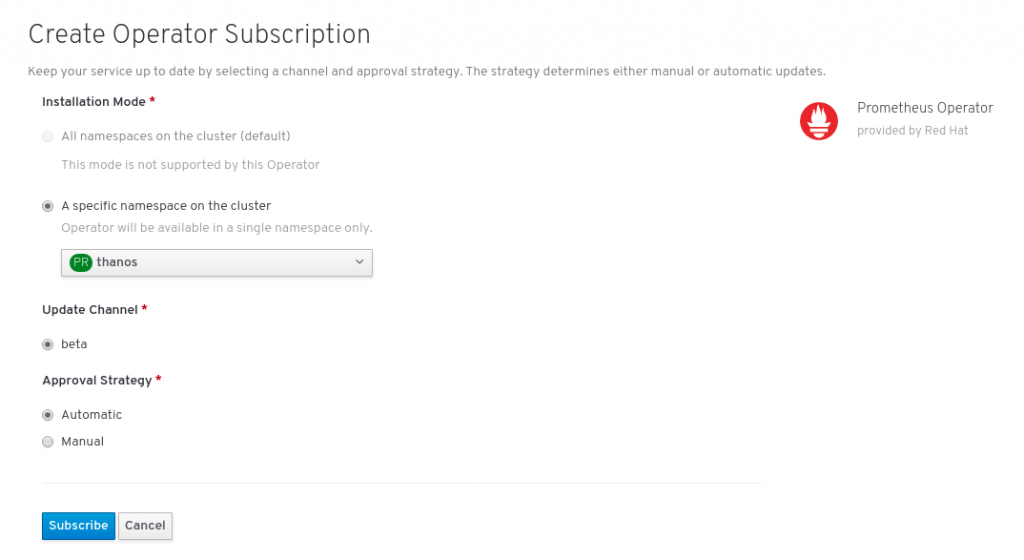
Create the subscription to the operator:
-
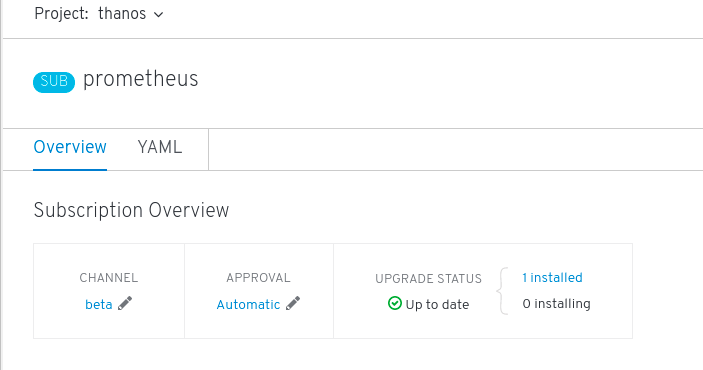
After a few seconds you should see the the operator installed.
- On the left menu go to
NOTE: Above steps have to be performed in both clusters
Deploying Prometheus Instance
At this point we should have the Prometheus Operator already running on our namespace, which means we can start the deployment of our Prometheus instances leveraging it.
Configuring Serving CA to Connect to Cluster Managed Prometheus
Our Prometheus instance needs to connect to the Cluster Managed Prometheus instance in order to gather the cluster-related metrics, this connection uses TLS, so we will use the Serving CA to validate the Targets endpoints (Cluster Managed Prometheus).
The Serving CA is located in the openshift-monitoring namespace, we will create a copy into our namespace so we can use it in our Prometheus instances:
oc --context west2 -n openshift-monitoring get configmap serving-certs-ca-bundle --export -o yaml | oc --context west2 -n thanos apply -f -

oc --context east1 -n openshift-monitoring get configmap serving-certs-ca-bundle --export -o yaml | oc --context east1 -n thanos apply -f -
Configuring Required Cluster Role for Prometheus
We are going to use Service Monitors to discover Cluster Managed Prometheus instances and connect to them, in order to do so we need to grant specific privileges to the ServiceAccount that runs our Prometheus instances.
As you may know, the Cluster Managed Prometheus instances include the oauth proxy to perform authentication and authorization, in order to be able to authenticate we need a ServiceAccount that can GET all namespaces in the cluster. The token for this ServiceAccount will be used as Bearer Token to authenticate our connections to the Cluster Managed Prometheus instances.
Download cluster-role.yaml file containing the required ClusterRole and ClusterRoleBinding.
Now we are ready to create the ClusterRole and ClusterRoleBinding in both clusters:
oc --context west2 -n thanos create -f cluster-role.yaml

oc --context east1 -n thanos create -f cluster-role.yaml
Configuring Authentication for Thanos Receive
We need to create a secret containing the bearer token for the ServiceAccount we created before and that will grant access to the Thanos Receive, this secret will be mounted in the
Prometheus pod so it can be used to authenticate against the Thanos Receive:
oc --context west2 -n thanos create secret generic metrics-bearer-token --from-literal=metrics_bearer_token=$(oc --context east2 -n thanos serviceaccounts get-token west2-metrics)

oc --context east1 -n thanos create secret generic metrics-bearer-token --from-literal=metrics_bearer_token=$(oc --context east2 -n thanos serviceaccounts get-token east1-metrics)
Deploying Prometheus Instance
In order to deploy the Prometheus instance, we need to create a Prometheus object. On top of that two ServiceMonitors will be created. The ServiceMonitors have the required configuration for scraping the /federate endpoint from the Cluster Managed Prometheus instances. We will use openshift-oauth-proxy to protect our Prometheus instances so unauthenticated users cannot see our metrics.
As we want to protect our Prometheus instances using oauth-proxy we need to generate a session secret as well as annotate the ServiceAccount that will run the pods indicating which OpenShift Route will redirect to the oauth proxy.
oc --context west2 -n thanos create secret generic prometheus-k8s-proxy --from-literal=session_secret=$(head /dev/urandom | tr -dc A-Za-z0-9 | head -c43)

oc --context east1 -n thanos create secret generic prometheus-k8s-proxy --from-literal=session_secret=$(head /dev/urandom | tr -dc A-Za-z0-9 | head -c43)
oc --context west2 -n thanos annotate serviceaccount prometheus-k8s serviceaccounts.openshift.io/oauth-redirectreference.prometheus-k8s='{"kind":"OAuthRedirectReference","apiVersion":"v1","reference":{"kind":"Route","name":"federated-prometheus"}}'
 oc --context east1 -n thanos annotate serviceaccount prometheus-k8s serviceaccounts.openshift.io/oauth-redirectreference.prometheus-k8s='{"kind":"OAuthRedirectReference","apiVersion":"v1","reference":{"kind":"Route","name":"federated-prometheus"}}'
Download the following files:
First, we will create the Prometheus instances and the required ServiceMonitor for scraping the Cluster Managed Prometheus instance on west2, then we will do the same for east1.
We need to modify the prometheus-thanos-receive.yaml in order to configure the remote_write url where Thanos Receive is listening:
THANOS_RECEIVE_HOSTNAME=$(oc --context east2 -n thanos get route thanos-receive -o jsonpath='{.status.ingress[*].host}')

sed -i.orig "s/<THANOS_RECEIVE_HOSTNAME>/${THANOS_RECEIVE_HOSTNAME}/g" prometheus-thanos-receive.yaml
oc --context west2 -n thanos create -f prometheus-thanos-receive.yaml

oc --context west2 -n thanos create -f service-monitor-west2.yaml

oc --context east1 -n thanos create -f prometheus-thanos-receive.yaml

oc --context east1 -n thanos create -f service-monitor-east1.yaml
ServiceMonitor Notes
The Prometheus Operator introduces additional resources in Kubernetes, one of these resources are the ServiceMonitors. A ServiceMonitor describes the set of targets to be monitored by Prometheus. You can learn more about that here
You can see the following properties used in the ServiceMonitors we created above:
honorLabels: true-> We want to keep the labels from the Cluster Managed Prometheus instance- '{__name__=~".+"}'-> We want to get all the metrics found on /federate endpointscheme: https-> The Cluster Managed Prometheus instance is configured to use TLS, so we need to use https port for connecting to itbearerTokenFile: <omitted>-> In order to authenticate through the oauth proxy we need to send a token from a SA that can GET all namespacescaFile: <omitted>-> We will use this CA to validate Prometheus Targets certificatesserverName: <omitted>-> This is the Server Name we expect targets to report backnamespaceSelector+selector-> We will apply use this selectors to get pods running onopenshift-monitoringnamespace that have the labelprometheus: k8s
After a few seconds we should see our Prometheus instances running on both clusters:
oc --context west2 -n thanos get pods -l "prometheus=federated-prometheus"

NAME                                READY   STATUS    RESTARTS   AGE

prometheus-federated-prometheus-0   4/4     Running   1          104s

prometheus-federated-prometheus-1   4/4     Running   1          104s
oc --context east1 -n thanos get pods -l "prometheus=federated-prometheus"
 NAME READY STATUS RESTARTS AGE
 prometheus-federated-prometheus-0 4/4 Running 1 53s
 prometheus-federated-prometheus-1 4/4 Running 1 53s
Now we can publish our prometheus instances using an OpenShift Route:
oc --context west2 -n thanos create route reencrypt federated-prometheus --service=prometheus-k8s --port=web-proxy --insecure-policy=Redirect

oc --context east1 -n thanos create route reencrypt federated-prometheus --service=prometheus-k8s --port=web-proxy --insecure-policy=Redirect
Deploying Custom Application
Our Prometheus instance is getting the cluster metrics from the Cluster Monitoring managed Prometheus, now we are going to deploy a custom application and get metrics from this application as well, so you can see the potential benefits from this solution.
The custom application exports some Prometheus metrics that we want to gather, we're going to define a ServiceMonitor to get the following metrics:
- total_reserverd_words - Number of words reversed by our application
- endpoints_accesed{endpoint} - Number of requests on a given endpoint
Deploying the application to both clusters
Download the file reversewords.yaml
oc --context west2 create namespace reverse-words-app

oc --context west2 -n reverse-words-app create -f reversewords.yaml

oc --context east1 create namespace reverse-words-app

oc --context east1 -n reverse-words-app create -f reversewords.yaml
After a few seconds we should see the Reverse Words pod up and running:
oc --context west2 -n reverse-words-app get pods -l "app=reverse-words"

NAME                            READY   STATUS    RESTARTS   AGE

reverse-words-cb5b44bdb-hvg88   1/1     Running   0          95s
oc --context east1 -n reverse-words-app get pods -l "app=reverse-words"
 NAME READY STATUS RESTARTS AGE
 reverse-words-cb5b44bdb-zxlr6 1/1 Running 0 60s
Let's go ahead and expose our application:
oc --context west2 -n reverse-words-app create route edge reverse-words --service=reverse-words --port=http --insecure-policy=Redirect

oc --context east1 -n reverse-words-app create route edge reverse-words --service=reverse-words --port=http --insecure-policy=Redirect
If we query the metrics for our application, we will get something like this:
curl -ks https://reverse-words-reverse-words-app.apps.west-2.sysdeseng.com/metrics | grep total_reversed_words | grep -v ^#

total_reversed_words 0
Let's send some words and see how the metric increases:
curl -ks https://reverse-words-reverse-words-app.apps.west-2.sysdeseng.com/ -X POST -d '{"word": "PALC"}'

{"reverse_word":"CLAP"}
curl -ks https://reverse-words-reverse-words-app.apps.west-2.sysdeseng.com/metrics | grep total_reversed_words | grep -v ^#
 total_reversed_words 1
In order to get this metrics into Prometheus, we need a ServiceMonitor that scrapes the metrics endpoint from our application.
Download the following files:
And create the ServiceMonitors:
oc --context west2 -n thanos create -f service-monitor-reversewords-west2.yaml

oc --context east1 -n thanos create -f service-monitor-reversewords-east1.yaml
After a few moments we should see a new Target within our Prometheus instance:
Deploying Thanos Querier
At this point we have:
- Thanos Receive listening for metrics and persisting data to AWS S3
- Thanos Store Gateway configured to get persisted data from AWS S3
- Prometheus instances deployed on both clusters gathering cluster and custom app metrics and sending metrics to Thanos Receive
We can now go ahead and deploy the Thanos Querier which will provide an unified WebUi for getting metrics for all our clusters.
The Thanos Querier connects to Thanos Receive and Thanos Store Gateway instances over GRPC, we are going to use standard OpenShift services for providing such connectivity since
all components are running in the same cluster.
As we already did with Prometheus instances, we are going to protect the Thanos Querier WebUI with the openshift-oauth-proxy, so first of all a session secret has to be created:
oc --context east2 -n thanos create secret generic thanos-querier-proxy --from-literal=session_secret=$(head /dev/urandom | tr -dc A-Za-z0-9 | head -c43)
Download the thanos-querier-thanos-receive.yaml.
NOTE: Port http/9090 is needed in the service until Grafana allows to connect to datasources using serviceaccounts bearer tokens so we can connect through the oauth-proxy
oc --context east2 -n thanos create serviceaccount thanos-querier

oc --context east2 -n thanos create -f thanos-querier-thanos-receive.yaml
After a few seconds we should see the Querier pod up and running:
oc --context east2 -n thanos get pods -l "app=thanos-querier"

NAME                             READY   STATUS    RESTARTS   AGE

thanos-querier-5f7cc544c-p9mn2   2/2     Running   0          2m43s
Annotate the SA with the route name so oauth proxy handles the authentication:
oc --context east2 -n thanos annotate serviceaccount thanos-querier serviceaccounts.openshift.io/oauth-redirectreference.thanos-querier='{"kind":"OAuthRedirectReference","apiVersion":"v1","reference":{"kind":"Route","name":"thanos-querier"}}'
Time to expose the Thanos Querier WebUI:
oc --context east2 -n thanos create route reencrypt thanos-querier --service=thanos-querier --port=web-proxy --insecure-policy=Redirect
If we go now to the Thanos Querier WebUI we should see two stores:
- Receive: East2 Thanos Receive
- Store Gateway: S3 Bucket
Grafana
Now that we have Prometheus and Thanos components deployed, we are going to deploy Grafana.
Grafana will use Thanos Querier as Prometheus datasource and will enable the creation of graphs from aggregated metrics from all your clusters.
We have prepared a small demo with example dashboards for you to get a sneak peek of what can be done.
Deploying Grafana
As we did before with Prometheus and Thanos Querier, we want to protect Grafana access with openshift-oauth-proxy, so let's start by creating a session secret:
oc --context east2 -n thanos create secret generic grafana-proxy --from-literal=session_secret=$(head /dev/urandom | tr -dc A-Za-z0-9 | head -c43)
Annotate the SA with the route name so oauth proxy handles the authentication:
oc --context east2 -n thanos create serviceaccount grafana

oc --context east2 -n thanos annotate serviceaccount grafana serviceaccounts.openshift.io/oauth-redirectreference.grafana='{"kind":"OAuthRedirectReference","apiVersion":"v1","reference":{"kind":"Route","name":"grafana"}}'
Download the following files:
- grafana.ini
- prometheus.json
- grafana-dashboards.yaml
- reversewords-dashboard.yaml
- clusters-dashboard.yaml
- grafana.yaml
oc --context east2 -n thanos create secret generic grafana-config --from-file=grafana.ini

oc --context east2 -n thanos create secret generic grafana-datasources --from-file=prometheus.yaml=prometheus.json

oc --context east2 -n thanos create -f reversewords-dashboard.yaml

oc --context east2 -n thanos create -f grafana-dashboards.yaml

oc --context east2 -n thanos create -f clusters-dashboard.yaml

oc --context east2 -n thanos create -f grafana.yaml
Now we can expose the Grafana WebUI using an OpenShift Route:
oc --context east2 -n thanos create route reencrypt grafana --service=grafana --port=web-proxy --insecure-policy=Redirect
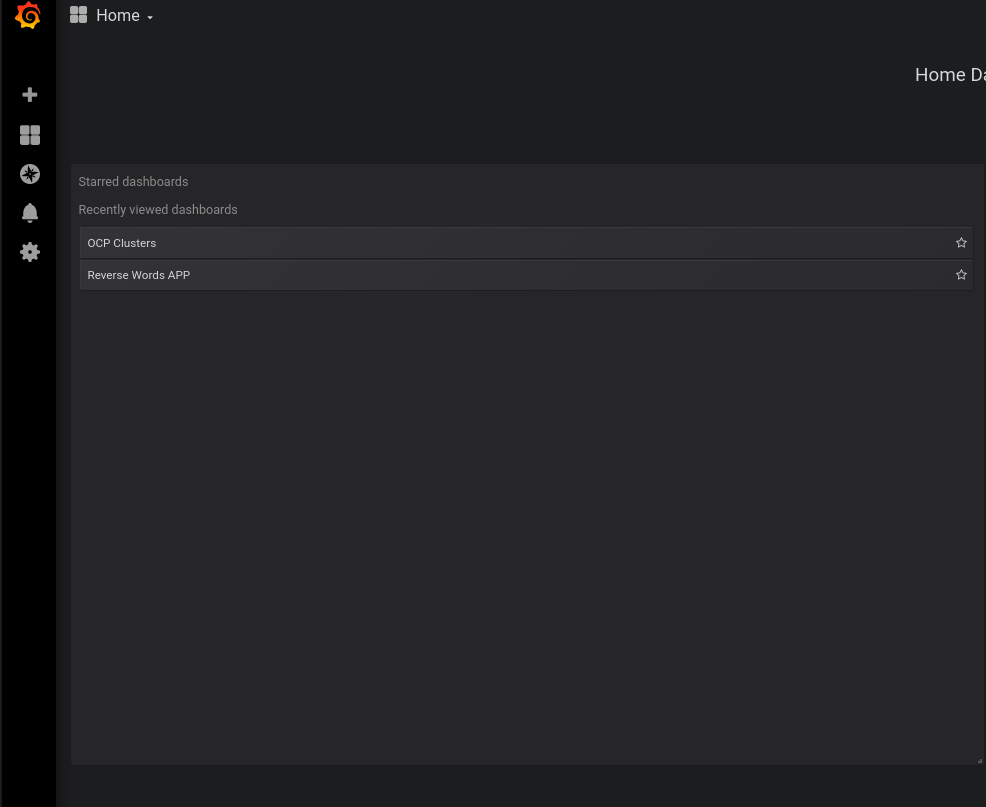
Once logged we should see two demo dashboards available for us to use:
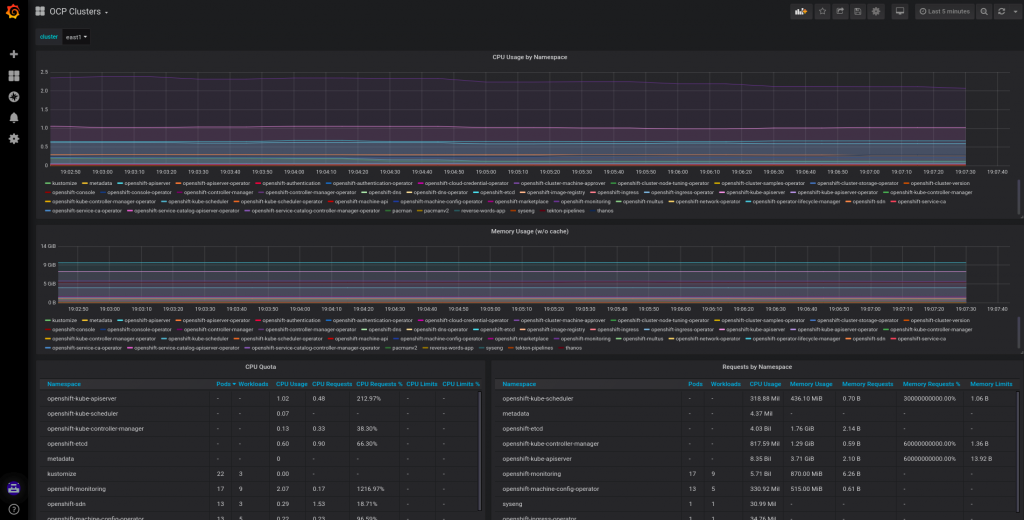
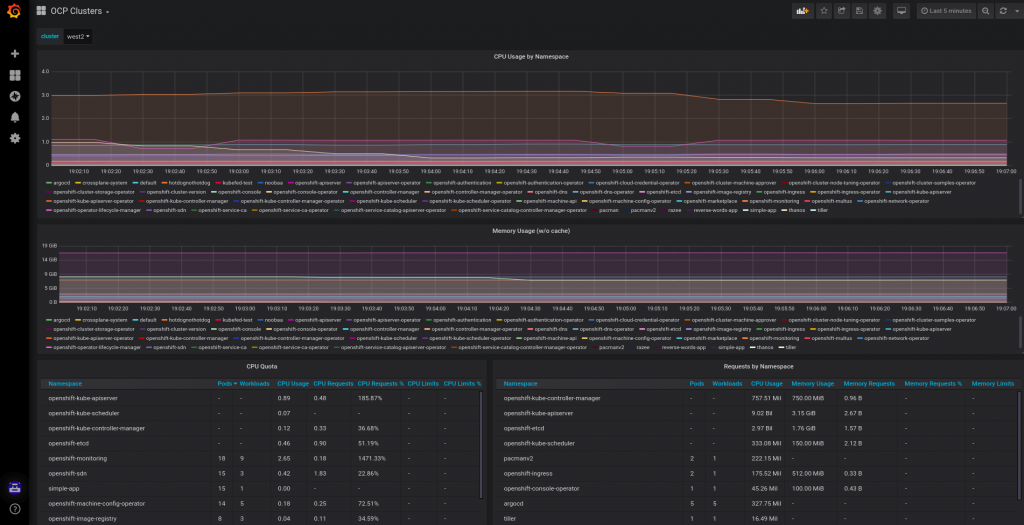
The OCP Cluster Dashboard has a cluster selector so we can select which cluster we want to get the metrics from.
Metrics from east-1
Metrics from west-2
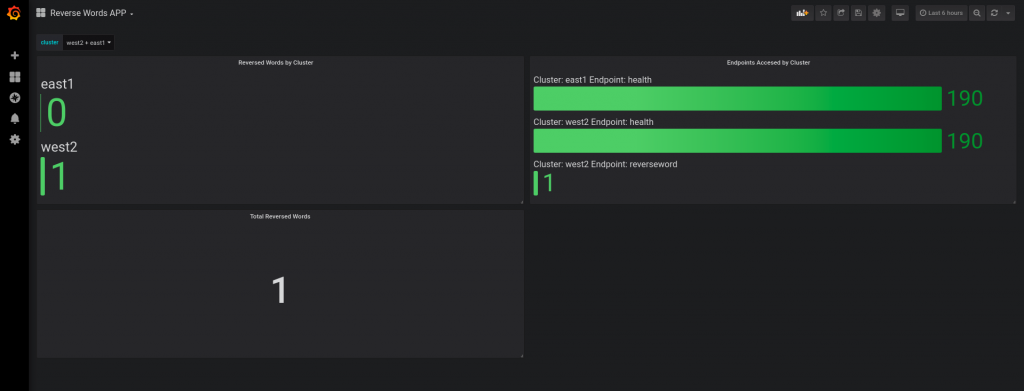
We can have aggregated metrics as well, example below.
Metrics from reversed words
Next Steps
- Configure a Thanos Receiver Hashring
About the author
More like this
Strengthening the enterprise foundation: Red Hat and Oracle’s expanding collaboration
Confidential Containers workshop on Microsoft Azure Red Hat OpenShift: Learn interactively
The Containers_Derby | Command Line Heroes
Crack the Cloud_Open | Command Line Heroes
Browse by channel
Automation
The latest on IT automation for tech, teams, and environments
Artificial intelligence
Updates on the platforms that free customers to run AI workloads anywhere
Open hybrid cloud
Explore how we build a more flexible future with hybrid cloud
Security
The latest on how we reduce risks across environments and technologies
Edge computing
Updates on the platforms that simplify operations at the edge
Infrastructure
The latest on the world’s leading enterprise Linux platform
Applications
Inside our solutions to the toughest application challenges
Virtualization
The future of enterprise virtualization for your workloads on-premise or across clouds
