This is a post on how to search, analyze, display, and troubleshoot issues with Java platforms. JBoss products run on a Java Virtual Machine (JVM), and you’ll probably need to contend with memory management (MM).
Search/Locate the exceptions
If MM is not tuned properly, system administrators, developers, and other ops folks will encounter Out Of Memory Errors (OOME). But this could also happen if there’s an application bug. OOME can happen in different parts of the JVM. This post on JournalDev explains about the JVM memory model, and for its different parts there are different solutions click here to learn about details of the different kind of OOME.
This is a real world example from a customer where the memory wasn’t properly tuned. There were four EAP VM’s using SSO picketlink.
One of the nodes had “bigger” files in size and more in quantity. To immediately find them OOME, I execute this command:
cat server* | grep -i xceptions > xceptions.logOn the “exceptions file“ created above, I can do more findings on the dates where these exceptions happened. Starting from here, if an OOME is actually found, one can do a deeper analysis.
Here is the example command:
strings xcepciones_TAM_JGO.log | grep -i outof | awk '{ print $1 " , java.lang.OutOfMemoryError " }' | grep 2018 > oome_dates.csv
And here is the command output:
…
server.log.2018-06-21:1172:19:19:09,571 , java.lang.OutOfMemoryError
server.log.2018-06-21:1188:19:19:41,482 , java.lang.OutOfMemoryError
server.log.2018-06-21:1200:19:20:27,231 , java.lang.OutOfMemoryError
server.log.2018-06-21:1201:19:20:31,713 , java.lang.OutOfMemoryError
server.log.2018-06-21:1202:19:20:33,365 , java.lang.OutOfMemoryError
server.log.2018-06-21:1229:19:20:35,813 , java.lang.OutOfMemoryError
…
In order to graph it:
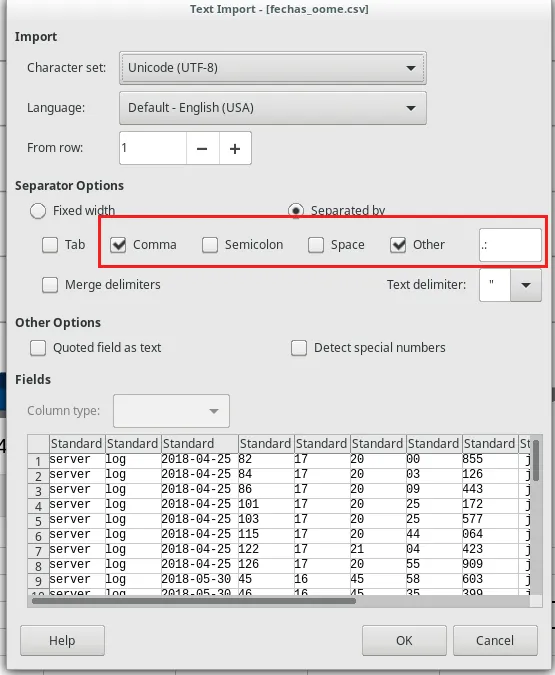
Open the file with LibreOffice and separate as shown here:

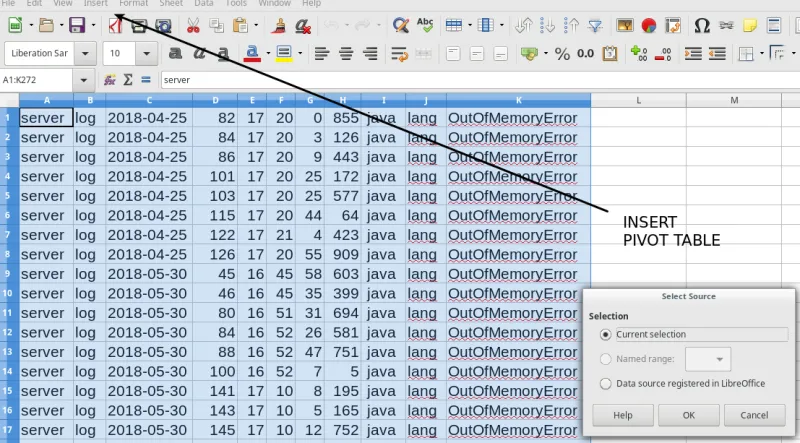
Next, Insert a pivot table:

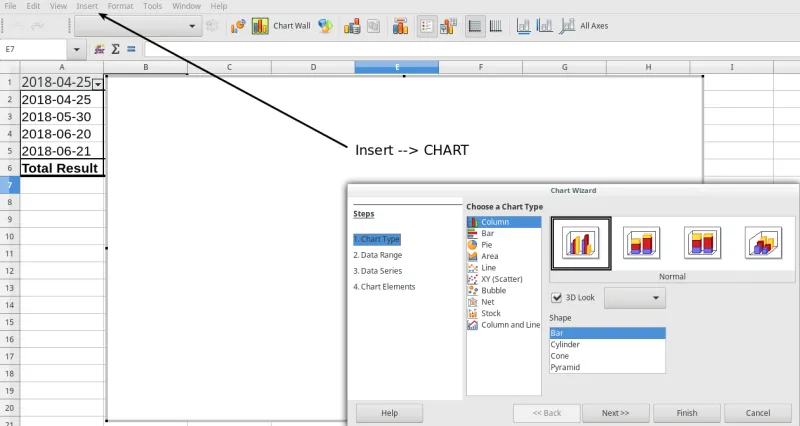
Select the row (Dates), column (Data) fields and which data to count (Data Fields).

Now, change the Data Fields to Count instead of Sum.

Show the same pivot table, but as a Graph.

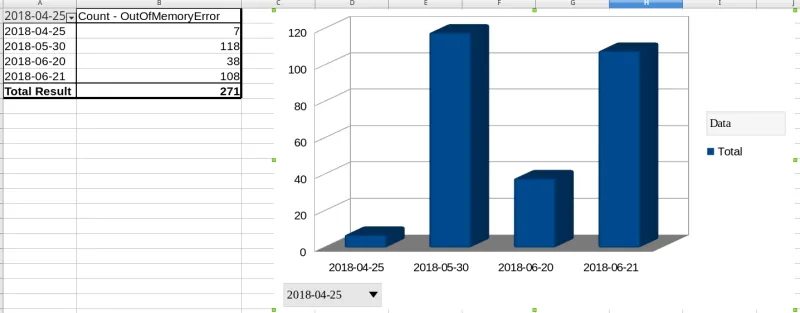
Here are the results:

What does this reveal?
On these four days, there were at least two days where the server could not function properly and reported at least 100 times it had exhausted the heap. This tells us that proper memory management tuning must be implemented.
For this particular issue there was a misconfiguration with the default heap for server instances on the host.xml for EAP’s. For different types of OOME, different solutions must be provided.
About the author
A highly skilled profesional forged in support where arcane knowledge of the JVM internals gave him an increased insights into the engine where Java applications are executed. This honed mindset is demonstrated whenever a critical situation arises, and the expectation is to have the situation solved as quick as possible is a must.
More like this
Shift gears: 10 stories redefining enterprise IT
Friday Five — March 20, 2026 | Red Hat
Keeping Track Of Vulnerabilities With CVEs | Compiler
Post-quantum Cryptography | Compiler
Browse by channel
Automation
The latest on IT automation for tech, teams, and environments
Artificial intelligence
Updates on the platforms that free customers to run AI workloads anywhere
Open hybrid cloud
Explore how we build a more flexible future with hybrid cloud
Security
The latest on how we reduce risks across environments and technologies
Edge computing
Updates on the platforms that simplify operations at the edge
Infrastructure
The latest on the world’s leading enterprise Linux platform
Applications
Inside our solutions to the toughest application challenges
Virtualization
The future of enterprise virtualization for your workloads on-premise or across clouds
