


Understanding what's happening across your Red Hat OpenShift clusters has never been more critical. OpenShift 4.18 introduces major enhancements to our observability capabilities, led by the general availability of our cluster observability operator.
Gone are the days when metrics, logs and traces were separate concerns. Modern observability demands a unified approach that helps you answer crucial questions about your platform and applications: How are they performing? Are they stable? Are they secure?
OpenShift 4.18's observability stack builds on proven open source components, hardened to Red Hat's enterprise standards. Whether you're managing a single cluster or a global fleet, you'll find new tools and integrations designed to help you:
- Deploy and manage observability components of your choice
- Gain insights across all your data sources
- Leverage a consistent experience through our cluster observability operator
Single pane of glass for cluster observability
The cluster observability operator 1.0.0 is now generally available and provides users with the ability to make use of the latest observability visualization and analytics features, specifically:
- Enhanced technology preview: Observability signal correlation and troubleshooting UI plugin - now supporting traces
- Developer preview: Multicluster alerting UI in the Red Hat Advanced Cluster Management for Kubernetes console
The cluster observability operator empowers OpenShift users with highly customizable monitoring capabilities that go beyond the platform's default monitoring stack. Unlike the standard OpenShift monitoring, cluster observability operator allows users to tailor their observability solutions to specific organizational needs while maintaining independence from OpenShift version updates.
For enterprise teams managing multi-tenant environments, cluster observability operator introduces the ability to deploy multiple monitoring stacks within a single cluster. Development and operations teams can now configure their own monitoring views, set custom retention policies and manage alerts independently - all without affecting other teams' monitoring setups.
Performance analysis and capacity planning get a significant boost with cluster observability operator's advanced features. Organizations can leverage extended data retention for historical analysis, enabling better trend forecasting and anomaly detection. This deeper insight into resource usage helps teams optimize their deployments and prevent performance issues before they impact production workloads.
We enhanced the observability signal correlation and troubleshooting UI plugin to support traces (enhanced technology preview) and enabled multicluster alerting (developer preview) in the Red Hat Advanced Cluster Management console to help administrators further understand their environments In this developer preview, the cluster observability operator needs to be installed on the hub. Please note that in the future cluster observability operator will be enabled by default within the Red Hat Advanced Cluster Management multicluster observability operator.
In-cluster monitoring
OpenShift 4.18 brings key improvements to in-cluster monitoring, enhancing flexibility, performance and troubleshooting.
User-defined monitoring administrators can now create multi-namespace Prometheus alerts, making alerting more adaptable for workloads spanning multiple namespaces. Prometheus I/O patterns have been optimized for shared storage, reducing overhead and improving efficiency in high-ingestion environments. AlertManager now integrates with proxy settings, simplifying configurations for networks requiring proxies.
For better observability, OpenShift now supports accelerator metrics collection, offering deeper insights into workloads using GPUs and specialized hardware. Additionally, real-time configuration validation and feedback streamline monitoring configurations, reducing troubleshooting time.
Debugging is also easier with custom metrics collection in must-gather, enabling deeper insights during support cases. Alerting improvements include minor updates and expanded runbooks for better issue resolution.
Finally, this release updates key monitoring stack components, including AlertManager 0.27.0, Prometheus 2.55.1 and Thanos 0.36.1, providing a more reliable and performant monitoring experience.
Logging
Logging 6.2 will be the next extended update support (EUS) release of logging that will be released in March 2025, shortly after OpenShift 4.18. In this release, users that have cluster logging set up in Google Cloud will be able to authenticate by utilizing Short Term Tokens via Workload Identity Federation, enhancing their security within Google Cloud. Also, users who need to send logs via a proxy will be able to configure a unique HTTP output proxy that can be different from a direct connection or default proxy. These proxies can be configured per output without affecting other cluster logging outputs.
Distributed tracing
The Red Hat build of OpenTelemetry and Red Hat OpenShift distributed tracing 3.5 will be released in March 2025. This new release will be available to all customers as part of their OpenShift subscription.
Red Hat build of OpenTelemetry
This release enhances supported capabilities of the collector by adding KubeStats and HostMetrics as generally available components. We are also adding support for exporting these OpenShift monitoring metrics via OTLP, so that users can send metrics to any monitoring system that accepts OTLP endpoints. Finally, in this release, we are automating role-based access control (RBAC) for OpenTelemetry components so that users no longer need to manually create the necessary permissions for each component.
Red Hat OpenShift distributed tracing platform (Tempo)
In this release, we are adding fine grained RBAC into tracing data - this means that users can only see trace spans from namespaces where they have access privileges. We are also adding support for IBM Cloud Storage for Tempo, and improving memory performance for the Tempo monolithic stack.
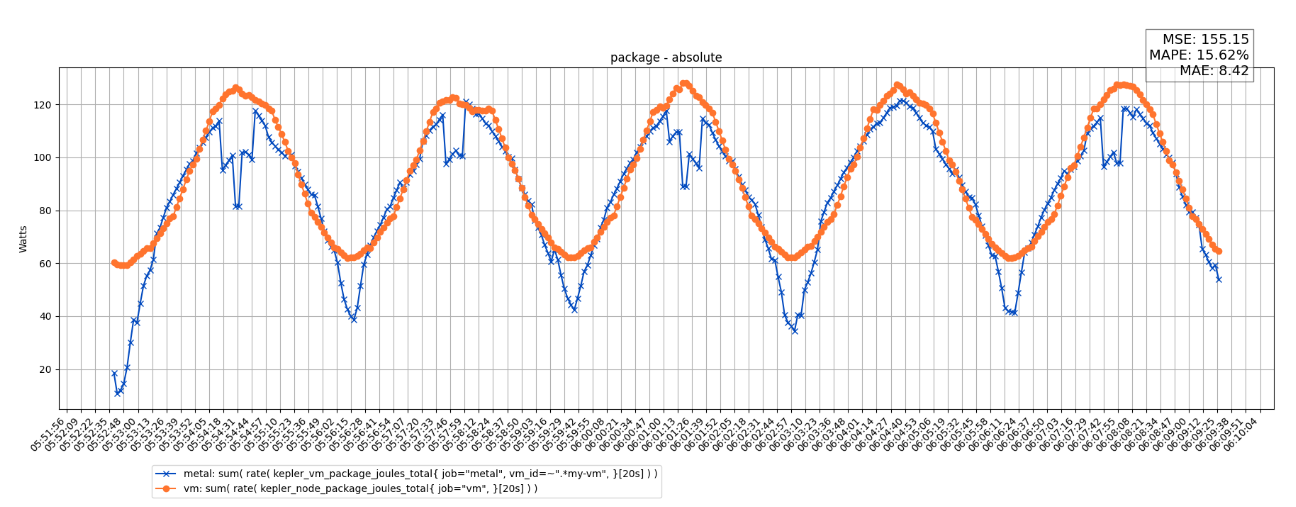
PowerMonitoring TP 0.3 and the road to general availability
Big things are happening with Power Monitoring 0.3 (tech preview) which is based on the upstream Kepler project, and we’ve made significant progress on the road to general availability. This release brings us closer than ever to delivering accurate and reliable power monitoring for bare-metal environments. We’re also laying the foundation for future GPU workload support.
For tech preview 0.3, we’ve hit some important milestones: creating downstream continuous integration (CI) jobs for the power monitoring operator, integrating with Cloud-Platform-as-a-Service (CPaaS) pipelines and successfully publishing builds to errata. These steps reflect a more mature productization process, getting us one step closer to making power monitoring a production-ready solution.
So, what’s next? We’re working to stabilize the power monitoring API, enhance data collection with pod-level labels and reduce Kepler’s overhead to make it more efficient. Flexibility is another priority, with plans to introduce features such as the ability to disable estimations. We’re also improving eBPF execution for better scalability and expanding platform support to include public clouds, OpenStack and even power metrics for Intel and NVIDIA accelerated compute architectures.
Are you curious to see what else is happening in Sustainability? Read about PEAKs - Power aware k8s scheduler - in Red Hat Research magazine.
See power monitoring in action through this demo created by Didier Wojciechowski:
Network observability
The network observability operator continues to evolve, bringing enhanced visibility and troubleshooting capabilities to OpenShift users. As an independently lifecycled add-on, the latest version (1.8) is set to be released around the same time as OpenShift 4.18. This release includes a number of improvements, particularly in the realm of user defined networks (UDNs) and an upgraded command line interface (CLI) experience.
Enhanced observability for user defined networks (UDNs)
With the introduction of UDNs in Open Virtual Network (OVN) Kubernetes, the network observability operator now provides in-depth observability for all UDN network segments and objects assigned to these segments. This feature enables users to gain insights into UDN traffic flows and interactions, improving network monitoring and debugging efficiency.
In this version, the operator allows users to capture network flows, packets and metrics directly from their OpenShift clusters. The ability to visualize these flows and their associated topology with UDNs is now available in developer preview in v1.8. This addition helps administrators and developers better understand traffic movement across their UDN environments, improving operational efficiency and issue resolution.
New and improved lightweight network observability CLI for enhanced debugging
One of the standout features in version 1.8 is the enhancements to the lightweight network observability CLI. Unlike traditional CLI tools that require installation and configuration, this new CLI requires no prior setup—no need to install the operator—because everything is handled automatically. Users can run it directly from their laptop’s command prompt, making it a convenient and efficient tool for debugging network-related issues.
With this CLI, users can:
- Quickly analyze network flows without setting up additional tools
- Debug networking issues from their local environment
- Leverage significant enhancements introduced in version 1.8 for improved performance and usability
What’s next for Red Hat OpenShift observability?
Our observability features are deeply integrated into OpenShift, providing improved insights into infrastructure and application performance. We're committed to delivering analytics that help you better understand system behavior.
Wrap up
Ready to explore these new features? Visit the redhat.com/observability and documentation pages to learn more and get started with the latest observability tools in OpenShift. The Red Hat’s Developers Observability page also contains information to help you learn about and implement observability capabilities.
We value your feedback! Share your thoughts and suggestions using the Red Hat OpenShift feedback form.
Product trial
Red Hat OpenShift Container Platform | Product Trial
About the authors
Roger Florén, a dynamic and forward-thinking leader, currently serves as the Principal Product Manager at Red Hat, specializing in Observability. His journey in the tech industry is marked by high performance and ambition, transitioning from a senior developer role to a principal product manager. With a strong foundation in technical skills, Roger is constantly driven by curiosity and innovation. At Red Hat, Roger leads the Observability platform team, working closely with in-cluster monitoring teams and contributing to the development of products like Prometheus, AlertManager, Thanos and Observatorium. His expertise extends to coaching, product strategy, interpersonal skills, technical design, IT strategy and agile project management.
Jamie Parker is a Product Manager at Red Hat who specializes in Observability, particularly in the Logging and OpenStack areas. At Red Hat, Jamie works with organizations and customers to learn about their needs within the ever changing Observability landscape, and based on their feedback, helps to guide upcoming products within the Red Hat Observability Platform. Jamie enjoys sharing lessons learned to the community by frequently speaking at meetups and conferences, and by blogging.
Vanessa is a Senior Product Manager in the Observability group at Red Hat, focusing on both OpenShift Analytics and Observability UI. She is particularly interested in turning observability signals into answers. She loves to combine her passions: data and languages.
Deepthi Dharwar is currently a Principal Product Manager at Red Hat, where she is responsible for OpenShift Networking .She leads product development for OpenShift Software-Defined Networking, Ingress/Egress, DNS, and Network Observability, while also shaping the product strategy and roadmap. Deepthi loves exploring emerging technologies and is passionate about how technology can drive innovation and solve real-world problems.
More like this
4 reasons to start using image mode for Red Hat Enterprise Linux right now
Hardened, ready, and no cost: Container security evolved
The Containers_Derby | Command Line Heroes
Can Kubernetes Help People Find Love? | Compiler
Browse by channel

Automation
The latest on IT automation for tech, teams, and environments

Artificial intelligence
Updates on the platforms that free customers to run AI workloads anywhere

Open hybrid cloud
Explore how we build a more flexible future with hybrid cloud

Security
The latest on how we reduce risks across environments and technologies

Edge computing
Updates on the platforms that simplify operations at the edge

Infrastructure
The latest on the world’s leading enterprise Linux platform

Applications
Inside our solutions to the toughest application challenges
Virtualization
The future of enterprise virtualization for your workloads on-premise or across clouds