In my previous article, I introduced the Performance Co-Pilot (PCP) suite in Red Hat Enterprise Linux (RHEL) to help you measure the electrical power consumption of your machines. While performing a series of tests in my lab, I started to wonder whether slower systems could be more energy efficient than fast systems. To test this hypothesis, I'm using a new setup to compare how quickly various Linux systems can perform compute tasks, and how energy efficient they are when performing those tasks:
- The control system, for doing measurements
- The System Under Test (SUT), which runs workloads while you measure its power consumption
Both systems have Performance Co-Pilot (PCP) installed. The SUT is running pmcdand pmda-denki to provide metric data. The control system is running PCP to collect the data and store it in archive files for later evaluation. Ansible playbooks are used to install the required packages on both systems.
Here's some clarification on important terminology I use in this article:
- Power: Energy consumed at a point in time, measured in Watt or volt-ampere (VA). For example, "this system here consumes 20 Watt right now”.
- Energy: Amount of power used over a time span. Measured, for example, in Watt-hour or Joules.
A quick recap of the power related metrics which pmda-denki currently offers:
- RAPL readings: on x86 systems, providing power consumed by the CPU, RAM and onboard GPU.
- Battery readings: computing power consumption from monitoring battery discharge
- Smart plug readings: these are devices with the capability of reporting the power consumption of the currently attached consumer via network/API. For this article, I use SwitchBot smart plugs with the Tasmota firmware. Many other devices can be used instead.
Finding the best workload for testing
In this article, I'm using one example of a workload, and then I measure consumption and energy efficiency, and compare multiple systems. For example, running the full SPEC benchmark suite would take a very long time, especially when measuring a smaller system using ARM or RISC-V.
Instead of comparing I/O to storage attached to a system, I focus on CPU and memory operations. For this reason, I decided to run a single job for a configurable time, for example 10 minutes. Inside of that time, I measure how often a certain CPU-intensive operation can be performed. For this article, I use the operation of uncompressing a file:
$ bzcat httpd-2.4.57.tar.bz2 >/dev/null
This can be done using one or multiple threads, which get distributed over the cores of a system. When counting the number of completed uncompression operations, you get an idea of the computing power of a system for this task. Afterwards, you can look at the power consumed over 10 minutes, and calculate how much energy the system consumed for a single uncompression. The compressed file is stored in RAM, and the uncompressed data is directed to /dev/null, to reduce impact from storage subsystems.
The basic flow of the compute job:

The flow starts on the left, script job_httpd_extract_cpu.sh is executed. In the script, function extract() is run 3 times, and each run spawns one thread in the background. Each of these threads is in a loop uncompressing the file, and counting the number of completed extractions. These threads are run in the background, and sleep waits 10 minutes while the threads are running. Then the threads are killed and the overall number of successful extraction jobs is calculated. After evaluating the power metrics from PCP, we have all we need to calculate the energy consumption and efficiency.
How long must a job run for useful results?
With the workload decided upon, the remaining question is how long do we need to perform continuous extractions while measuring the power consumption to get meaningful results? If extracting the file takes 60 seconds, then running the job for just 30 seconds doesn't tell us anything. But even if we run continuous extraction jobs for 5 minutes, how much will the result of that differ between multiple runs? Do we need to run it for 2 minutes or 2 hours to get meaningful results?
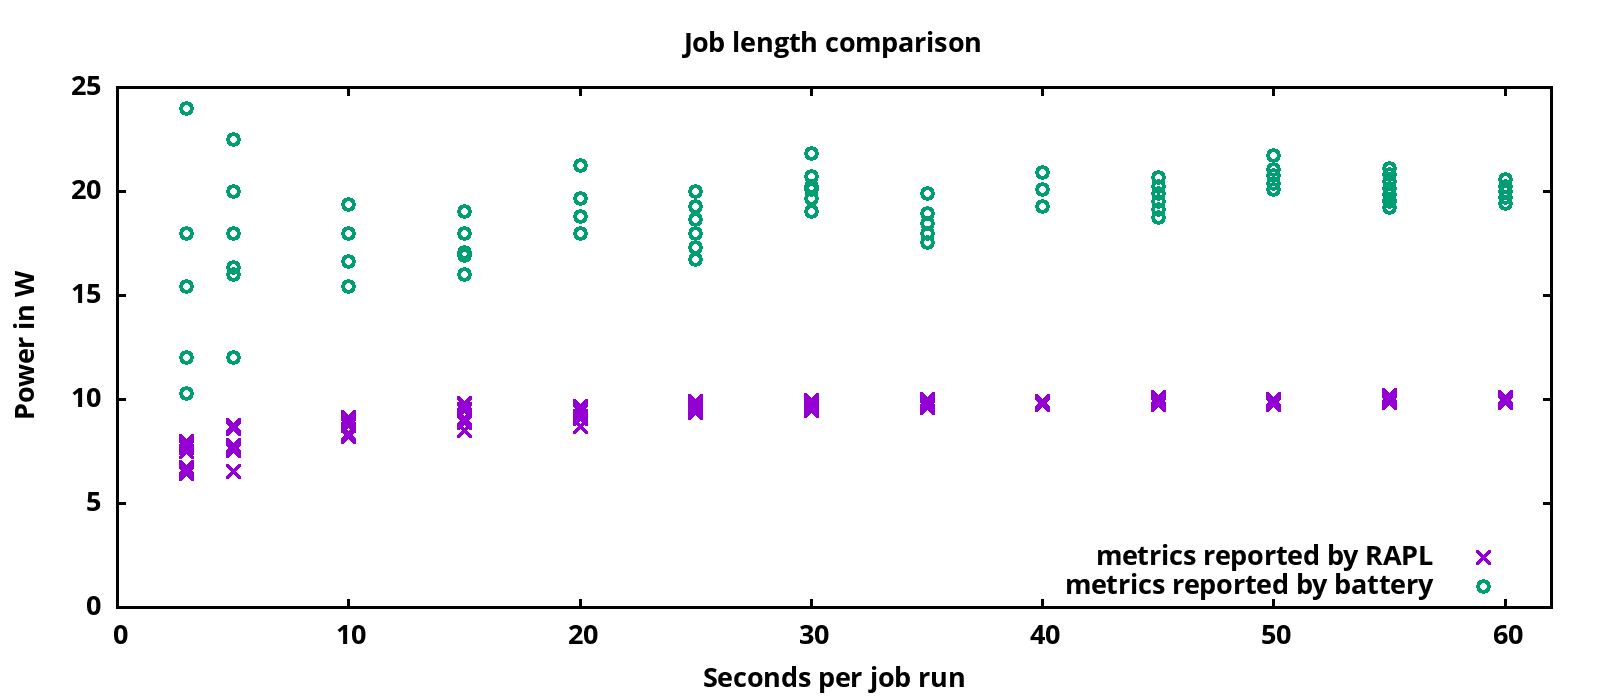
For the following graph, a job was running for various runtimes. The job started 4 threads, each running as many file extractions as possible in a loop. On the left, running the job for only 3 seconds, you can see major differences between multiple runs. To the right, with 60 seconds runtime, the measured consumption stabilizes between multiple runs. The violet X marks are readings from RAPL (Running Average Power Limit), which measures CPU+memory consumption. These marks are not as widespread as the green O marks (the battery metrics). This data is from the Steam Deck, which has RAPL and battery metrics available.

Based on these results, I did settle on running most of the following tests for 10 minutes, just to be sure to get solid numbers.
Which power metric from the smartplug is right?
From RAPL and Battery based metrics, we are getting one value for power consumption for computing that's pretty straight forward. From reading my Tasmota power plug, more gets available:
$ http://192.168.0.2/cm?cmnd=Status%208
{
 "StatusSNS": {
   "Time": "2024-02-12T10:28:25",
   "ENERGY": {
     "TotalStartTime": "2023-10-27T13:19:18",
     "Total": 12.599,
     "Yesterday": 0.015,
     "Today": 0.006,
     "Power": 3,
     "ApparentPower": 4,
     "ReactivePower": 3,
     "Factor": 0.67,
     "Voltage": 101,
     "Current": 0.037
   }
 }
}
This provides 4 potential metrics for power consumption:
- Power
- ApparentPower
- ReactivePower
- Multiplying Voltage and Current
The first 3 are directly reported by the smartplug. The last is computed from the Voltage and Current. What’s the right one to use? To find the answer, I ran workloads to compare the above 4 metrics (from the smartplug) with the other 2 metrics, RAPL and Battery. For the Thinkpad L480:

The left graph shows how much power the system is using, as reported by various available metrics. On the left, with 0 threads, the system is idle, but also consuming power. With 3 threads, the system is using slightly less power than with 2 threads. All our ways to measure consumption are observing this. Not shown in the graph, but looking in parallel at the CPU clock speed, you can see that with 1 or 2 cores under load, the CPU clocks at 3.4Ghz, thanks to Intel Turbo Boost. With 3 or more threads, the CPU clocks at 3.2Ghz or 3Ghz, also using slightly less power.
In general, the battery metric can be considered solid. It’s based on looking at the battery charge level while running the workloads. The right graph declares battery metrics as 0 and shows the delta to the other metrics. Here, we see that the metric Power from the Tasmota smartplug is the metric most similar to the battery metric.
What’s the most energy efficient system?
Now we know how long we need to run the extraction-in-a-loop-job, and also which metric from the Tasmota smartplug is most similar to the metric from the battery. Let’s run jobs on various architectures!

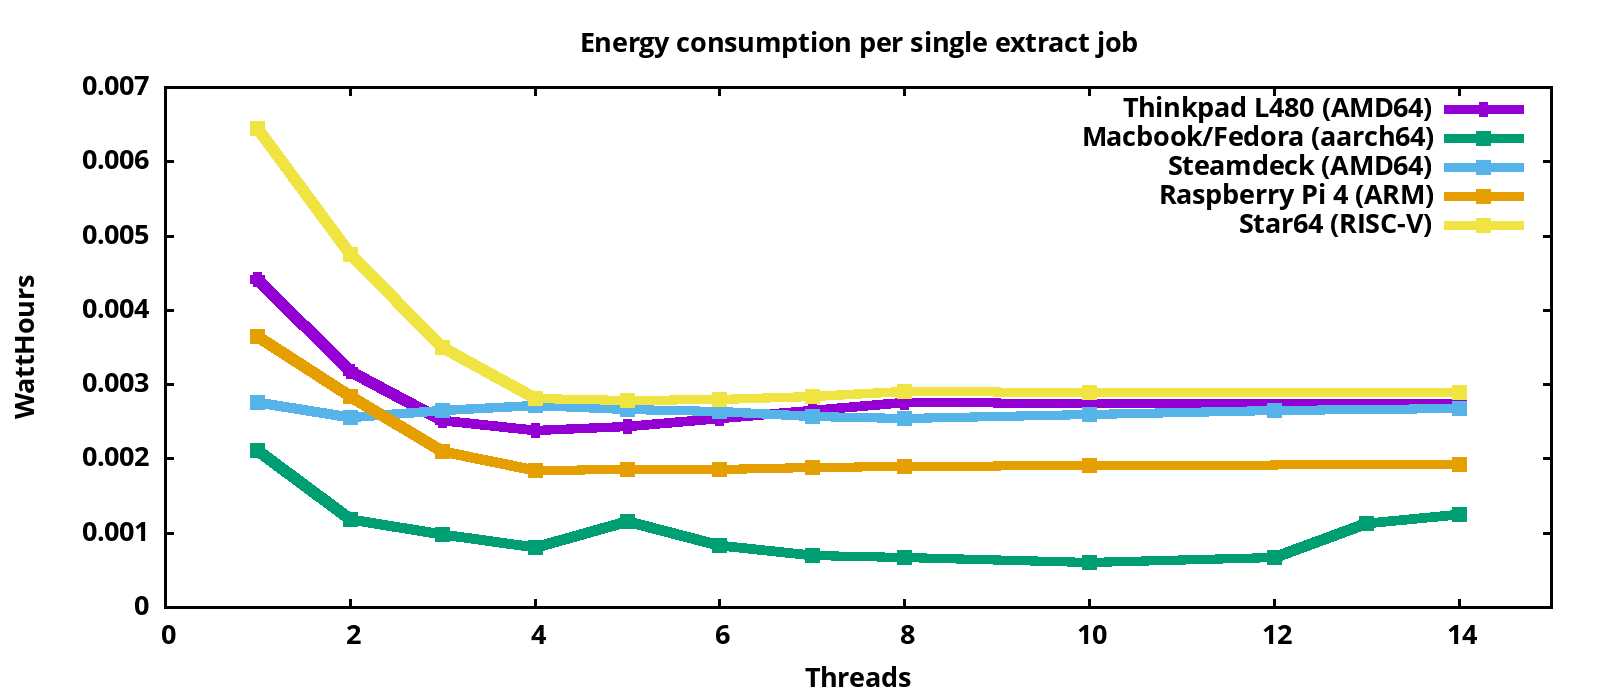
This graph shows how much energy the systems consume for a single extraction operation. The systems in detail:
- Thinkpad L480: x86_64, model released 2018, an 8th gen Intel i5-8250U CPU (14nm), configured for 4 cores without hyperthreading. For this system, all three sources to measure power consumption are usable.
- Macbook Pro Asahi Fedora remix: 10 core AppleSilicon M2 CPU (5nm), which is an aarch64 design. Model from 2023. Due to the high number of cores, up to 10 threads can be run on separate cores.
- Steam Deck: AMD CPU with 4 cores/8 threads (7nm), released 2022
- Raspberry Pi 4: 4 core (16nm) aarch64 system from 2019
- Star 64: RISC-V board with 4 cores, introduced 2023
All systems have more than one core. For all systems, the consumption for each job goes down as more cores get used. With 3 and more cores under load, the Raspberry Pi 4 is more efficient per job than the Intel systems I investigated. The Macbook shows the best energy efficiency, which surprised me because support for Apple silicon in the Linux kernel is relatively new. RISC-V support in the kernel is also quite young.
Total power draw
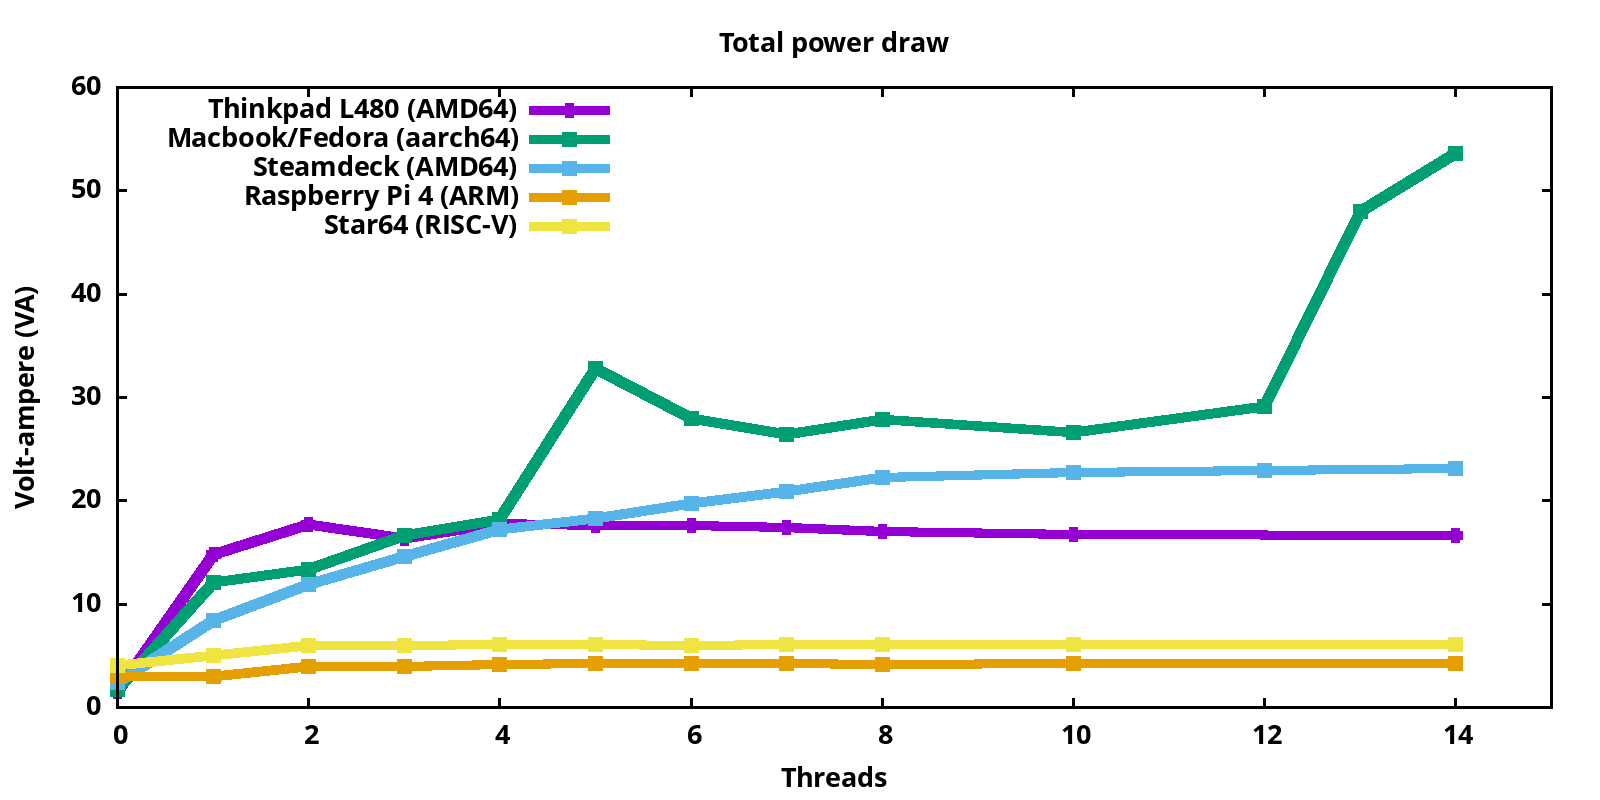
Comparing the total power draw of the systems under test:

On the left, with 0 jobs running, we have the consumption of the idle systems. We see that the Macbook is consuming not much when idling, and under load goes up to 54W.
The following graph shows us the total number of extract-jobs per second, which the systems manage to perform:

Most of the systems have 4 cores, so increasing the number of threads up to 4 is increasing the number of extraction jobs. The Macbook has 10 cores, so we also see the number of extraction jobs increasing up to 10 parallel threads. The Raspberry Pi 4 and Star64 do almost the same number of extraction jobs per second, so their curves are almost overlapping.
Conclusion
We have compared the energy efficiency of various systems for a certain computation job. The results are likely to be different for other workloads. With the methods used here, many investigations become possible, for example:
- What’s the most energy efficient platform for your application/workload?
- How do optimizations from
powertopimpact the system's energy efficiency? - What’s the impact of mitigations like Spectre and Meltdown on energy efficiency?
- How is hyperthreading influencing performance and energy efficiency for workloads?
The test scripts could also be extended to additionally record the clock speeds of the involved CPU cores. We could consider creating a project around this, collect more scripts with compute-jobs, and gather measurement results from various systems.
As with the previous article, the underlying tools here, like PCP and pmda-denki, are part of RHEL and in scope of the RHEL product support. The actual measurements were done with scripts available on my GitHub in the denki-jobrunner directory (the raw data used to generate graphs are also in the repo). These are not supported by Red Hat.
I would like to thank the fellow Red Hat TAMs and specialists who have reviewed and collaborated on this article.
About the author
Christian Horn is a Senior Technical Account Manager at Red Hat. After working with customers and partners since 2011 at Red Hat Germany, he moved to Japan, focusing on mission critical environments. Virtualization, debugging, performance monitoring and tuning are among the returning topics of his daily work. He also enjoys diving into new technical topics, and sharing the findings via documentation, presentations or articles.
More like this
Innovation is a team sport: Top 10 stories from across the Red Hat ecosystem
Production-ready: Red Hat’s blueprint for 2026
Understanding AI Security Frameworks | Compiler
Data Security And AI | Compiler
Browse by channel
Automation
The latest on IT automation for tech, teams, and environments
Artificial intelligence
Updates on the platforms that free customers to run AI workloads anywhere
Open hybrid cloud
Explore how we build a more flexible future with hybrid cloud
Security
The latest on how we reduce risks across environments and technologies
Edge computing
Updates on the platforms that simplify operations at the edge
Infrastructure
The latest on the world’s leading enterprise Linux platform
Applications
Inside our solutions to the toughest application challenges
Virtualization
The future of enterprise virtualization for your workloads on-premise or across clouds
