Logging has for a long time been the cornerstone of any observability solution.
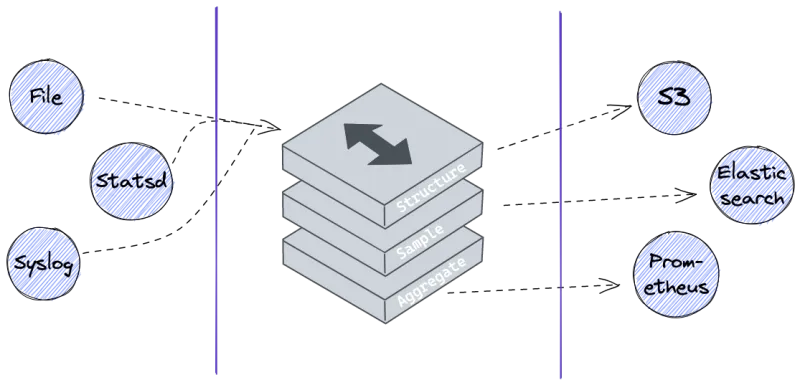
Vector is an essential part of our logging stack. Vector is a log collector and analyzer for DevOps teams and streamlines the processing of distributed logs from any source to a single stream that can be sliced, diced, aggregated and analyzed in real-time.
For example,with Vector as a log collector, customers can send logs to an Amazon CloudWatch destination for further analysis. Additionally, customers can now assemble log messages as a stacktrace in one single log entity using JSON format.
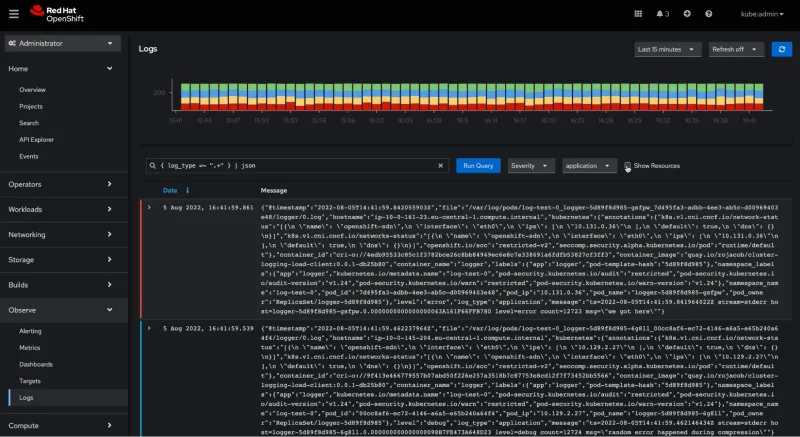
With the release of Logging 5.5, users can now make use of a brand new Logging view plugin. The Logs view in the OpenShift Console - dedicated to logs exploration - allows users to deep dive into the root cause of their system’s problems. This new Logs view displays the original log entries, and lets users filter them by severity, as well as zoom in for further investigation.
These updates provide better product support and a better out of the box experience within the OpenShift Console across Red Hat Private, Hybrid, and Managed deployments going forward.

What are the problems you can now solve?
Unlike other tools, Vector was born from monitoring tools like statsd and collectd. It's built using their techniques of instrumentation. And it will directly process JSON + StatsD protocol-formatted data without requiring any extra configuration or plugins.
Vector - the collector
As its built-in Rust Vector is a high-performance observability data router, it makes collecting, transforming, and sending logs, metrics, and events very easy.
Performance
At the end when you are choosing an open source collector for your environment then performance will be a key indicator for your daily operations. So how do Vector compare to others when it comes down to resource consumption with CPU, Memory, LPS (Logs per second) and scalability.
There has been an interesting performance comparison between different log collectors in this blog post. As you could expect, Vector is great when it comes to LPS and LPS per CPU. The scalability is much better and it has less memory consumption. But in terms of CPU consumption it has a slight disadvantage.
Simple
As Vector is this high-performance collector it is also a great tool for building your observability pipeline. As you collect all your logs you at some point may also want to transfer that data to another vendor. Vector is vendor neutral and allows you to Collect data from multiple sources, transform your data and route it to any other vendor.

Loki - the log aggregation
The main benefit of using Loki is that it does not index all log lines and only indexes labels associated with log lines.This feature makes Loki much faster compared to the traditional way of collecting logs. Loki is a data store that is optimized for effectively saving log data.The efficient index of log data will be separated from other log systems. Unlike other log systems, the Loki index is based on the label, and the original log message is not indexed.
Features
Efficient memory use for index logs
By establishing an index on a set of labels, the index can be significantly smaller than other log aggregates. Less memory makes a lower operating cost. Loki’s architecture has an awesome performance, low storage costs, and separation that allows for selective scaling and easier debugging. Loki takes a different approach to log storage and index compared to the majority of log servers.
Instead of ingesting everything possible into an index, Loki prefers to have a small index. This index is then used to look up chunks of data where full log entries are stored. When a query is executed, chunks are sent for processing by a distributed grep-like service that processes client requests. This allows good performance to be maintained while the small index and simple shards storage mean only a low cost of storage is required to keep your data.
It also has very simple storage requirements. Starting from Loki 2.0, it is enough to have S3 compatible storage. No need for additional document databases. Because of both the small index and the ability to work with very cost-effective storage like S3, Loki can be really cost-effective.
Multi-tenant
Loki allows multiple tenants to use a single Loki instance. Data of different tenants are completely isolated from other tenants. Users can configure multiple tenants by assigning tenant IDs in the agent.
LogQL, LOKI query language
LogQL is a new language for log analysis and visualization. It’s based on some of the same constructs as PromQL, but redesigned to meet the needs of those not using Prometheus. LogQL users will find that LogQL is familiar and flexible, and can be used to generate queries for logs. The language also helps to generate an indicator from log data, which is a powerful feature that is far exceeding log aggregation.
Scalability
Loki is working well in a small range. In a single process mode, all required micro services are running in a process. Single process mode is ideal for testing LOKI, running or running on a small size.
The LOKI is also intended to be horizontally expanded for large-scale installation. Each micro service component of the LOKI can be broken down into a separate process, and the configuration allows the components to be separately expanded separately.
Flexibility
Many agents (clients) have plugin support. This allows the current observable structure to add Loki to their log aggregation tool without switching existing portions of the observable stack.
Logging View
With Logging 5.5, a Logging view (plugin) can now be accessed via the Admin Console (cloud.redhat.com). By browsing into the Observe> Logs page of the OpenShift Console, users can now easily search application/infrastructure/audit logs and filter them by severity. The Logs page thus adds substantial value to the overall OpenShift Observability UI experience.
A demo of the brand new Logging view plugin is provided below:
What are we planning next?
If you are logging to an in-cluster Elastic or Loki, or forwarding to some supported endpoint we recommend OpenShift Logging. As we are moving towards the next release we plan to add a data retention API, log based alerts and alerts to an operational environment. Future development will include autoscaling, log based metrics and some OCP dashboards. In addition to this, the Logging view plugin will be soon made available in the Developer Console, coupled with a series of UX improvements for better navigation. Stay tuned!
About the authors
Roger Florén, a dynamic and forward-thinking leader, currently serves as the Principal Product Manager at Red Hat, specializing in Observability. His journey in the tech industry is marked by high performance and ambition, transitioning from a senior developer role to a principal product manager. With a strong foundation in technical skills, Roger is constantly driven by curiosity and innovation. At Red Hat, Roger leads the Observability platform team, working closely with in-cluster monitoring teams and contributing to the development of products like Prometheus, AlertManager, Thanos and Observatorium. His expertise extends to coaching, product strategy, interpersonal skills, technical design, IT strategy and agile project management.
Vanessa is a Senior Product Manager in the Observability group at Red Hat, focusing on both OpenShift Analytics and Observability UI. She is particularly interested in turning observability signals into answers. She loves to combine her passions: data and languages.
More like this
Ford's keyless strategy for managing 200+ Red Hat OpenShift clusters
F5 BIG-IP Virtual Edition is now validated for Red Hat OpenShift Virtualization
DevSecOps decoded | Technically Speaking
Unlocking zero-trust supply chains | Technically Speaking
Browse by channel
Automation
The latest on IT automation for tech, teams, and environments
Artificial intelligence
Updates on the platforms that free customers to run AI workloads anywhere
Open hybrid cloud
Explore how we build a more flexible future with hybrid cloud
Security
The latest on how we reduce risks across environments and technologies
Edge computing
Updates on the platforms that simplify operations at the edge
Infrastructure
The latest on the world’s leading enterprise Linux platform
Applications
Inside our solutions to the toughest application challenges
Virtualization
The future of enterprise virtualization for your workloads on-premise or across clouds

