In a previous article, we shared the results of the DPDK latency tests conducted on a Single Node Openshift (SNO) cluster. We were able to demonstrate that a packet can be transmitted and received back in only 3 µs, mostly under 7 µs and, in the worst case, 12 µs. These numbers represent the round trip latencies in Openshift for a single queue transmission of a 64 byte packet, forwarding packets using an Intel E810 dual port adapter.
In this article, we further explore the configuration settings applied to the Single Node OpenShift cluster and extend the experiment to discover what zero-loss latency is when transmitting packets at a given rate. The metric of zero-loss latency, or zero packet loss latency, represents the round trip time for a reasonably high throughput rate an adapter can transmit without dropping any single packet.
The first section of this article describes the tuning settings to configure the Single Node OpenShift cluster as an ultra-low-latency unit. Then we demonstrate the test results for the zero-loss criteria, and compare latency numbers between low and high throughput rates.
This article demonstrates the capability of DPDK to achieve zero-loss latency in OpenShift and provides a technical summary of the tuning settings required for low-latency workloads. Likewise, this is a technical document intended for network architects, system administrators, and engineers interested in low-latency and networking performance.
Sources of latency
Preemption is the enemy of latency. In a system, preemption can be based in hardware or software, coming from a variety of sources:
Hardware
- Device interrupts
- SMIs (System Management Interrupt)
- MCE (Machine Check Exception)
- CPU frequency changes
- Processor idle states
- Cache miss
- Branch prediction
- Hyperthreading (SMT)
- Page fault (TLB)
- CPU sleep (C-states)
Software
- OS Interrupts
- Kernel inter-processes interrupts (IPIs)
- Noisy neighbor processes
- Process wake-up delay
- Context switching
- Process scheduling
- Lock contention
- RCU stalls
Running a process is not trivial, and produces several types of delays. Think about a process that is supposed to run with the minimum latency possible. Ideally, it would start its job immediately and complete without any interruptions. However, this is not what happens in a real world scenario. The operating system needs to wake the process up. The processor frequency may need to be adjusted to schedule the task. The scheduling priority is then verified to decide who runs first from the queue. Loading the process into memory may also take more time than expected if the bus or cache are being used by other resources. Once the process is allocated in memory, it finally starts running.
A running process can be interrupted for many different reasons, which are also called preemptions. A typical preemption is a device interrupt, another process, a housekeeping task from the operating system, or even a system management interrupt (SMI).
It's impossible to guarantee that a process will run immediately and without being interrupted, but we can mitigate preemptions by applying some tuning settings to convert the traditional system into an ultra-low-latency unit. These configurations are detailed in the next section.
Openshift settings for low latency
The following configurations can be applied to run "ultra-low-latency" workloads in a Single Node OpenShift cluster. For more information, refer to the OpenShift online documentation. Depending on the OpenShift version you have installed, not all of these settings are required, and some of them might automatically be applied. For these tests, a single node OpenShift 4.10 has been used.
Workload partitioning
Workload partitioning isolates user workloads from platform workloads using the normal scheduling capabilities of Kubernetes to manage the number of pods that can be placed onto those cores, and avoids mixing cluster management workloads and user workloads.
This YAML snippet configures workload partitioning:
apiVersion: machineconfiguration.openshift.io/v1
kind: MachineConfig
metadata:
  labels:
    machineconfiguration.openshift.io/role: master
  name: 02-master-workload-partitioning
spec:
  config:
    ignition:
      version: 3.2.0
    storage:
      files:
      - contents:
          source: data:text/plain;charset=utf-8;base64,W2NyaW8ucnVudGltZS53b3JrbG9hZHMubWFuYWdlbWVudF0KYWN0aXZhdGlvbl9hbm5vdGF0aW9uID0gInRhcmdldC53b3JrbG9hZC5vcGVuc2hpZnQuaW8vbWFuYWdlbWVudCIKYW5ub3RhdGlvbl9wcmVmaXggPSAicmVzb3VyY2VzLndvcmtsb2FkLm9wZW5zaGlmdC5pbyIKcmVzb3VyY2VzID0geyAiY3B1c2hhcmVzIiA9IDAsICJjcHVzZXQiID0gIjAtMSwxNi0xNyIgfQoK
        mode: 420
        overwrite: true
        path: /etc/crio/crio.conf.d/01-workload-partitioning
        user:
          name: root
      - contents:
          source: data:text/plain;charset=utf-8;base64,ewogICJtYW5hZ2VtZW50IjogewogICAgImNwdXNldCI6ICIwLTEsMTYtMTciCiAgfQp9Cg==
        mode: 420
        overwrite: true
        path: /etc/kubernetes/openshift-workload-pinning
        user:
          name: root
Create an OpenShift Performance Profile
The Openshift Performance Profile provides the ability to enable advanced node performance tunings for low latency workloads.
This YAML snippet creates an OpenShift Performance Profile:
apiVersion: performance.openshift.io/v2
kind: PerformanceProfile
metadata:
  name: performance-worker-pao-sno
spec:
  additionalKernelArgs:
  - nohz_full=2-15,18-31
  - idle=poll
  - rcu_nocb_poll
  - nmi_watchdog=0
  - audit=0
  - mce=off
  - processor.max_cstate=1
  - intel_idle.max_cstate=0
  - rcutree.kthread_prio=11
  - rcupdate.rcu_normal_after_boot=0
  cpu:
    isolated: "2-15,18-31"
    reserved: "0-1,16-17"
  globallyDisableIrqLoadBalancing: true
  net:
    userLevelNetworking: true
  hugepages:
    defaultHugepagesSize: "1G"
    pages:
    - size: "1G"
      count: 20
  realTimeKernel:
    enabled: true
  numa:
    topologyPolicy: "single-numa-node"
  nodeSelector:
    node-role.kubernetes.io/master: ""
In the first part of this article, we described kernel parameters indirectly applied by the performance profile to configure a Single Node OpenShift cluster as an "ultra-low-latency" node. Here's a list describing the effect of using each of these additional parameters from a performance perspective.
- nohz_full=2-15,18-31: Reduces the number of scheduling-clock interrupts for the workload processor. nohz_full specifies "adaptive-ticks CPUs", that is, omit scheduling-clock ticks for CPUs with only one runnable task, ideal for low latency workloads.
- idle=poll: Polling mechanism to favor performance and avoid the processor idle states. When "idle=poll" is used, it instructs the kernel to avoid using the native low-power CPU idle states (e.g., C-states) and instead, use a polling mechanism to check for workloads, with the cost of reduced energy efficiency.
- rcu_nocb_poll: Periodically checks for pending Read-Copy (RCU) callbacks to avoid RCU stalls. This offloads RCU callback processing to "rcuo" threads and allows idle CPUs to enter "adaptive-tick" mode. When using rcu_nocb_poll, the RCU offload threads will be periodically raised by a timer to check if there are callbacks to run. In this case, the RCU offload threads are raised more often than when not using rcu_nocb_poll, so the drawback of this option is that it degrades energy efficiency and may increase the system's load.
nmi_watchdog=0:Disables lockups that cause the processor to loop in kernel mode.audit=0:Disables event tracking from system information.mce=off:Disables machine check exception that detects hardware problems by ignoring corrected errors and associated scans that can cause periodic latency spikes.processor.max_cstate=1:Prevents processor from changing idle power states.intel_idle.max_cstate=0:Disables the intel_pstate driver to get a stable processor frequency.rcutree.kthread_prio=11:Sets Read-Copy (RCU) thread priority to run after critical workloads and before general tasks.rcupdate.rcu_normal_after_boot=0:Disables normal Read-Copy Update (RCU) processing after boot by delaying the RCU grace periods, when memory is safely reclaimed by the kernel.
Depending on your OpenShift version, most of these additional kernel parameters are automatically applied, so you may not need to add them. If you're unsure what to include, start with idle=poll and nohz_full=<cpus> and look at /proc/cmdline after applying the performance profile. Refer to the OpenShift documentation online for more information.
Tuned
The extended tuned (the tuning daemon) profile configures additional node-level tuning through tuned daemon, such as kernel settings, CPU, and scheduler parameters.
This YAML snippet creates an OpenShift Tuned Profile:
apiVersion: tuned.openshift.io/v1
kind: Tuned
metadata:
  name: performance-patch
  namespace: openshift-cluster-node-tuning-operator
spec:
  profile:
  - data: |
      [main]
      summary=Configuration changes profile inherited from performance created tuned
      include=openshift-node-performance-performance-worker-pao-sno
      [bootloader]
      cmdline_crash=nohz_full=2-15,18-31
      [sysctl]
      kernel.timer_migration=1
      [service]
        service.stalld=start,enable
        service.chronyd=stop,disable
    name: performance-patch
  recommend:
  - machineConfigLabels:
      machineconfiguration.openshift.io/role: master
    priority: 19
    profile: performance-patch
A brief description of each parameter:
|
| Enables migration of timers to prevent timers from IRQ context to get stuck on the CPUs that they were initialized. |
|
| Enables stalld to ensure critical kernel threads get the CPU time needed, if a user-thread happens to be assigned a higher RT (rr, fifo) priority. |
| Disables chronyd service, which is used to adjust the system clock that runs in the kernel to synchronize with the NTP clock server. This eliminates any eventual interruptions caused by the service. |
Table: Description of tuned parameters
CPUManagerPolicy
Confirm that cpuManagerPolicy is set as “static” to allow pods with certain resource characteristics to be granted increased CPU affinity and exclusivity on the node. This is standard configuration for guaranteed pods. As YAML, the setting is:
apiVersion: machineconfiguration.openshift.io/v1
kind: KubeletConfig
metadata:
  name: cpumanager-enabled
spec:
  machineConfigPoolSelector:
    matchLabels:
      custom-kubelet: cpumanager-enabled
  kubeletConfig:
     cpuManagerPolicy: static
     cpuManagerReconcilePeriod: 5s
Monitoring footprint
Mitigate interference from the Openshift Monitoring Operator components by reducing the monitoring footprint. In YAML:
apiVersion: v1
kind: ConfigMap
metadata:
  name: cluster-monitoring-config
  namespace: openshift-monitoring
data:
  config.yaml: |
    grafana:
      enabled: false
    alertmanagerMain:
      enabled: false
    prometheusK8s:
       retention: 24h
Network diagnostics
Reduce the noise and interference in the SNO cluster by disabling the OpenShift network diagnostics component. As YAML:
apiVersion: operator.openshift.io/v1
kind: Network
metadata:
  name: cluster
spec:
  disableNetworkDiagnostics: true
Console Operator
By default, the console operator installs the web console on the SNO cluster. This web console can be disabled to avoid unnecessary overhead. In YAML:
apiVersion: operator.openshift.io/v1
kind: Console
metadata:
  annotations:
    include.release.openshift.io/ibm-cloud-managed: "false"
    include.release.openshift.io/self-managed-high-availability: "false"
    include.release.openshift.io/single-node-developer: "false"
    release.openshift.io/create-only: "true"
  name: cluster
spec:
  logLevel: Normal
  managementState: Removed
  operatorLogLevel: Normal
Kubelet housekeeping CPUs
The following configuration reduces the kubelet’s housekeeping CPUs usage:
apiVersion: machineconfiguration.openshift.io/v1
kind: MachineConfig
metadata:
  name: container-mount-namespace-and-kubelet-conf
  labels:
    machineconfiguration.openshift.io/role: master
spec:
  config:
    ignition:
      version: 3.1.0
    storage:
      files:
      - path: /usr/local/bin/extractExecStart
        filesystem: root
        mode: 493
        contents:
          source: data:text/plain;charset=utf8;base64,IyEvYmluL2Jhc2gKCmRlYnVnKCkgewogIGVjaG8gJEAgPiYyCn0KCnVzYWdlKCkgewogIGVjaG8gVXNhZ2U6ICQoYmFzZW5hbWUgJDApIFVOSVQgW2VudmZpbGUgW3Zhcm5hbWVdXQogIGVjaG8KICBlY2hvIEV4dHJhY3QgdGhlIGNvbnRlbnRzIG9mIHRoZSBmaXJzdCBFeGVjU3RhcnQgc3RhbnphIGZyb20gdGhlIGdpdmVuIHN5c3RlbWQgdW5pdCBhbmQgcmV0dXJuIGl0IHRvIHN0ZG91dAogIGVjaG8KICBlY2hvICJJZiAnZW52ZmlsZScgaXMgcHJvdmlkZWQsIHB1dCBpdCBpbiB0aGVyZSBpbnN0ZWFkLCBhcyBhbiBlbnZpcm9ubWVudCB2YXJpYWJsZSBuYW1lZCAndmFybmFtZSciCiAgZWNobyAiRGVmYXVsdCAndmFybmFtZScgaXMgRVhFQ1NUQVJUIGlmIG5vdCBzcGVjaWZpZWQiCiAgZXhpdCAxCn0KClVOSVQ9JDEKRU5WRklMRT0kMgpWQVJOQU1FPSQzCmlmIFtbIC16ICRVTklUIHx8ICRVTklUID09ICItLWhlbHAiIHx8ICRVTklUID09ICItaCIgXV07IHRoZW4KICB1c2FnZQpmaQpkZWJ1ZyAiRXh0cmFjdGluZyBFeGVjU3RhcnQgZnJvbSAkVU5JVCIKRklMRT0kKHN5c3RlbWN0bCBjYXQgJFVOSVQgfCBoZWFkIC1uIDEpCkZJTEU9JHtGSUxFI1wjIH0KaWYgW1sgISAtZiAkRklMRSBdXTsgdGhlbgogIGRlYnVnICJGYWlsZWQgdG8gZmluZCByb290IGZpbGUgZm9yIHVuaXQgJFVOSVQgKCRGSUxFKSIKICBleGl0CmZpCmRlYnVnICJTZXJ2aWNlIGRlZmluaXRpb24gaXMgaW4gJEZJTEUiCkVYRUNTVEFSVD0kKHNlZCAtbiAtZSAnL15FeGVjU3RhcnQ9LipcXCQvLC9bXlxcXSQvIHsgcy9eRXhlY1N0YXJ0PS8vOyBwIH0nIC1lICcvXkV4ZWNTdGFydD0uKlteXFxdJC8geyBzL15FeGVjU3RhcnQ9Ly87IHAgfScgJEZJTEUpCgppZiBbWyAkRU5WRklMRSBdXTsgdGhlbgogIFZBUk5BTUU9JHtWQVJOQU1FOi1FWEVDU1RBUlR9CiAgZWNobyAiJHtWQVJOQU1FfT0ke0VYRUNTVEFSVH0iID4gJEVOVkZJTEUKZWxzZQogIGVjaG8gJEVYRUNTVEFSVApmaQo=
      - path: /usr/local/bin/nsenterCmns
        filesystem: root
        mode: 493
        contents:
          source: data:text/plain;charset=utf8;base64,IyEvYmluL2Jhc2gKbnNlbnRlciAtLW1vdW50PS9ydW4vY29udGFpbmVyLW1vdW50LW5hbWVzcGFjZS9tbnQgIiRAIgo=
    systemd:
      units:
      - name: container-mount-namespace.service
        enabled: true
        contents: |
          [Unit]
          Description=Manages a mount namespace that both kubelet and crio can use to share their container-specific mounts
          [Service]
          Type=oneshot
          RemainAfterExit=yes
          RuntimeDirectory=container-mount-namespace
          Environment=RUNTIME_DIRECTORY=%t/container-mount-namespace
          Environment=BIND_POINT=%t/container-mount-namespace/mnt
          ExecStartPre=bash -c "findmnt ${RUNTIME_DIRECTORY} || mount --make-unbindable --bind ${RUNTIME_DIRECTORY} ${RUNTIME_DIRECTORY}"
          ExecStartPre=touch ${BIND_POINT}
          ExecStart=unshare --mount=${BIND_POINT} --propagation slave mount --make-rshared /
          ExecStop=umount -R ${RUNTIME_DIRECTORY}
      - name: crio.service
        dropins:
        - name: 20-container-mount-namespace.conf
          contents: |
            [Unit]
            Wants=container-mount-namespace.service
            After=container-mount-namespace.service
            [Service]
            ExecStartPre=/usr/local/bin/extractExecStart %n /%t/%N-execstart.env ORIG_EXECSTART
            EnvironmentFile=-/%t/%N-execstart.env
            ExecStart=
            ExecStart=bash -c "nsenter --mount=%t/container-mount-namespace/mnt \
                ${ORIG_EXECSTART}"
      - name: kubelet.service
        dropins:
        - name: 20-container-mount-namespace.conf
          contents: |
            [Unit]
            Wants=container-mount-namespace.service
            After=container-mount-namespace.service
            [Service]
            ExecStartPre=/usr/local/bin/extractExecStart %n /%t/%N-execstart.env ORIG_EXECSTART
            EnvironmentFile=-/%t/%N-execstart.env
            ExecStart=
            ExecStart=bash -c "nsenter --mount=%t/container-mount-namespace/mnt \
                ${ORIG_EXECSTART} --housekeeping-interval=30s"
        # The kubelet service config is included with the container
        # mount namespace because the override of the ExecStart for
        # kubelet can only be done once (cannot accumulate changes
        # across multiple drop-ins).
        # Defaults:
        #  Max Housekeeping : 15s
        #  Housekeeping : 10s
        #  Eviction : 10s
        - name: 30-kubelet-interval-tuning.conf
          contents: |
            [Service]
            Environment="OPENSHIFT_MAX_HOUSEKEEPING_INTERVAL_DURATION=60s"
            Environment="OPENSHIFT_EVICTION_MONITORING_PERIOD_DURATION=30s"
Runtime configuration
You can tune your cluster during runtime, as well.
Pod annotations
To achieve low latency for workloads, use these pod annotations:
cpu-quota.crio.ioremoves CPU throttling for individual guaranteed podscpu-load-balancing.crio.iodisables CPU load balancing for the pod
annotations:
       cpu-quota.crio.io: disable
       cpu-load-balancing.crio.io: disable
You may include irq-load-balancing.crio.io: "disable" to disable device interrupts processing for individual Pods if you don't have globallyDisableIrqLoadBalancing: true in the Performance Profile.
By disabling CPU quota, you prevent CPU throttling issues that cause latency spikes. To see whether CPU quota has been disabled:
# cat /sys/fs/cgroup/cpu,cpuacct/cpu.cfs_period_us /sys/fs/cgroup/cpu,cpuacct/cpu.cfs_quota_us
100000
-1
# cat /sys/fs/cgroup/cpu,cpuacct/cpu.stat
nr_periods 1
nr_throttled 0
throttled_time 0
On the other hand, if CPU quota is NOT disabled, you see something like this:
# cat /sys/fs/cgroup/cpu,cpuacct/cpu.cfs_burst_us /sys/fs/cgroup/cpu,cpuacct/cpu.cfs_period_us /sys/fs/cgroup/cpu,cpuacct/cpu.cfs_quota_us
0
100000
1200000
# cat /sys/fs/cgroup/cpu,cpuacct/cpu.stat
nr_periods 3430
nr_throttled 0
Pod Resources
For a Pod to be given a QoS class of Guaranteed, every Container in the Pod must have a memory limit and a memory request. For every Container in the Pod, the memory limit must equal the memory request. Similarly, every Container in the Pod must have a CPU limit and a CPU request, with both limit and request values being integers and exactly the same.
resources:
     requests:
        cpu: 14
        memory: 1000Mi
        hugepages-1Gi: 12Gi
     limits:
        cpu: 14
        memory: 1000Mi
        hugepages-1Gi: 12Gi
The hugepages allocation is user and application dependent, and must match the amount pre-allocated by the Performance Profile. Refer to the online documentation for more details.
Scheduling priority
In general, a task may need to be run ahead of all the SCHED_OTHER tasks. While you can set priority to SCHED_FIFO:1 to prioritize a task, there's often a lot of competition at that level. For this reason, running a real time application at SCHED_FIFO:2 is a better choice. To set SCHED_FIFO:2 for testpmd worker threads, you can use the following Bash snippet:
pid=$( pgrep dpdk-testpmd )
for tpid in $(ps -T -p $pid | grep "worker" | awk '{ print $2 }'); do
    chrt -f -p 2 $tpid
done
In the example above, we get the testpmd worker's PID and set the priority as soon as the application starts. This can be applied to any low latency workload running inside a pod.
zero-loss latency
In this section, we break down the metric zero-loss latency to understand what we are measuring in our tests. In the first part of this article, we discussed the meaning of the latency metric. A gross definition of latency is the Round Trip Time (RTT), the time between transmitting a packet and receiving it back. Latency is just one of the key performance indicators measured by the industry-standard RFC2544 test, which also includes throughput, jitter, frame loss, and more.
The other part of the metric is zero-loss, or zero frame loss. The term zero-loss comes from the ability to transmit without losing or dropping any single packet (frame).
By merging these two performance indicators, latency and frame-loss, we compose a crucial requirement for low latency workloads to reduce congestion and network degradation: zero-loss latency.
Test methodology
The industry standard RFC 2544, or an adaptation of it, has been used as a benchmarking methodology for latency tests. RFC (Request For Comment) 2544, is a benchmarking methodology originally developed in 1999 for testing and measuring performance of network devices. The document was created by the Internet Engineering Task Force (IETF), providing a standardized set of procedures with a common language for comparing devices from different vendors. The legacy use of these guidelines created a set of common practices, still in use today, to evaluate networking real world scenarios.
By providing consistent performance results, RFC 2544 defines a set of criteria for the tests, including duration and measurements. For example, the document specifies the frame sizes, how to calculate frame loss or latency, and so on. As outlined in RFC 2544, a latency measurement is taken at the midpoint of the test iteration's time. This particular test needs to be replicated 20 times, covering each of the 7 frame sizes specified in RFC 2544. Given that each iteration spans 2 minutes, the latency test time would take more than 4 hours.
To emulate a more realistic scenario for low latency workloads, the methodology applied is an adapted version of RFC 2544, preserving its core characteristics, as follows:
- Use test equipment with both transmitting and receiving ports (bi-directional transmission).
- Traffic is sent from the tester to the Device Under Test (DUT) and then from the DUT back to the tester (loopback connection).
- By including sequence numbers in the frames it transmits, the tester can check that all packets were successfully transmitted and verify that the correct packets were also received back.
The benchmarking methodology applied includes the following:
- Latency is the round-trip time (RTT) that UDP 76-byte packets are transmitted from the tester (traffic generator) to the DUT at a rate of approximately 10k pps (ten thousand packets per second).
- The latency is measured by a network adapter with hardware timestamping capability to eliminate software delays.
- The latency packet "in flight" is the only one that exists at a time. That is, the tester only sends the next packet when the previous one arrives.
- The test should run for at least 8 hours in order to confirm consistent and reproducible results.
- Latencies measured include minimum, maximum, mean, and median values.
- The maximum (worst-case) round-trip latency is taken into account for the results to meet the requirements.
- While the latency packets are being measured at a rate of approximately 10 kpps, additional traffic with generic UDP 64-byte packets at a rate of 20 Mpps are transmitted.
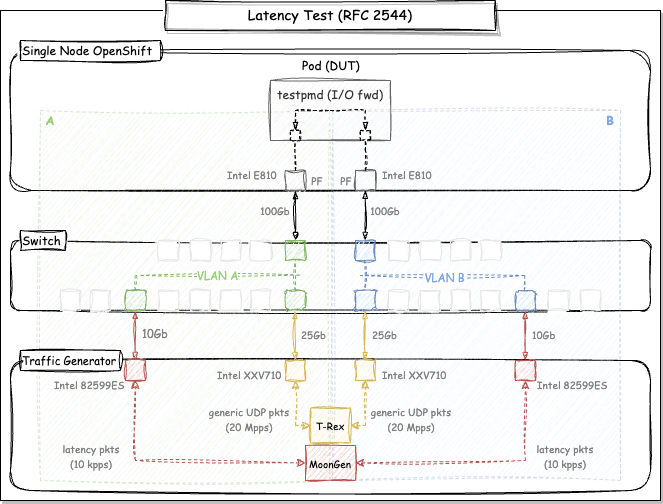
In the first part of this article, we presented a diagram of the latency test based on RFC 2544. For those initial experiments, we were testing latency without additional traffic. This demonstrates an interesting performance indicator that measures the round-trip time of a single "in-flight" packet. However, a more realistic scenario would include additional traffic for measuring latency. For this reason, we started the second stage of the latency tests, by adding T-Rex, a traffic generator that transmits at a fixed rate while latency is measured.
An updated version of the diagram is shown below:

Diagram: DPDK latency test based on RFC 2544 standard
By applying this methodology, we can measure the latency at a fixed rate without packet loss, which is the requirement for 5G applications and real time workloads. At the end of the day, these tests help us answer the following question: "What is the zero-loss latency in a Single Node OpenShift cluster with a traffic rate of 20 Mpps? That's what we'll explore in the results section.
Results
RFC2544 defines the latency tests performed in this article as "out-of-service". That is, the tests necessitate the interruption of actual network traffic so that the tester can generate traffic with predefined characteristics. In the first article, we generated only latency packets at approximately 10 kpps with MoonGen and demonstrated a maximum latency of 12 µs. Then, as we started to test a more realistic scenario by simultaneously transmitting on single queue at a fixed rate of 20 Mpps with T-Rex traffic generator, we observed that the maximum latency is sustained for a couple hours. However, a few spikes are seen up to 17 µs on longer runs. That's the maximum latency, or the worst latency score of this article.
Direction | Minimum | Median | Maximum | 99.9th Percentile |
Forward A→B | 2.1 µs | 8.7 µs | 17.1 µs | 12.0 µs |
Reverse A←B | 2.5 µs | 8.6 µs | 17.9 µs | 12.3 µs |
Table: Zero packet loss latency results at a rate of 20 Mpps on single queue (1Q)
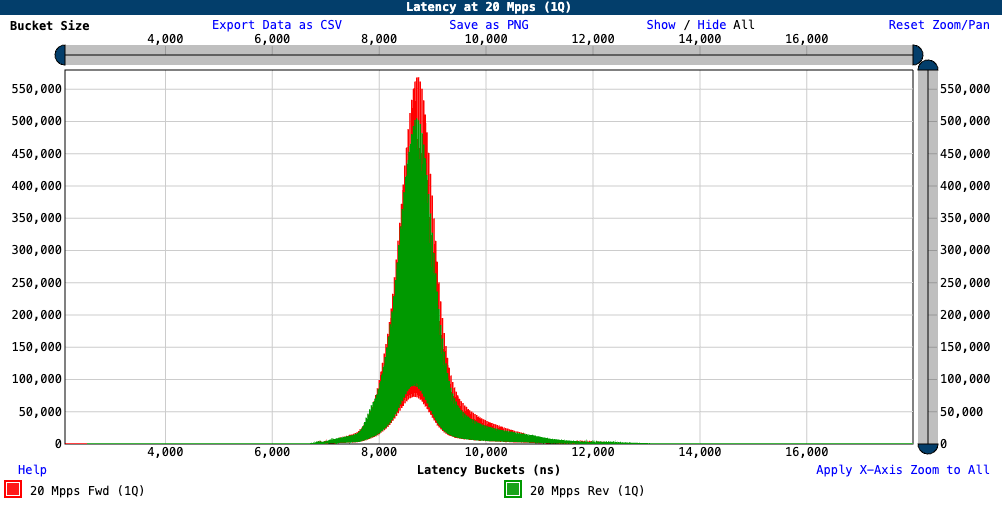
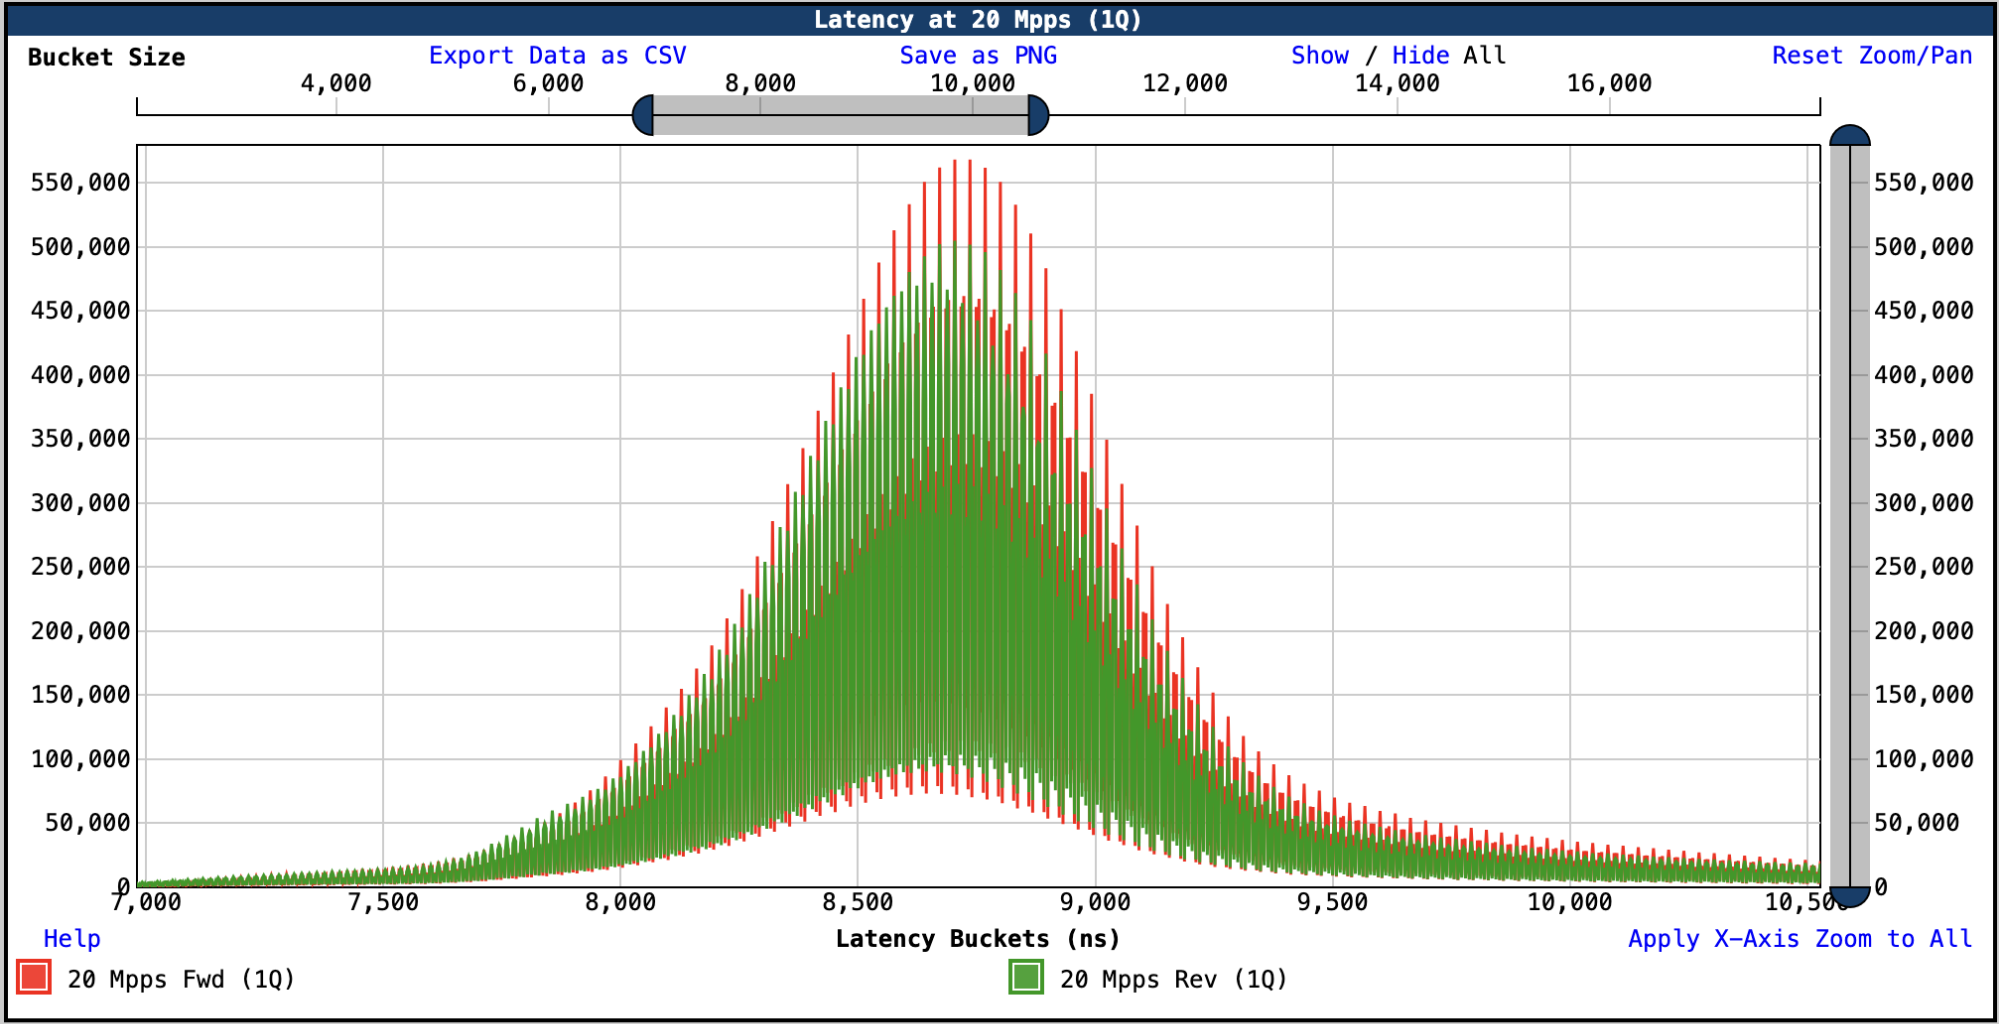
From the plotted chart for these samples, you see a curve that looks like normal distribution. At the peak of the curve is the median latency, more than 550 thousand samples.

Chart: zero-loss Latency at 20 Mpps bi-directional (1Q)
This test ran for 8 hours and produced more than 138 millions of samples on each of the ports. Only 17 samples from a total of 276 millions are above the 15 µs threshold. The percentiles help us understand these outliers: while the 95th percentile is at 10 µs, 99.99th percentile corresponds to the mark of 12.9 µs.
Here are the forward statistics (forward and reverse percentiles) collected by testpmd:
---------------------- Forward statistics for port 0  ----------------------
  RX-packets: 138219023      RX-dropped: 0             RX-total: 138219023
  TX-packets: 138219023      TX-dropped: 0             TX-total: 138219023
  RX-bursts : 774845904 [82% of 0 pkts + 18% of 1 pkts]
  TX-bursts : 138219023 [0% of 0 pkts + 100% of 1 pkts]
  ----------------------------------------------------------------------------

  ---------------------- Forward statistics for port 1  ----------------------
  RX-packets: 138219023      RX-dropped: 0             RX-total: 138219023
  TX-packets: 138219023      TX-dropped: 0             TX-total: 138219023
  RX-bursts : 638913754 [78% of 0 pkts + 22% of 1 pkts]
  TX-bursts : 138219023 [0% of 0 pkts + 100% of 1 pkts]
  ----------------------------------------------------------------------------

  +++++++++++++++ Accumulated forward statistics for all ports+++++++++++++++
  RX-packets: 276438046      RX-dropped: 0             RX-total: 276438046
  TX-packets: 276438046      TX-dropped: 0             TX-total: 276438046
  ++++++++++++++++++++++++++++++++++++++++++++++++++++++++++++++++++++++++++++

  CPU cycles/packet=602.98 (busy cycles=166686911072 / total io packets=276438046) at 2300 MHz Clock
For a better visualization of the curve, a zoomed chart at the median latency is shown below:

Chart: zero-loss Latency at 20 Mpps bi-directional (1Q) - zoom at median latency
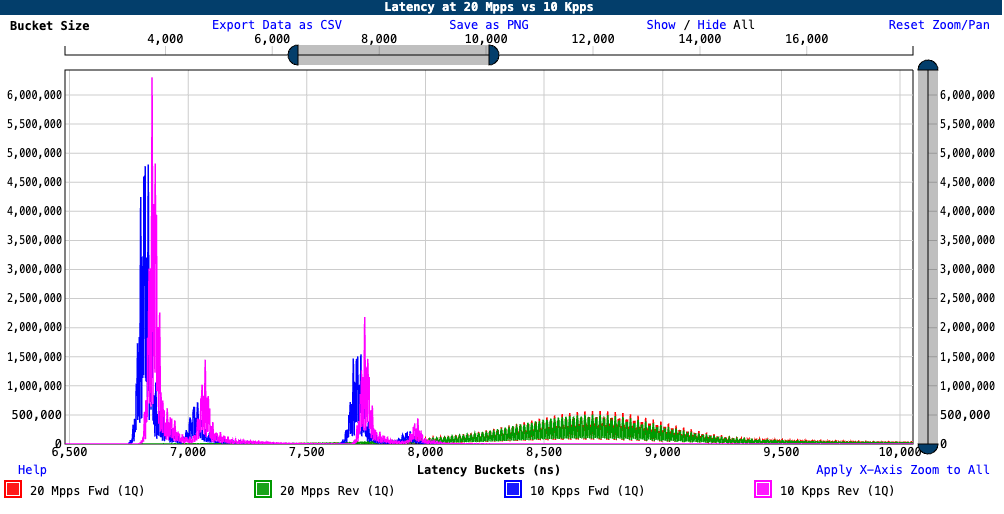
Finally, we show a comparison chart between latency packets only (10 Kpps) and the bulk traffic (20 Mpps):

Chart: zero-loss Latency at 20 Mpps vs 10 Kpps bi-directional (1Q) - zoom at median latency
Conclusions and insights
This is the second in a series of articles about DPDK low latency in Openshift. In this article, we covered the ultra-low-latency tuning settings in OpenShift and their performance impacts from a system-level perspective. We ran performance tests at a fixed rate to measure the zero-loss latency handling packets on a single queue.
From the test experiments we've done so far, we were able to demonstrate that it is possible to meet the performance requirements for the real time workloads and 5G applications. The ultra-low-latency tuning in OpenShift enables reliable and responsive applications to run with a reaction time of less than 20 µs (worst latency measured was 17.9 µs).
The results indicate that we can safely transmit packets at 20 Mpps rate without dropping a single packet. Most importantly, we achieve an extremely low latency required by applications requiring a super fast response time from the platform. More than 99.99% of the samples are below 12.9 µs and sustained for at least 8 hours of testing.
Although there are some areas for potential improvement, achieving a maximum latency of 12 µs at 10 kpps and a maximum zero-loss latency of 17 µs with 20 Mpps of background traffic are incredibly low numbers that are key for the success of modern applications. In order to reduce these latency numbers, you may want to explore additional hardware tuning, multi-queue, RSS hash functions, and flow director rules. Descriptor sizing, transmission mode (scalar or vector) and memory tuning are also possible factors to consider.
執筆者紹介
Rafael Folco is a member of the Performance and Scale Engineering Team.
Member of Red Hat Performance & Scale Engineering since 2015.
Andrew Theurer has worked for Red Hat since 2014 and been involved in Linux Performance since 2001.
類似検索
Red Hat Enterprise Linux now supported for Microsoft SQL Server on Azure VMs with SQL IaaS Agent extension
Red Hat Enterprise Linux is ready for AWS M9g instances, powered by Graviton5
A vested interest in 5G | Technically Speaking
Kubernetes and the quest for a control plane | Technically Speaking
チャンネル別に見る
自動化
テクノロジー、チームおよび環境に関する IT 自動化の最新情報
AI (人工知能)
お客様が AI ワークロードをどこでも自由に実行することを可能にするプラットフォームについてのアップデート
オープン・ハイブリッドクラウド
ハイブリッドクラウドで柔軟に未来を築く方法をご確認ください。
セキュリティ
環境やテクノロジー全体に及ぶリスクを軽減する方法に関する最新情報
エッジコンピューティング
エッジでの運用を単純化するプラットフォームのアップデート
インフラストラクチャ
世界有数のエンタープライズ向け Linux プラットフォームの最新情報
アプリケーション
アプリケーションの最も困難な課題に対する Red Hat ソリューションの詳細
仮想化
オンプレミスまたは複数クラウドでのワークロードに対応するエンタープライズ仮想化の将来についてご覧ください

