
![]()
In OCP, efficient packet delivery is crucial for maintaining smooth communication between applications. However, packets might occasionally get dropped due to various factors, such as network congestion, misconfigured systems, or hardware limitations. Detecting and diagnosing these packet drops is essential for optimizing network performance and maintaining a high quality of service. This situation is where eBPF (extended Berkeley Packet Filter) comes into play as a powerful real-time network performance analysis tool. This blog looks at how Network Observability using eBPF can help detect and understand packet drops, enabling network administrators and engineers to address network issues proactively.
Detecting packet drops with eBPF
eBPF enables developers to set up tracepoints at key locations within the network stack. These tracepoints can help intercept packets at specific events, such as when they are received, forwarded, or transmitted. By analyzing the events around packet drops, you can gain insight into the reasons behind them. Network Observability uses the tracepoint/skb/kfree_skb tracepoint hook to detect when packets are dropped, determine why packets drop, and reconstruct the flow by enriching it with drop metadata such as packets and bytes statistics. For TCP, only the latest TCP connection state and the TCP connection flags are added. The packet drops eBPF hook supports the TCP, UDP, SCTP, ICMPv4, and ICMPv6 protocols. There are two main categories for packet drops. The first category, core subsystem drops, covers most host drop reasons; for the complete list, please refer to drop-reason. Second, there are OVS-based drops, a recent kernel enhancement. For reference, please check out the following link OVS-drop-reason.
Kernel support
The drop cause tracepoint API is a recent kernel feature only available from the RHEL 9.2 kernel and later. Older kernels will ignore this feature if it is configured.
How to enable packet drops
By default, packet drops detection is disabled because it requires privileged access to the host kernel. To enable the feature, create a FlowCollector object with the following fields enabled in the eBPF config section:
apiVersion: flows.netobserv.io/v1beta1
kind: FlowCollector
metadata:
  name: cluster
spec:
  agent:
    type: EBPF
    ebpf:
      privileged: true
      features:
        - PacketDrop
A quick tour of the UI
Once you enable the PacketDrop feature, the OCP console plugin automatically adapts to provide additional filters and show information across Netflow Traffic page views.
Open the OCP Console and move to the Administrator view -> Observe -> Network Traffic page.
A new query option is now available to filter flows by their drop status:
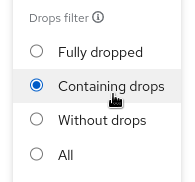
- Fully dropped shows the flows that have 100% dropped packets.
- Containing drops shows the flows having at least one packet dropped.
- Without drops shows the flows having 0% dropped packets.
- All shows all of the above.
Two new filters, Packet drop TCP state and Packet drop latest cause, are available in the common section:
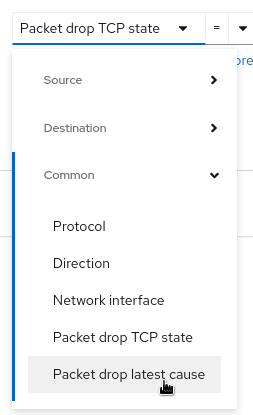
The first one allows you to set the TCP state filter:
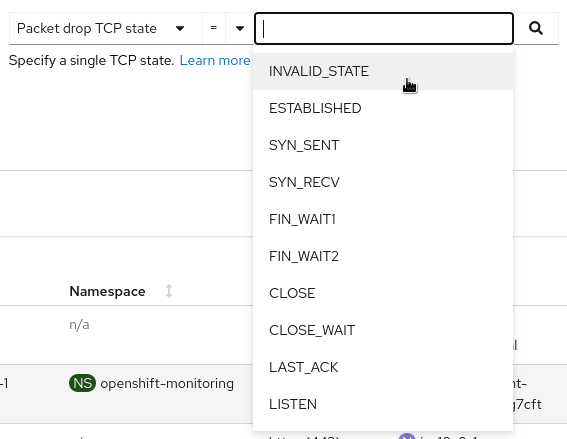
- A _LINUX_TCP_STATES_H number like 1, 2, 3
- A _LINUX_TCP_STATES_H TCP name like ESTABLISHED, SYN_SENT, SYN_RECV
The second one lets you pick causes to filter on:
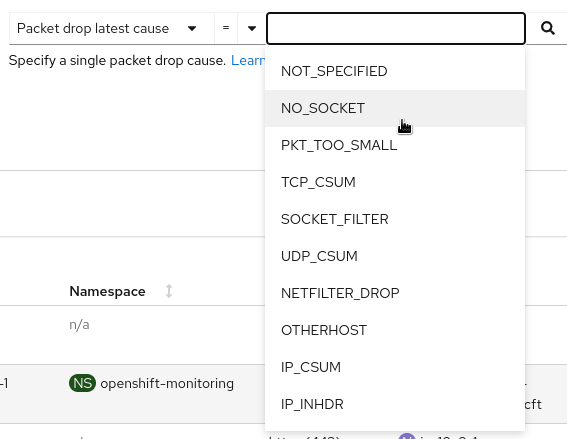
- A _LINUX_DROPREASON_CORE_H number like 2, 3, 4
- A _LINUX_DROPREASON_CORE_H SKB_DROP_REASON name like NOT_SPECIFIED, NO_SOCKET, PKT_TOO_SMALL
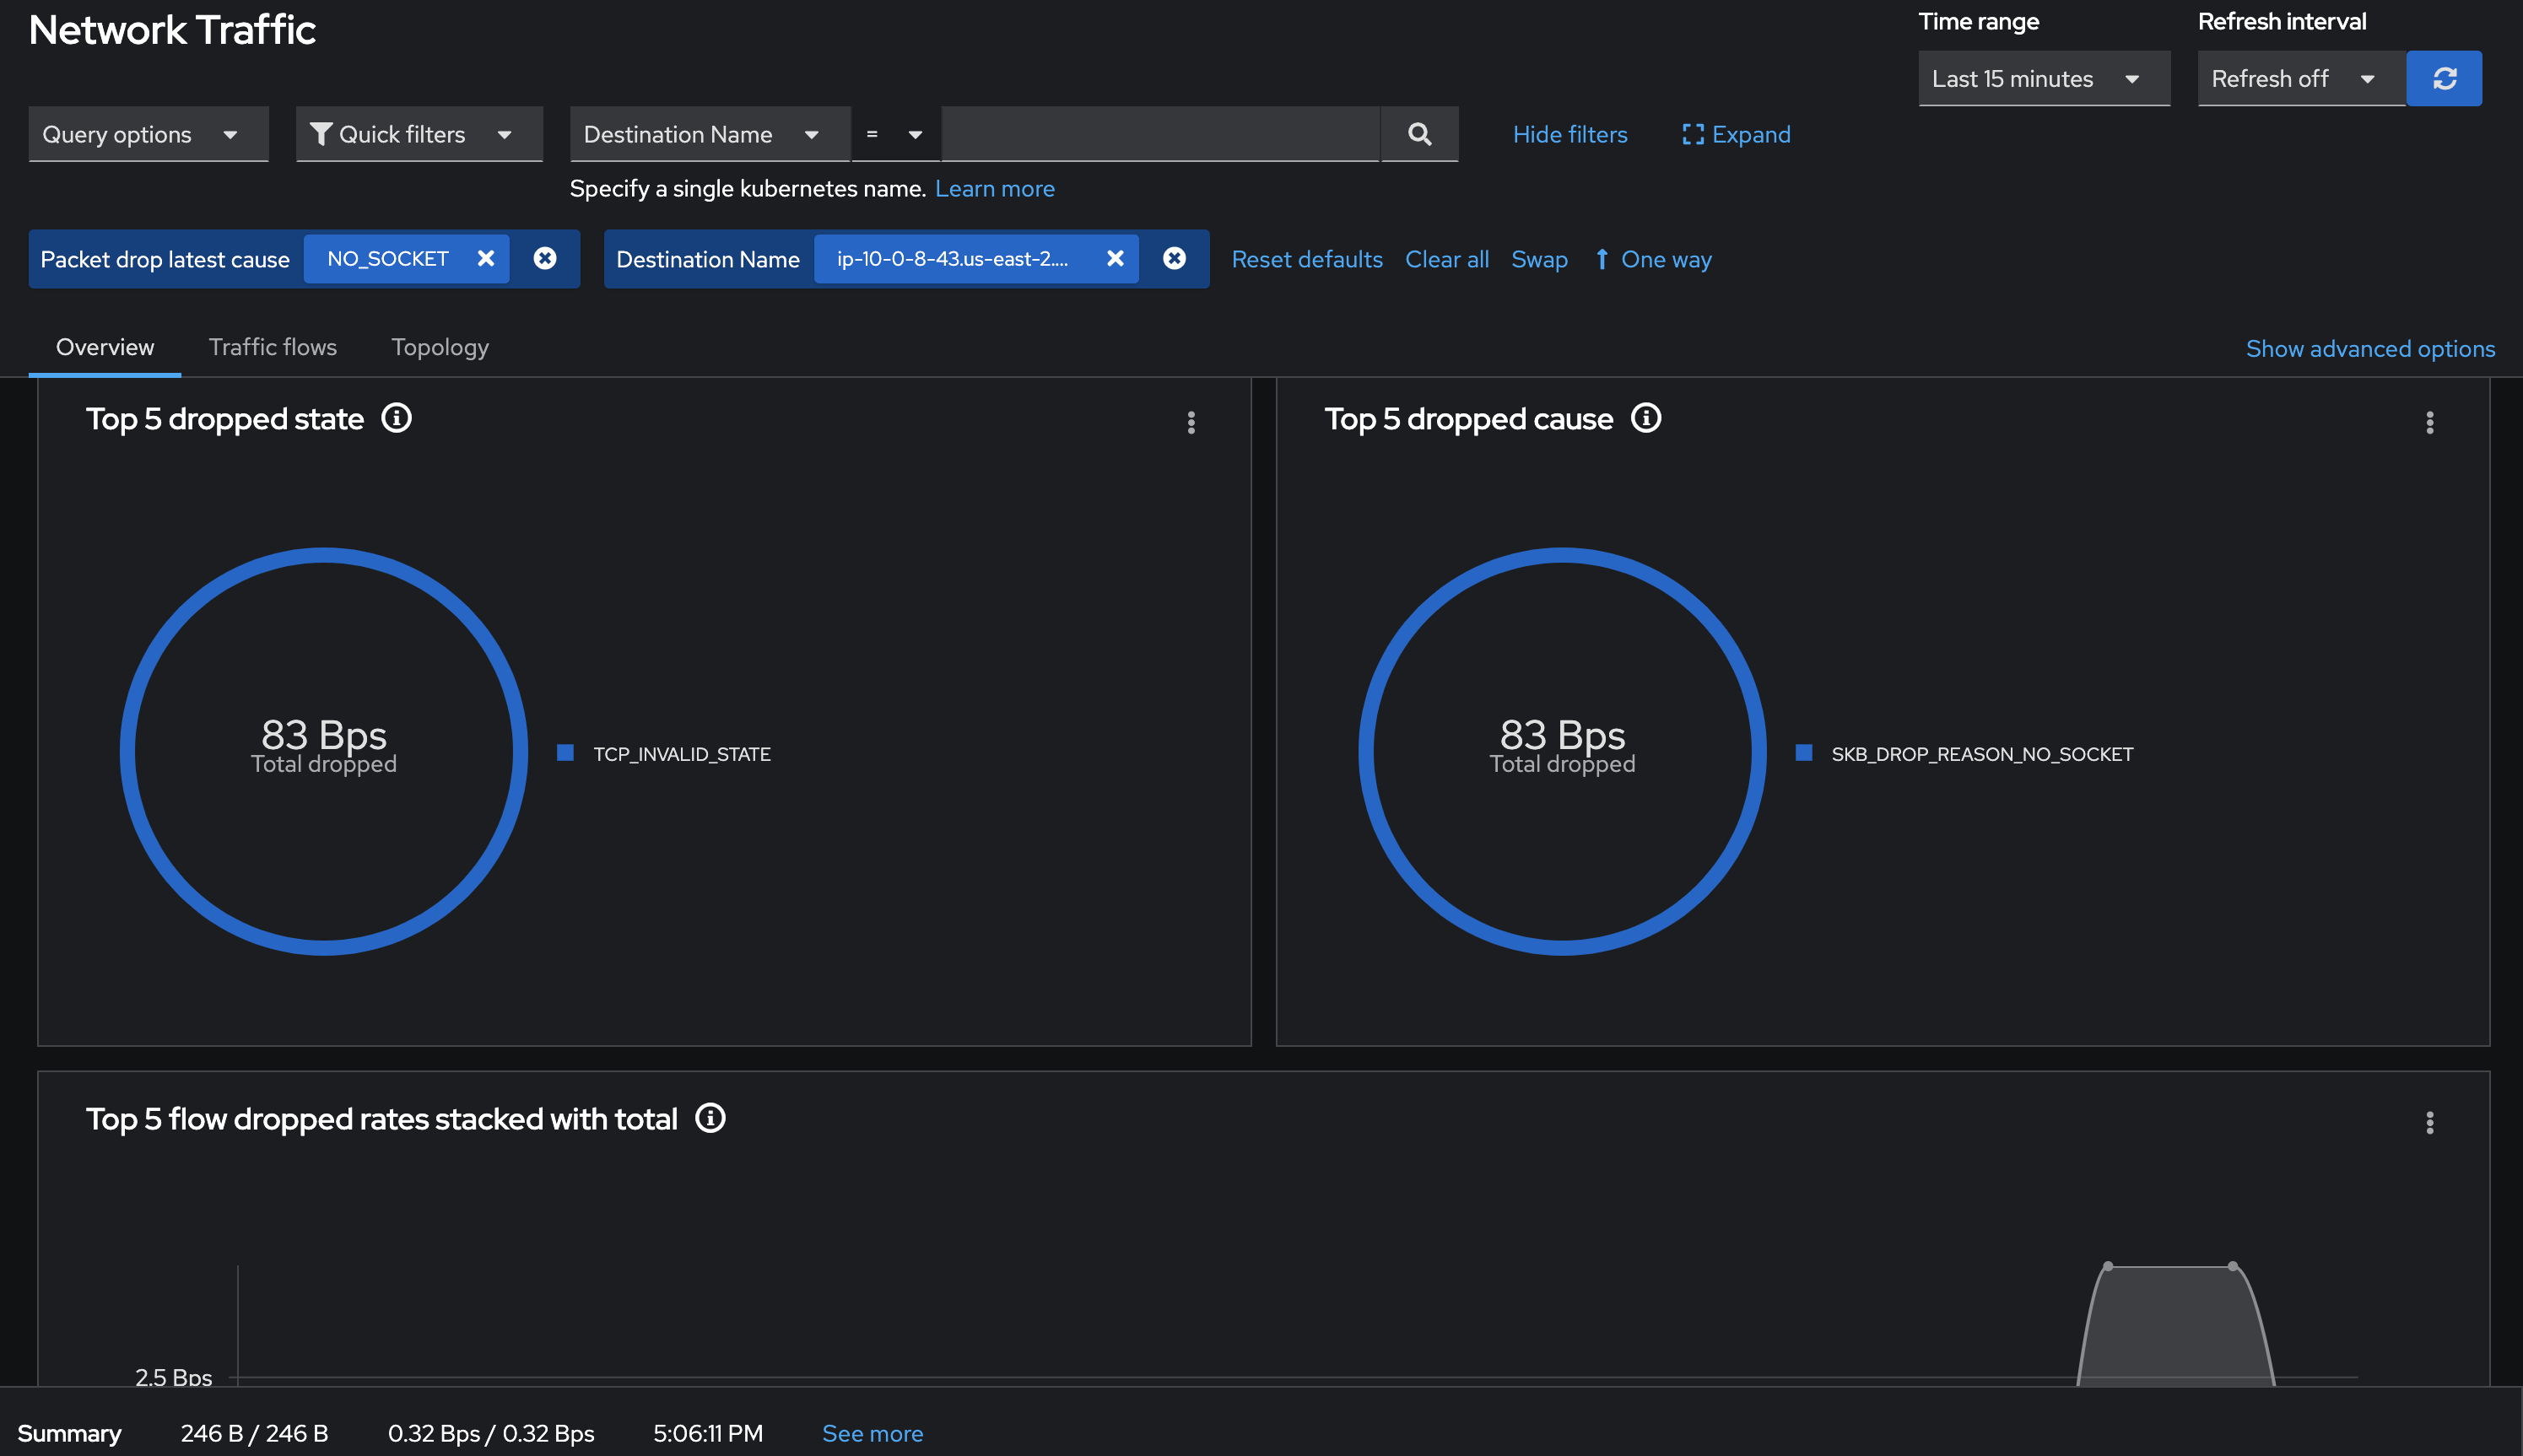
Overview
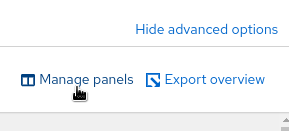
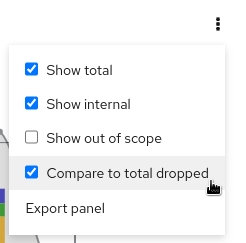
New graphs are introduced in the advanced options -> manage panels popup:
- Top X flow dropped rates stacked
- Total dropped rate
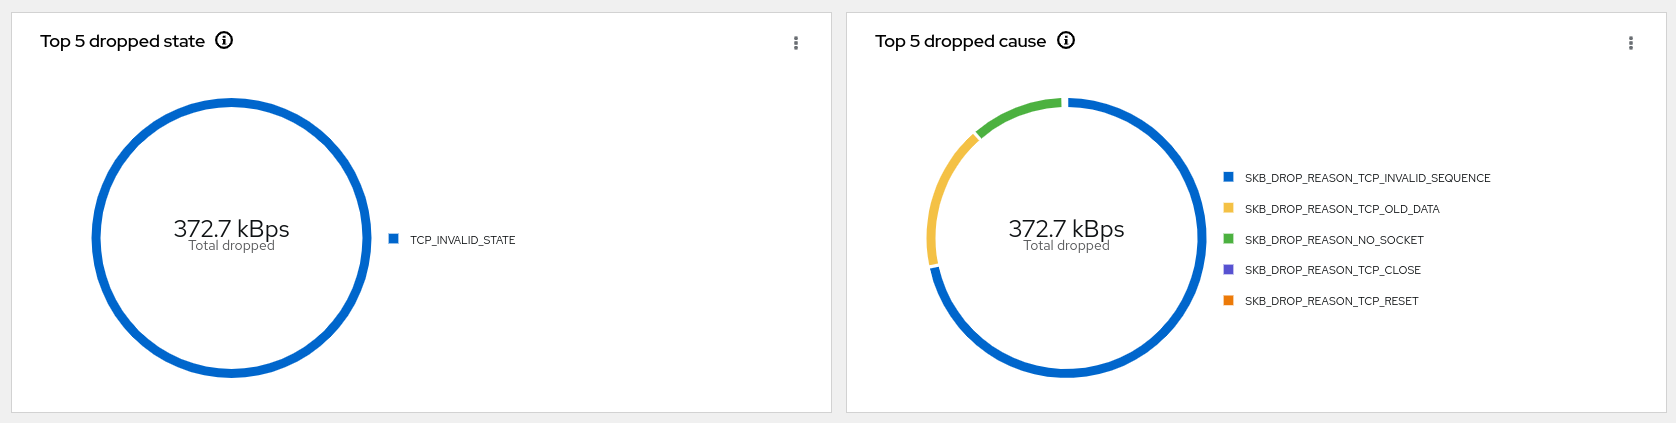
- Top X dropped state
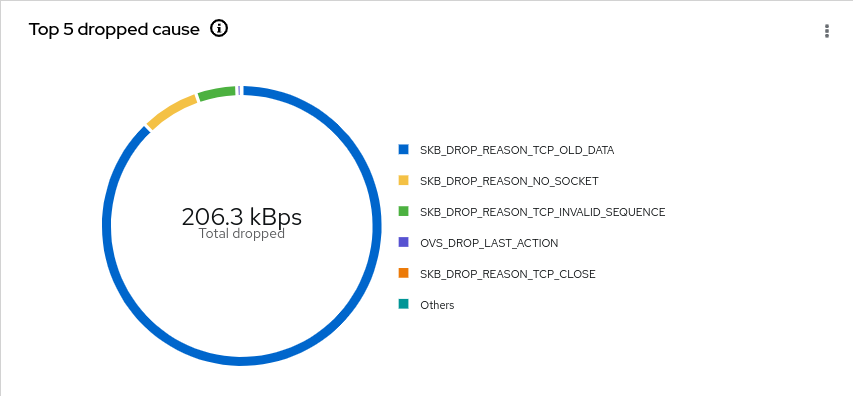
- Top X dropped cause
- Top X flow dropped rates stacked with total
Select the desired graphs to render them in the Overview panel:
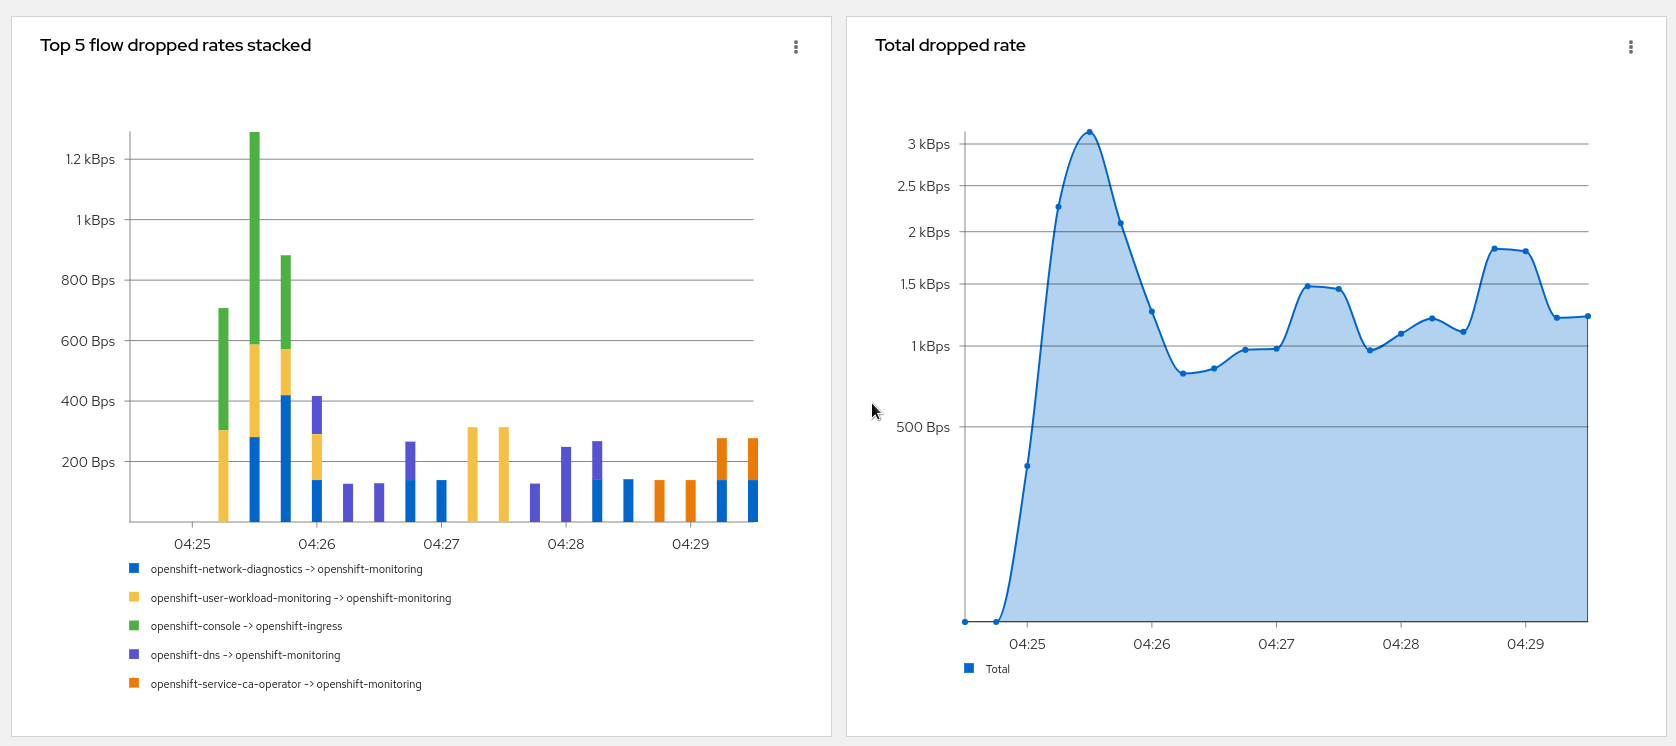
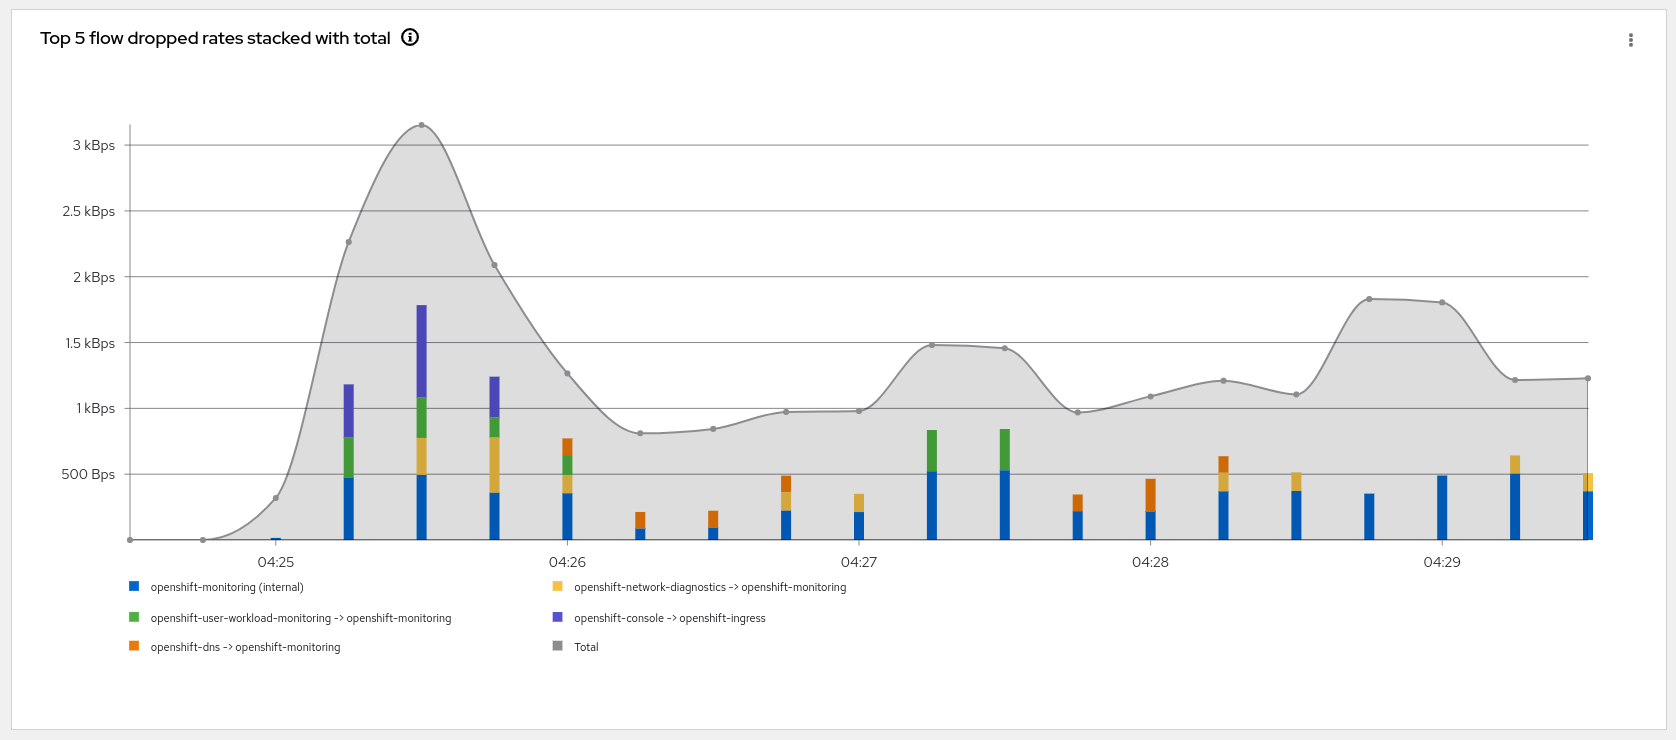
Note that you can compare the top drops against total dropped or total traffic in the last graph using the kebab menu drop graph option.
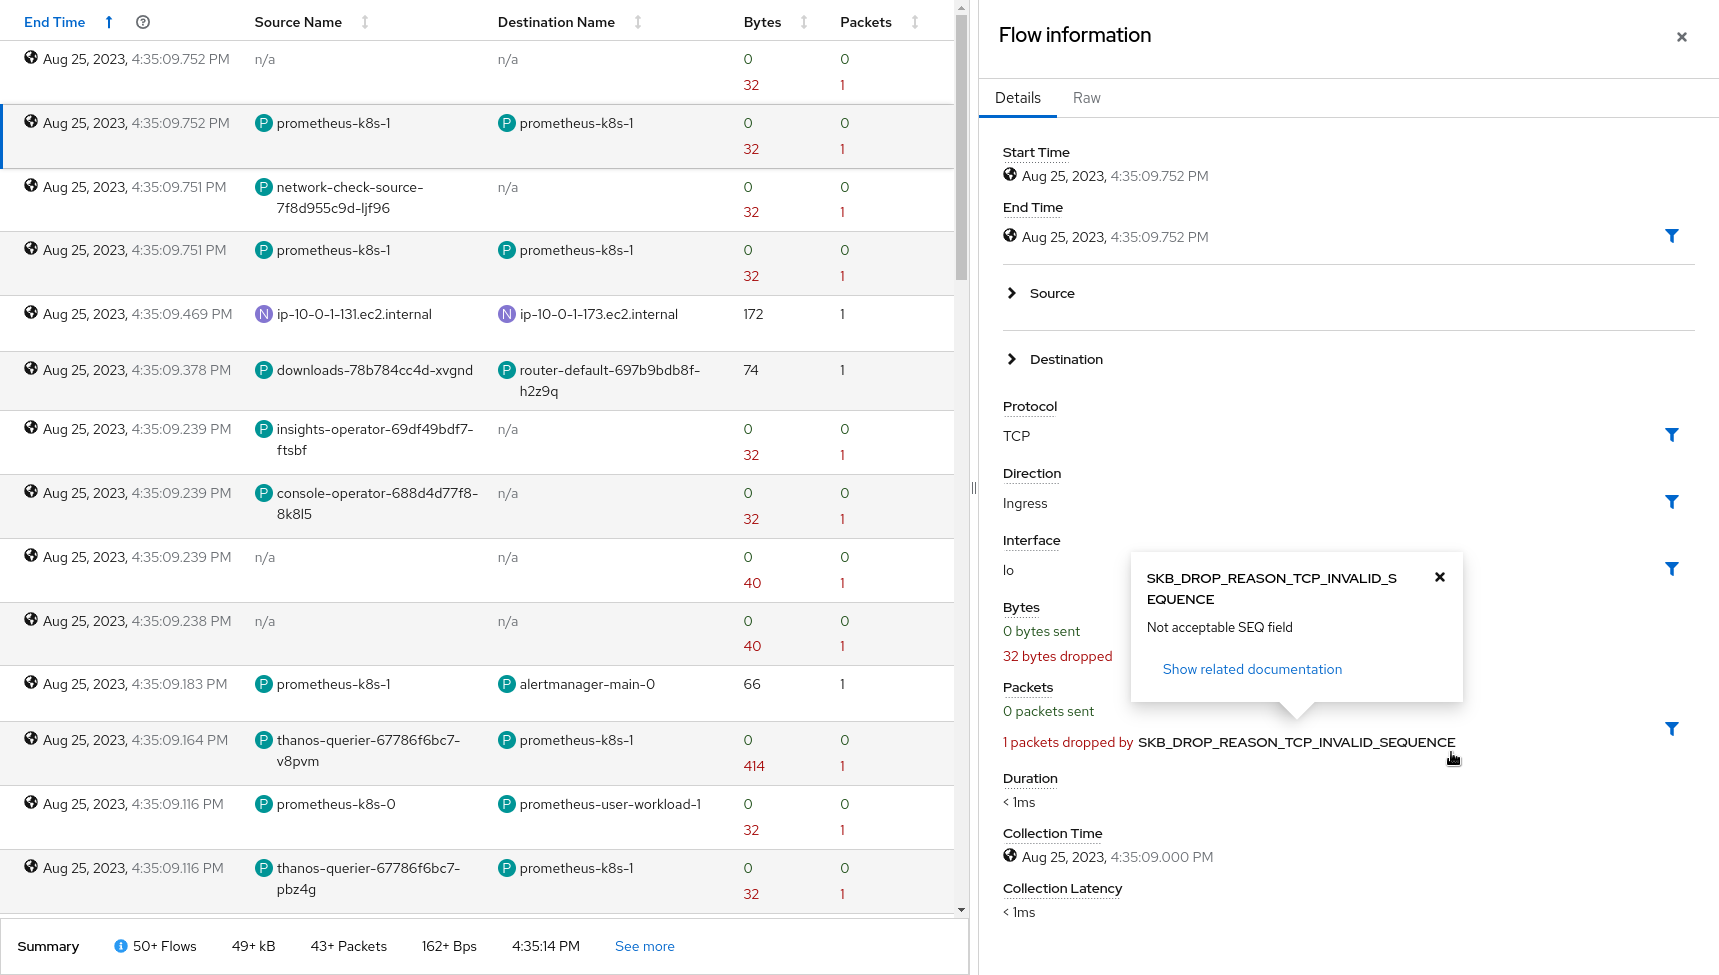
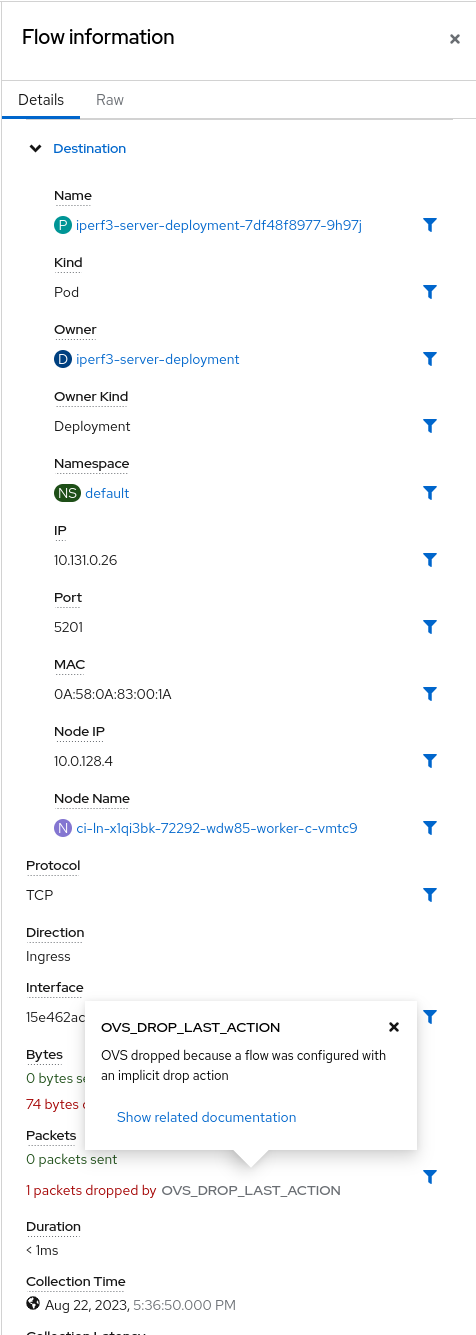
Traffic flows
The table view shows the number of bytes and packets sent in green and the related numbers dropped in red. Additionally, you can get details about the drop in the side panel that brings you to the proper documentation.
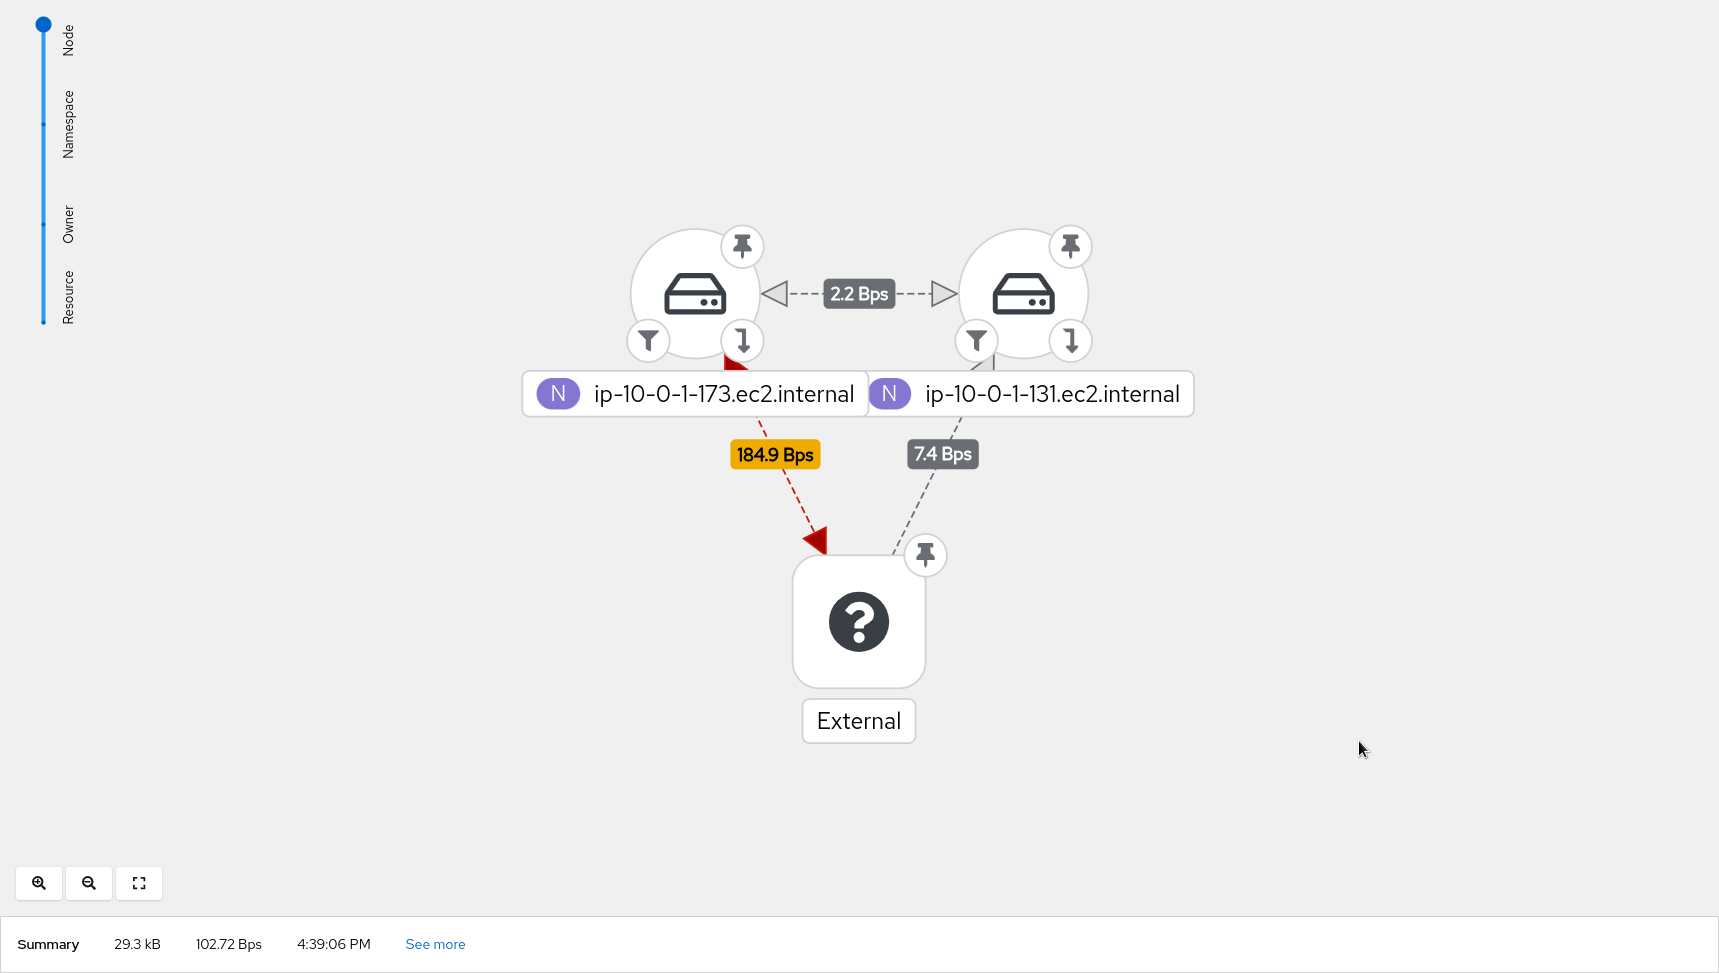
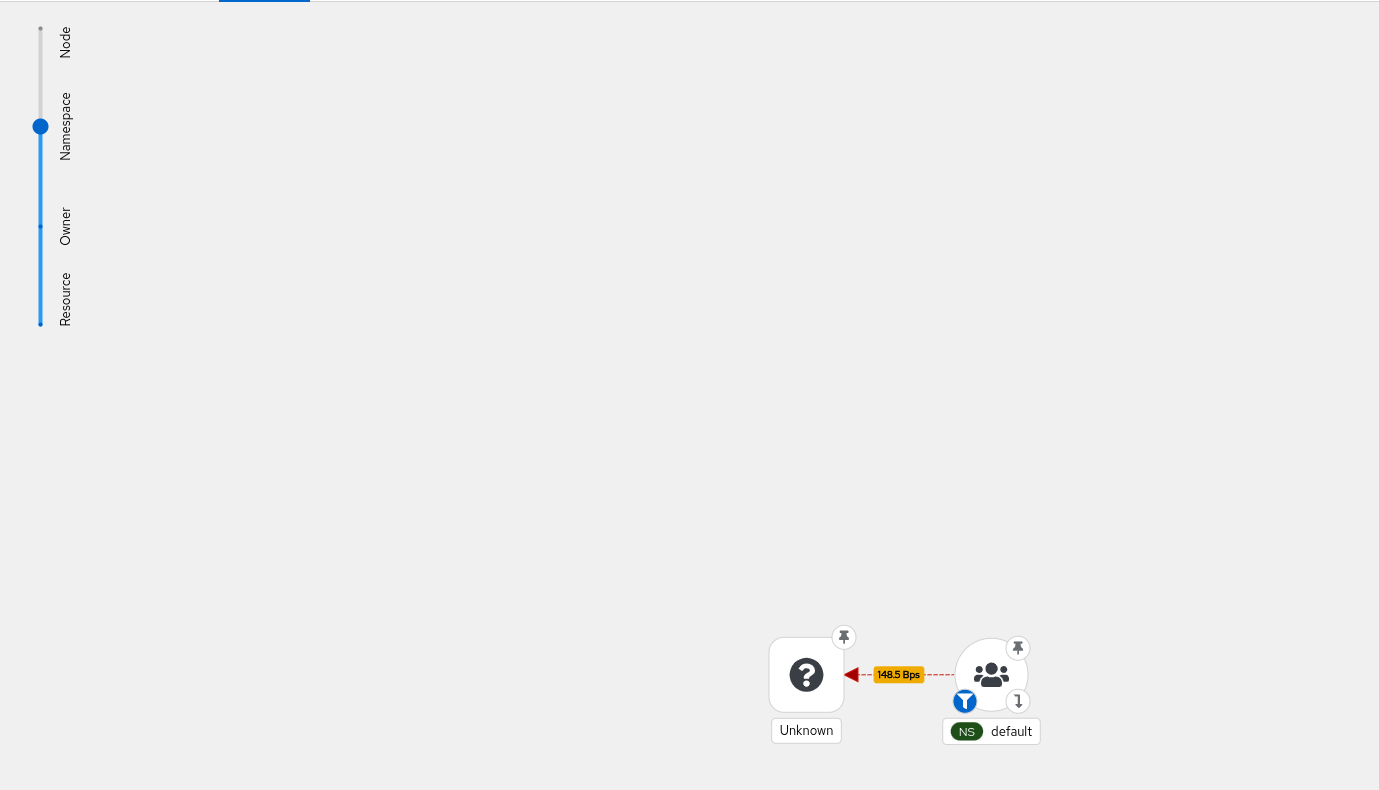
Topology
Last but not least, the topology view displays edges containing drops in red. That's useful, especially when digging on a specific drop reason between two resources.
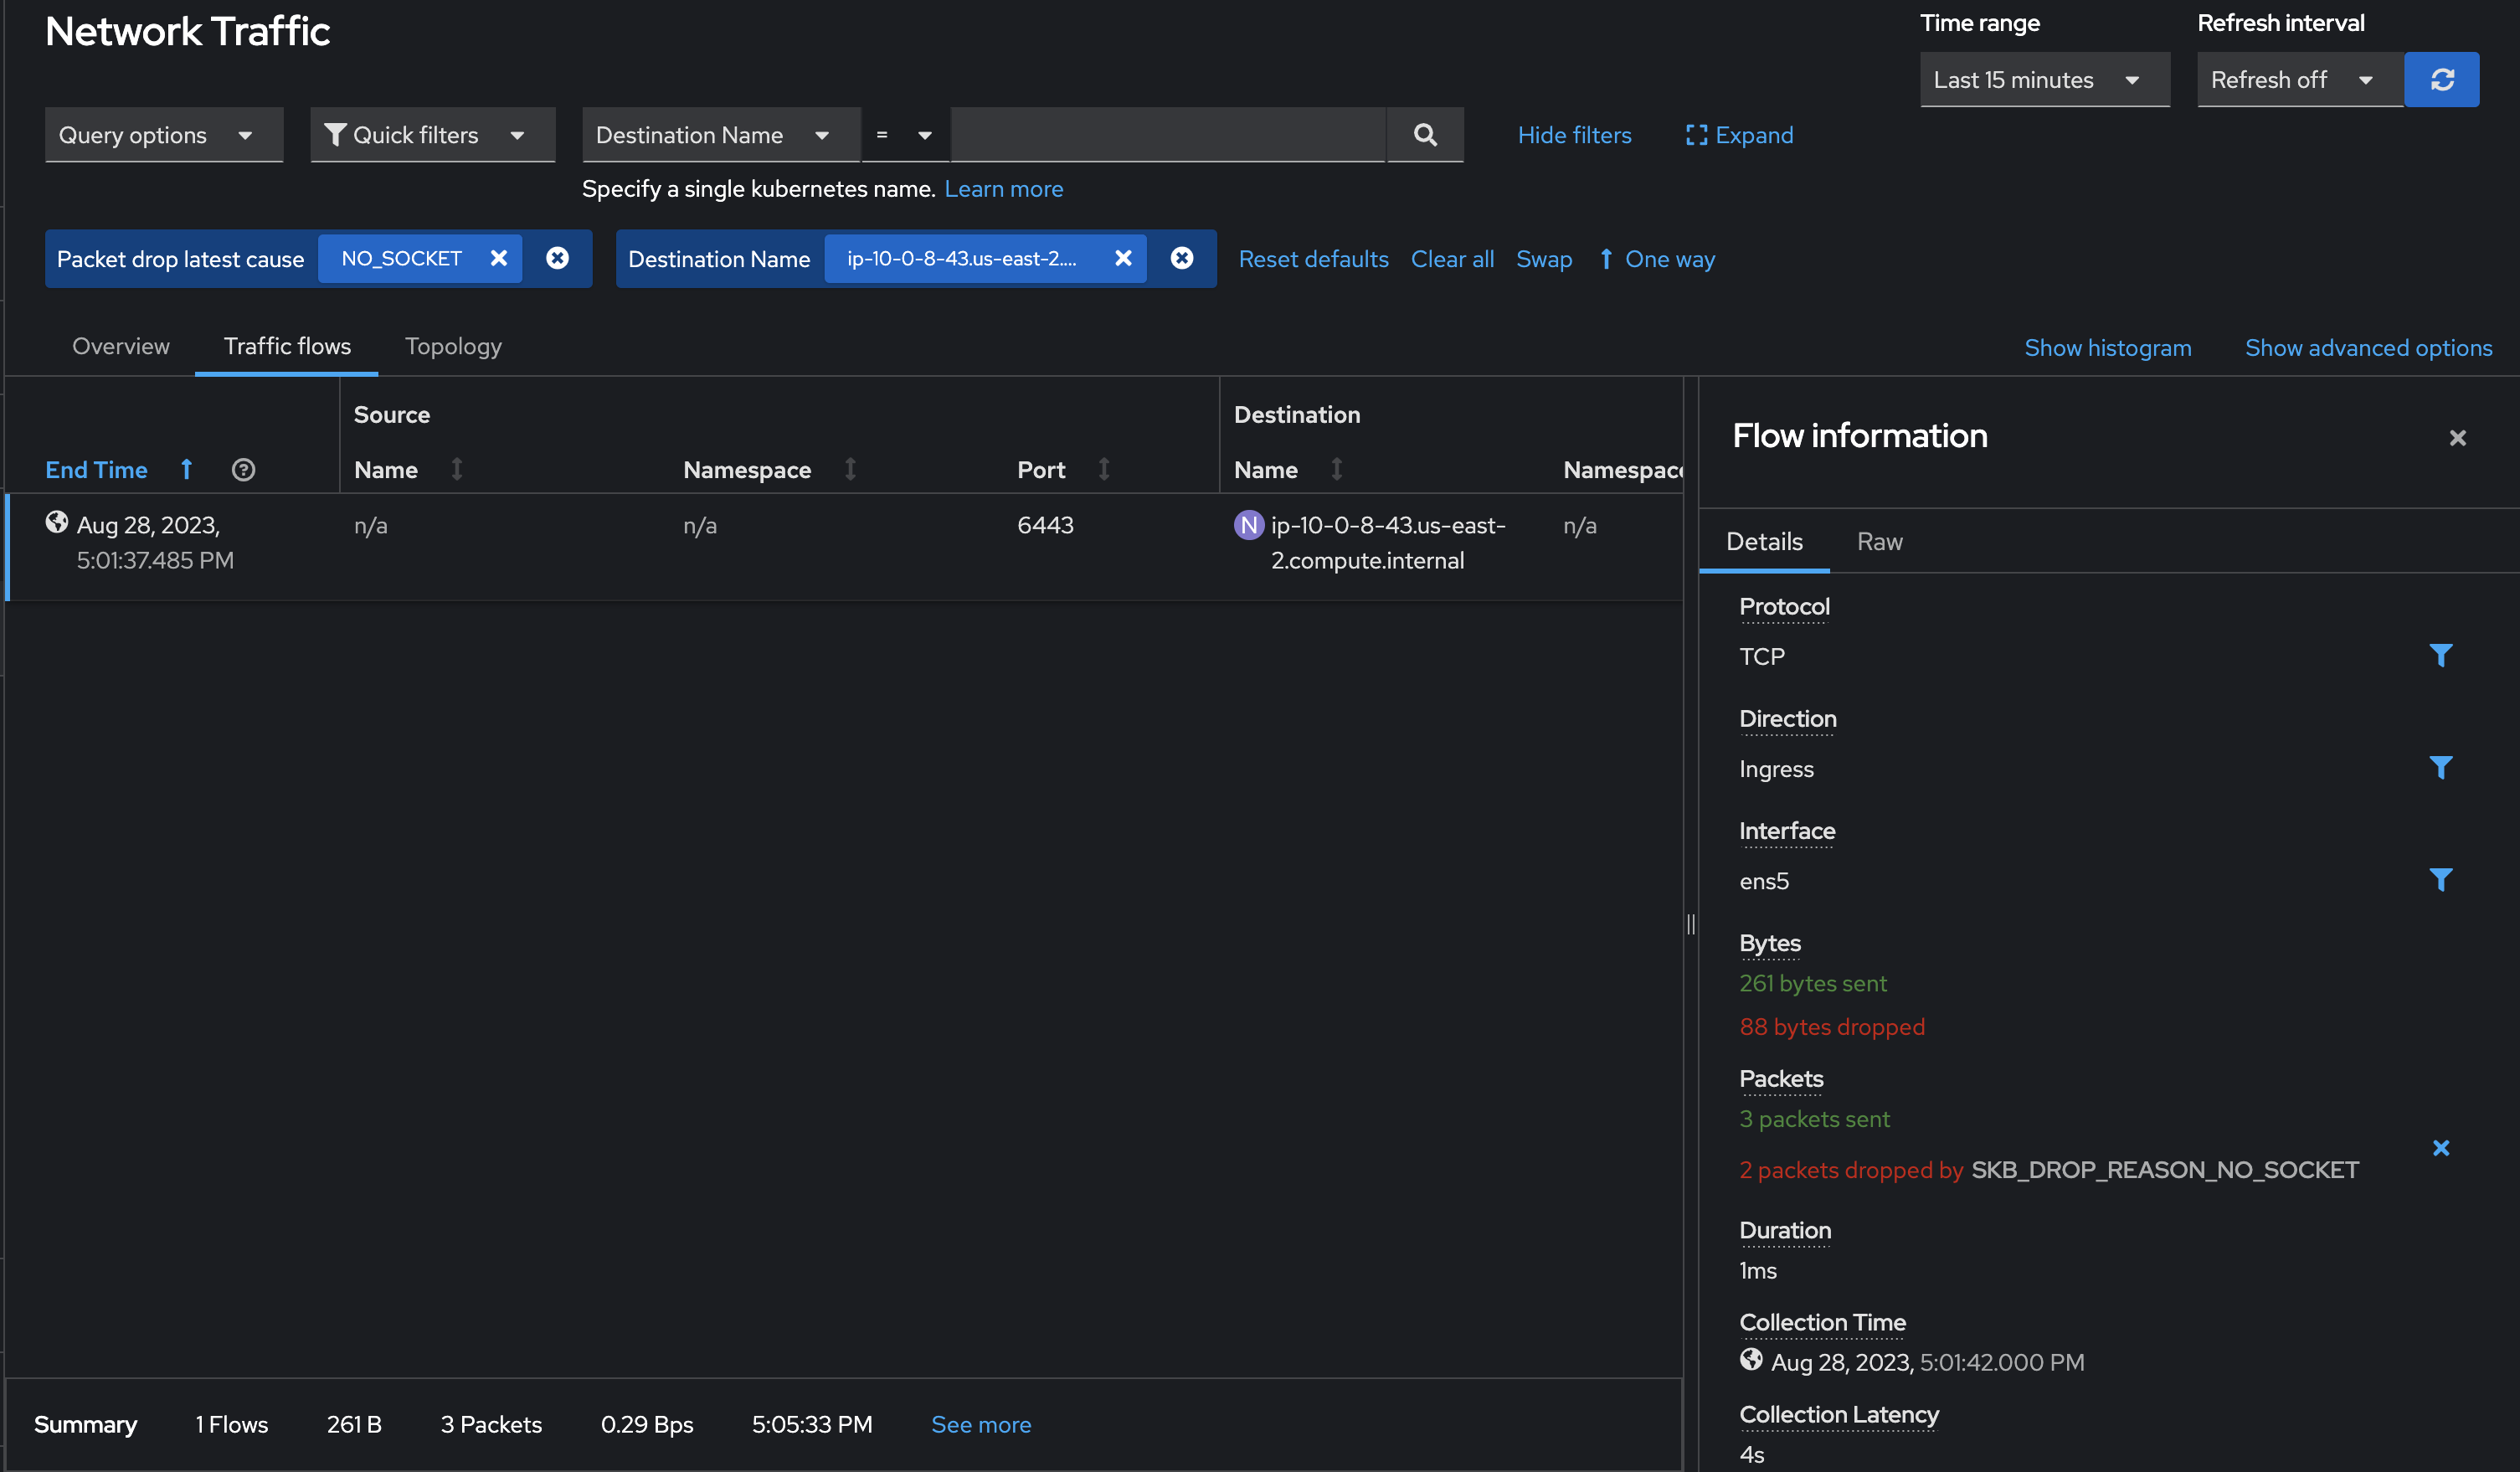
Potential use-case scenarios
NO_SOCKET drop reason: There might be packet drops observed due to the destination port not being reachable. This can be emulated by running a curl command on a node to an unknown port:
while : ; do curl <another nodeIP>:<unknown port>; sleep 5; done
The drops can be observed on the console as seen below:
OVS_DROP_LAST_ACTION drop reason: OVS packet drops can be observed on RHEL 9.2 and above. It can be emulated by running the iperf command with network-policy set to drop on a particular port. These drops can be observed on the console as seen below:
Resource impact of using PacketDrop
The performance impact of using PacketDrop enabled with the Network Observability operator is noticeable on the flowlogs-pipeline (FLP) component using ~22% and ~9% more vCPU and memory, respectively, compared to the baseline. The impact on other components is not significant (less than a 3% increase).
Feedback
We hope you liked this article.
Netobserv is an open source project available on GitHub. Feel free to share your ideas, use cases, or ask the community for help.
執筆者紹介
類似検索
エージェント型のパラドックスとハイブリッド AI の事例
過去を管理するのをやめて、IT の未来を構築しましょう
Crack the Cloud_Open | Command Line Heroes
Edge computing covered and diced | Technically Speaking
チャンネル別に見る

自動化
テクノロジー、チームおよび環境に関する IT 自動化の最新情報

AI (人工知能)
お客様が AI ワークロードをどこでも自由に実行することを可能にするプラットフォームについてのアップデート

オープン・ハイブリッドクラウド
ハイブリッドクラウドで柔軟に未来を築く方法をご確認ください。

セキュリティ
環境やテクノロジー全体に及ぶリスクを軽減する方法に関する最新情報

エッジコンピューティング
エッジでの運用を単純化するプラットフォームのアップデート

インフラストラクチャ
世界有数のエンタープライズ向け Linux プラットフォームの最新情報

アプリケーション
アプリケーションの最も困難な課題に対する Red Hat ソリューションの詳細
仮想化
オンプレミスまたは複数クラウドでのワークロードに対応するエンタープライズ仮想化の将来についてご覧ください