Dynatrace is a proud Red Hat OpenShift partner and the leader in digital performance management. Dynatrace is also an all-in-one, zero-config monitoring platform designed by and for cloud natives. It is powered by artificial intelligence that identifies performance problems and pinpoints their root causes in seconds.
Why Microservices demand better monitoring
Today's growing demand for modern, cloud-native application architectures like microservices has changed the rules of the game. Microservices-based applications are powered by dozens if not thousands of small, interconnected components, each serving a single purpose and meant to be deployed and scaled often and independently. Such highly dynamic, distributed systems carry a high premium. The adage “the more moving parts there are, the higher the likelihood of failures” certainly holds true here.
Because individual components can fail at any time, microservices-based systems must be fault tolerant. If you want to embrace a microservices architecture for "agility, speed, and scale," you’ll need to ensure that your application can tolerate a high number of simultaneous failures without compromising customer experience.
With failures happening all the time, it’s evident that microservices demand a more sophisticated approach to monitoring than do their monolithic counterparts. We’ve learned from our customers’ experiences that monitoring strategies based on massively aggregated log data in combination with uncorrelated incident alerting rarely produces actionable insights. A more thorough approach can reveal the full picture.
A good monitoring solution knows the difference between desirable and unwanted behavior that emerges from interconnected components. The right solution enables you to understand the cause and effect of failure propagation and pinpoints the root causes of errors in seconds. An effective monitoring strategy doesn't stand in your way—it’s rather an integral feature of your platform that you don't need to think about.
Why Dynatrace?
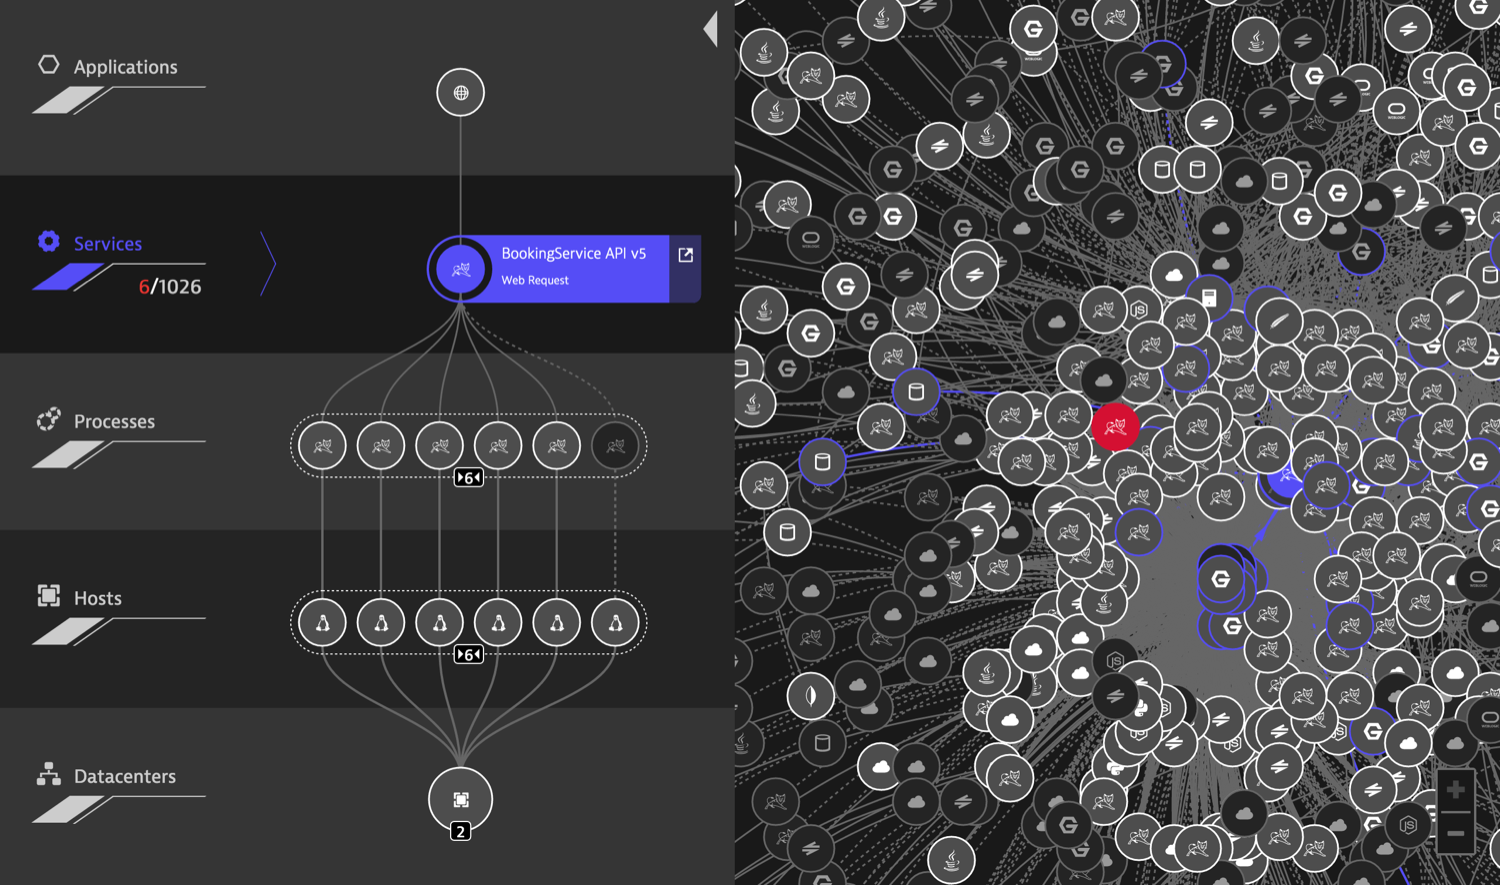
At Dynatrace, being cloud natives ourselves, we developed the platform so that our customers can master the dynamics of each layer within their large highly-distributed applications: applications, services, containers, processes, hosts, and data centers.
The screenshot below shows you how a single service that is provided by a multitude of containers fits into the overall system of one of South America’s largest e-commerce production environments.
The migration from a monolithic application architecture to a microservices-oriented architecture involves trading fast in-memory communication for slower inter-service communication across networks. Typically however, data from multiple services is needed to support each business function. For example, a product overview page may require data points related to users, products, pricing, availability, reviews, and more. Dynatrace helps you understand how your services communicate with one another to avoid unplanned and inefficient communications.
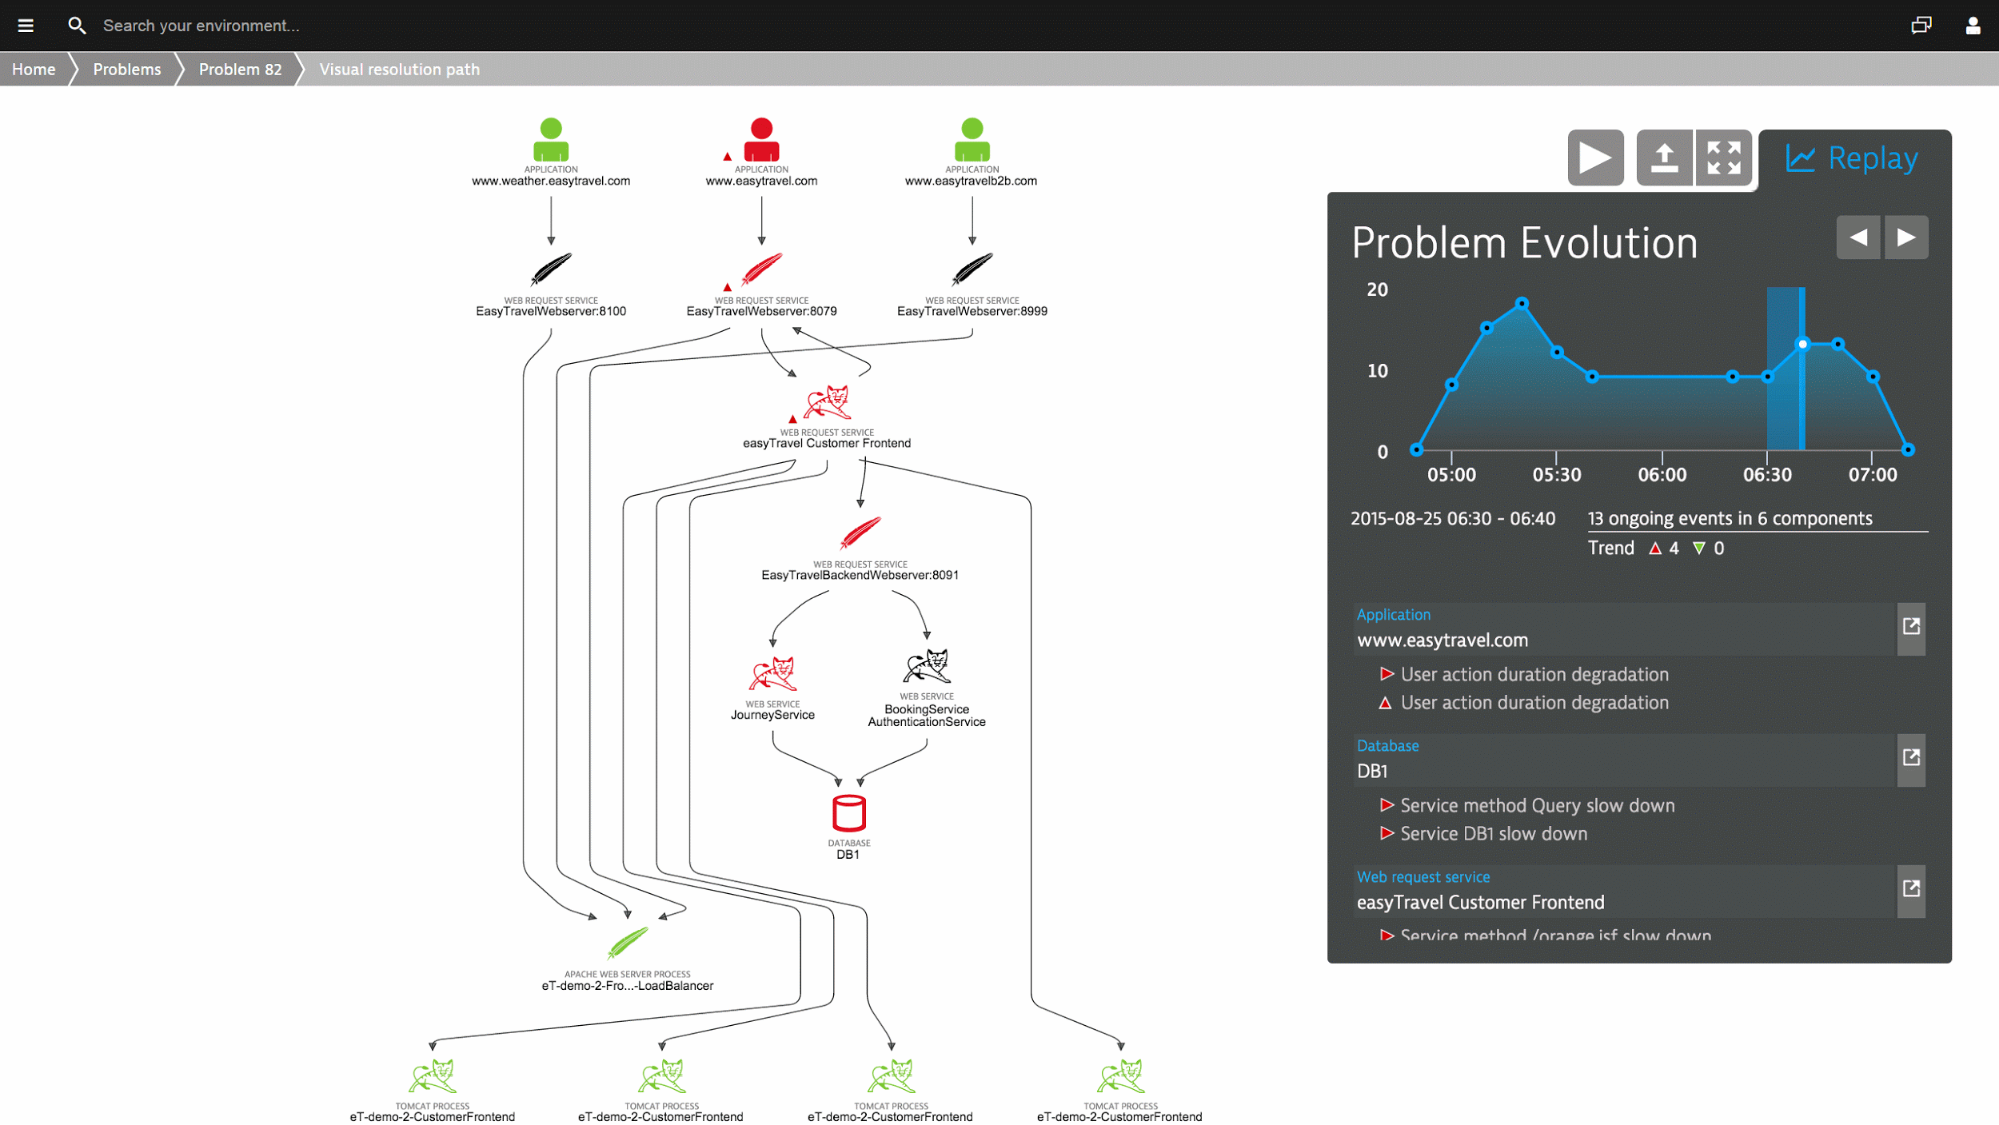
At Dynatrace we have more than a decade of experience in building monitoring solutions. One of our recent innovations is an artificial intelligence technology that enables you to replay failures to better understand how they evolved over time, the components that were affected, whether or not users were affected, and the root cause of the failure.
If you’re interested in what Dynatrace can offer when it comes to monitoring your own OpenShift applications, have a look at our Dynatrace OpenShift page.
Ready to explore Dynatrace yourself?
We’ll get you started in a few easy steps.
1. Create your Dynatrace account
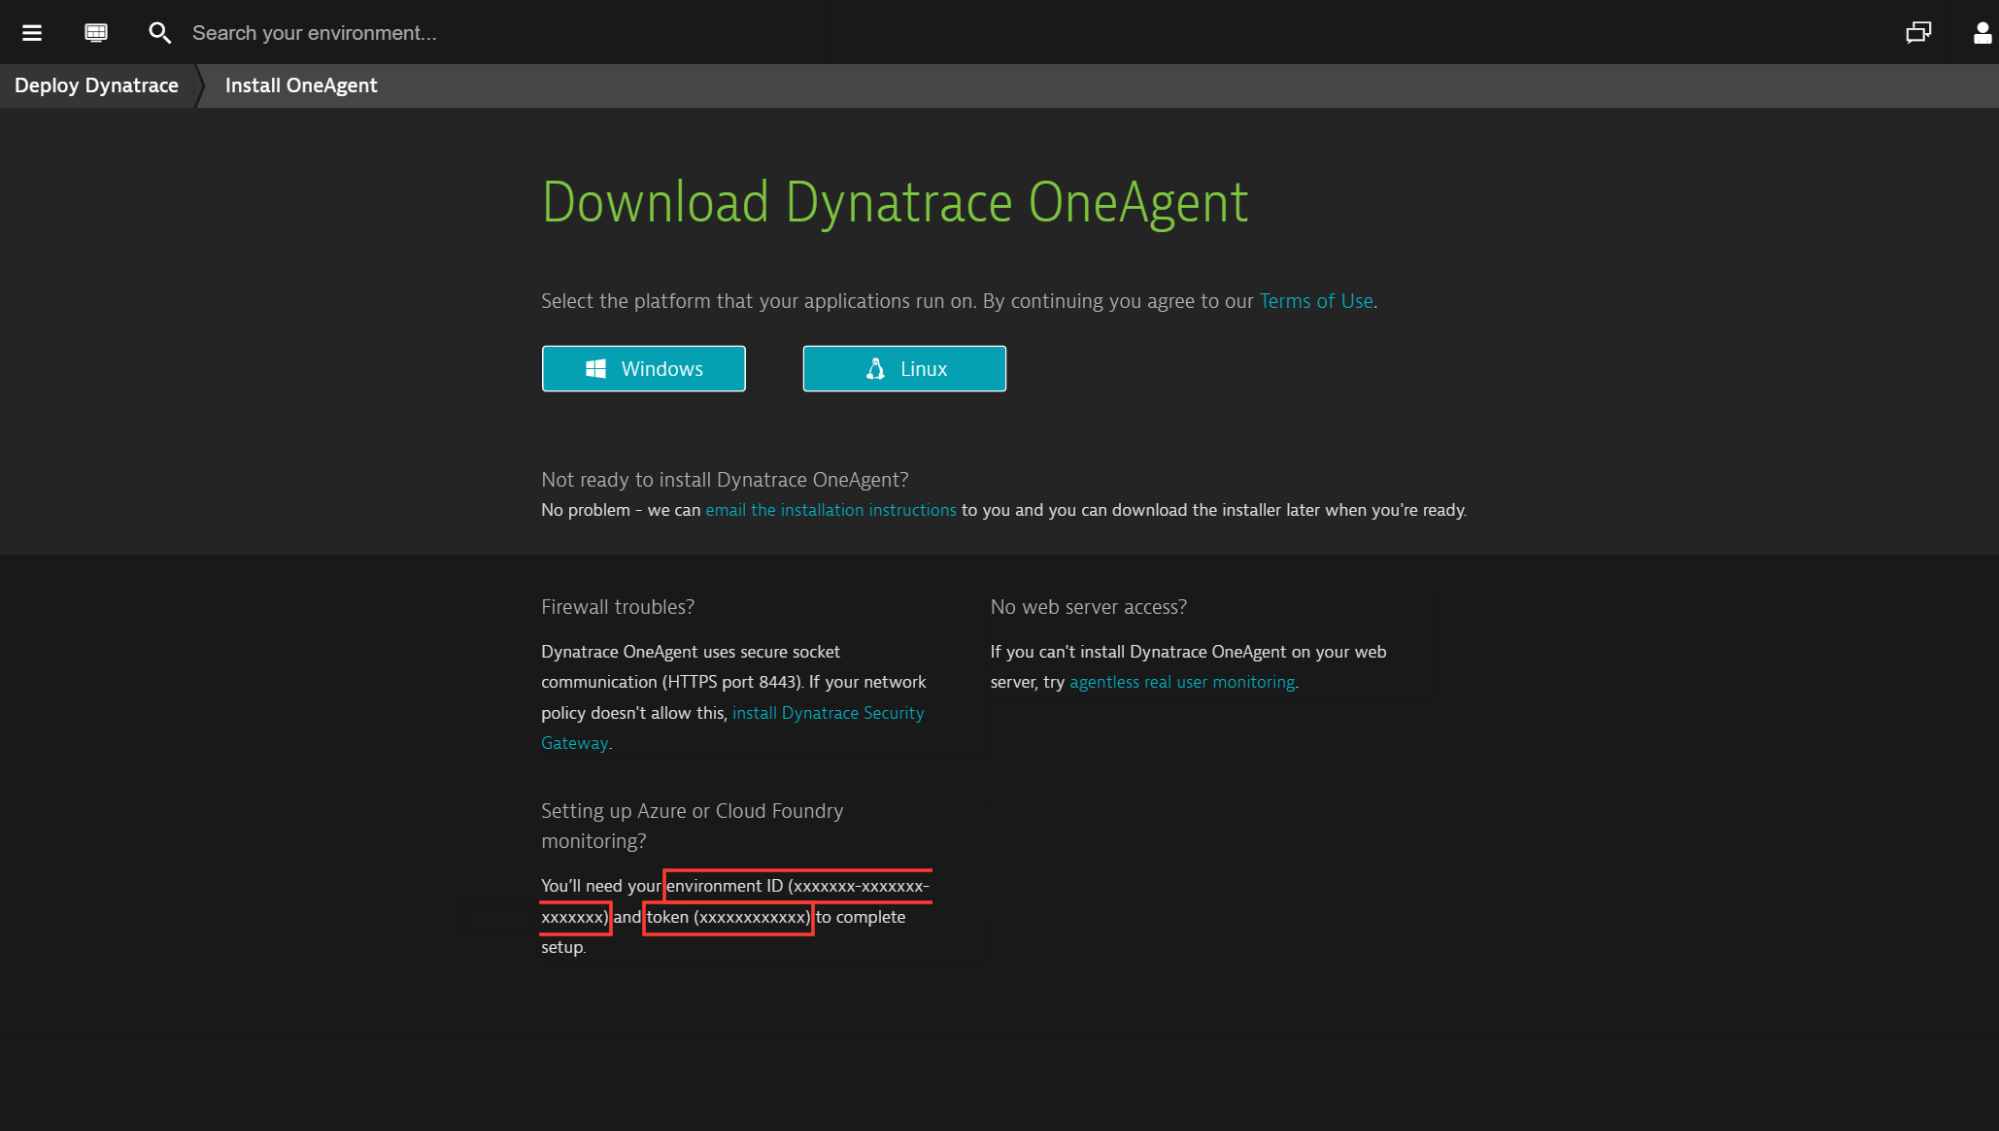
Sign up for your Dynatrace free trial account and take note of your assigned environment ID and token values (shown below).
2. Install Dynatrace OneAgent via Ansible
These instructions assume that you have basic knowledge of Ansible, a simple yet extremely powerful IT automation tool that has been making our lives at Dynatrace easier since its earliest days.
You’ll use Ansible to automatically roll out Dynatrace OneAgent to the nodes of an OpenShift cluster. OneAgent monitors real user experience and all the technologies, services and applications that run in your environment. No additional configuration required.
1. Obtain our Ansible role for Dynatrace OneAgent
The following command installs Dynatrace OneAgent with the role Dynatrace.OneAgent into the roles subdirectory within your current working directory:
ansible-galaxy install Dynatrace.OneAgent -p roles
2. Describe your cluster nodes via an Ansible inventory
Create a file called hosts inside your working directory and add a newline-separated list of cluster nodes, like this:
192.168.0.100

192.168.0.101

192.168.0.102

192.168.0.103
If manual definition of hosts isn’t your style, use a dynamic inventory script (you’ll find plenty of useful scripts here) for automated discovery of your cluster nodes across public, private, and hybrid cloud environments.
3. Define Dynatrace OneAgent deployment with an Ansible Playbook
With your cluster nodes identified, the only thing left to do is describe the deployment of OneAgent within an Ansible playbook (a playbook.yml file). We’ll use the Dynatrace.OneAgent Ansible role to configure how the agent delivers insights to your account:
---

- hosts: all

  roles:

  - role: Dynatrace.OneAgent

    dynatrace_oneagent_environment_id: YOUR_ENVIRONMENT_ID

    dynatrace_oneagent_tenant_token: YOUR_TENANT_TOKEN
4. Run Dynatrace OneAgent deployment via Ansible
Now start the deployment process using Ansible:
ansible-playbook -i hosts playbook.yml
5. Start your OpenShift applications
Once Dynatrace OneAgent has been deployed to your cluster you simply start your OpenShift application as you normally would—Dynatrace will take care of the monitoring:
oc new-app .
Don’t forget that existing OpenShift applications must be restarted (for example, by temporarily reducing the number of pods for those applications to 0).
Next Steps
Now you know how to automate the process of installing Dynatrace OneAgent on each of your cluster nodes for effective monitoring of your OpenShift applications using Ansible. A follow-up article will address the integration of the agent inside a Docker container, which developers can deploy alongside their applications running on top of OpenShift.
執筆者紹介
類似検索
Strengthening the enterprise foundation: Red Hat and Oracle’s expanding collaboration
Unlocking sovereign AI and protected collaboration with confidential computing
Technically Speaking | Build a production-ready AI toolbox
Technically Speaking | Platform engineering for AI agents
チャンネル別に見る
自動化
テクノロジー、チームおよび環境に関する IT 自動化の最新情報
AI (人工知能)
お客様が AI ワークロードをどこでも自由に実行することを可能にするプラットフォームについてのアップデート
オープン・ハイブリッドクラウド
ハイブリッドクラウドで柔軟に未来を築く方法をご確認ください。
セキュリティ
環境やテクノロジー全体に及ぶリスクを軽減する方法に関する最新情報
エッジコンピューティング
エッジでの運用を単純化するプラットフォームのアップデート
インフラストラクチャ
世界有数のエンタープライズ向け Linux プラットフォームの最新情報
アプリケーション
アプリケーションの最も困難な課題に対する Red Hat ソリューションの詳細
仮想化
オンプレミスまたは複数クラウドでのワークロードに対応するエンタープライズ仮想化の将来についてご覧ください


