In this article I will demonstrate how to prepare and configure Loki and how to use LogForwarder to forward OpenShift logs to this service.
In this article, we will use a Red Hat Enterprise Linux 8 (rhel8) server to run our Loki stack, which will be composed of Loki, Grafana and PromTail, we will use podman and podman-compose to manage our stack.
Lets go to what matters.
Loki Server
First, let's start our Loki, for that we will use a rhel8 server
- Let's create the following directory structure
[root@loki-server ~]# mkdir -pv monitoring/{loki,promtail,grafana}/{data,config}
- We will also leave our provisioning directory created for later use.
[root@loki-server ~]# mkdir -pv /root/monitoring/grafana/data/provisioning/datasources
- Now let's create our
docker-compose.yaml.
version: "3"
services:
  loki:
    image: grafana/loki:2.5.0
    volumes:
      - /root/monitoring/loki/config:/mnt/config
    ports:
      - "3100:3100"
    command: -config.file=/mnt/config/loki-config.yaml
    user: loki
    networks:
      - loki

  promtail:
    privileged: true
    image: grafana/promtail:2.5.0
    volumes:
      - /root/monitoring/promtail/config:/mnt/config
      - /var/log:/var/log
    command: -config.file=/mnt/config/promtail-config.yaml
    ports:
      - "9080:9080"
    user: root
    networks:
      - loki

  grafana:
    image: grafana/grafana:latest
    volumes:
      - grafana-storage:/var/lib/grafana
      - /root/monitoring/grafana/data/provisioning:/etc/grafana/provisioning
    environment:
      - GF_INSTALL_PLUGIN='grafana-simple-json-datasource'
    ports:
      - "3000:3000"
    networks:
      - loki

networks:
  loki:

volumes:
  grafana-storage:
-
Now let's create our configuration files, starting with
promtail-config.yaml.- Promtail is an agent which ships the contents of local logs to a private Grafana Loki instance. It is usually deployed to every machine that has applications needed to be monitored.
[root@loki-server ~]# cat /root/monitoring/promtail/config/promtail-config.yaml
server:
  http_listen_port: 9080
  grpc_listen_port: 0

positions:
  filename: /tmp/positions.yaml

clients:
  - url: http://loki-server:3100/loki/api/v1/push

scrape_configs:
- job_name: system
  static_configs:
  - targets:
      - localhost
    labels:
      job: varlogs
      __path__: /var/log/**
Adjust the url according to your scenario, inform the host server followed by the api context for communication.
Obs.: In this scenario, promtail is just forwarding logs from the /var/log directory to Loki, which is not a necessary component for receiving logs from Openshift.
- Now let's create our
loki-config.yamlfile
[root@loki-server ~]# cat /root/monitoring/loki/config/loki-config.yaml
auth_enabled: false

server:
  http_listen_port: 3100
  grpc_listen_port: 9096
  grpc_server_max_recv_msg_size: 8388608

common:
  path_prefix: /tmp/loki
  storage:
    filesystem:
      chunks_directory: /tmp/loki/chunks
      rules_directory: /tmp/loki/rules
  replication_factor: 1
  ring:
    instance_addr: 127.0.0.1
    kvstore:
      store: inmemory

schema_config:
  configs:
    - from: 2020-10-24
      store: boltdb-shipper
      object_store: filesystem
      schema: v11
      index:
        prefix: index_
        period: 24h

ingester:
  wal:
    enabled: true
    dir: /tmp/wal
  lifecycler:
    address: 127.0.0.1
    ring:
      kvstore:
        store: inmemory
      replication_factor: 1
    final_sleep: 0s
  chunk_idle_period: 1h       # Any chunk not receiving new logs in this time will be flushed
  chunk_target_size: 8388608
  max_chunk_age: 1h           # All chunks will be flushed when they hit this age, default is 1h
  chunk_retain_period: 30s    # Must be greater than index read cache TTL if using an index cache (Default index read cache TTL is 5m)
  max_transfer_retries: 0     # Chunk transfers disabled

storage_config:
  boltdb_shipper:
    active_index_directory: /tmp/loki/boltdb-shipper-active
    cache_location: /tmp/loki/boltdb-shipper-cache
    cache_ttl: 24h
    shared_store: filesystem
  filesystem:
    directory: /tmp/loki/chunks

compactor:
  working_directory: /tmp/loki/boltdb-shipper-compactor
  shared_store: filesystem

limits_config:
  reject_old_samples: true
  reject_old_samples_max_age: 12h
  ingestion_rate_mb: 8
  ingestion_burst_size_mb: 16

chunk_store_config:
  max_look_back_period: 0s

table_manager:
  retention_deletes_enabled: false
  retention_period: 0s

ruler:
  storage:
    type: local
    local:
      directory: /tmp/loki/rules
  rule_path: /tmp/loki/rules-temp
  ring:
    kvstore:
      store: inmemory
  enable_api: true
This configuration can be found in the documentation, in the troubleshooting item, demonstrating the recommendations and best practices, link in the document references.
-
Now let's start our stack and validate that everything is working correctly
- Run the command below to start the services
[root@loki-server ~]# podman-compose --project-name monitoring up -d
- To validate that the containers were uploaded correctly, run the following command
[root@loki-server ~]# podman ps
- If your result is the same, let's validate if grafana is accessible
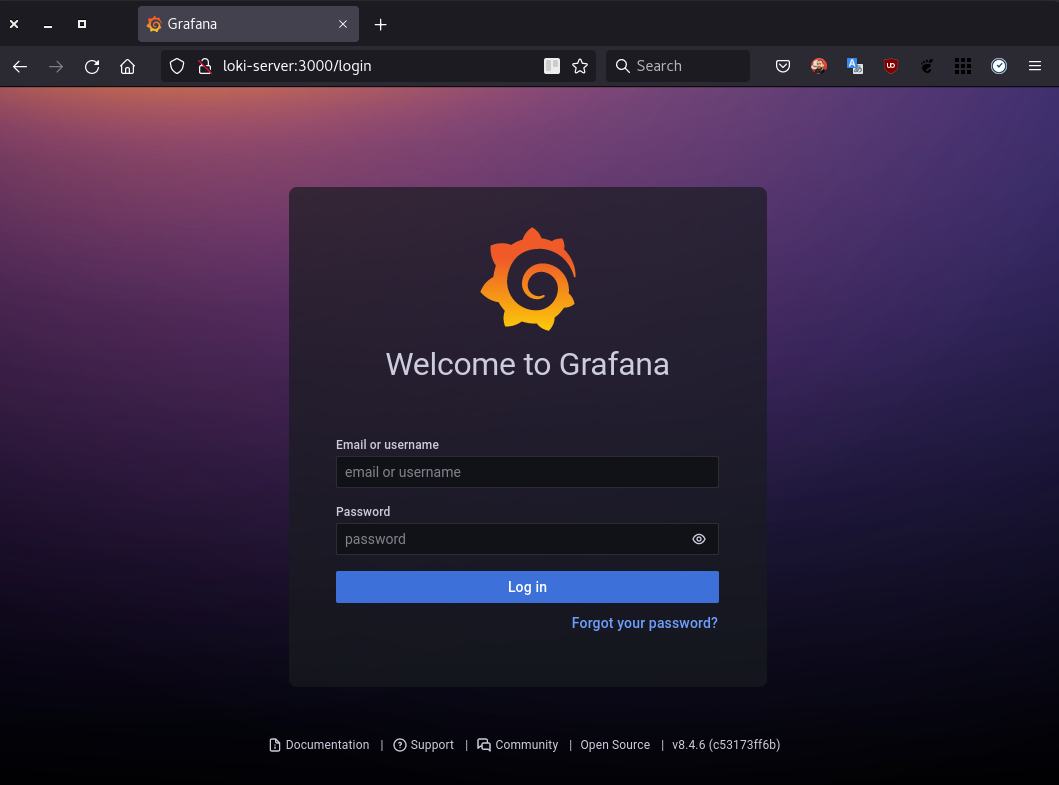
Obs.: To access grafana use the username and password as
admin
- Now we need to add our datasource pointing to the Loki endpoint and then use the Grafana interface to view our logs.
- So that we have our datasource being automatically configured as soon as we install our instance, we are going to use the Grafana
PROVISIONINGfeature, for that, create the following file:
[root@loki-server ~]# cat /root/monitoring/grafana/data/provisioning/datasources/loki.yaml
apiVersion: 1
datasources:
 - name: Loki
   type: loki
   access: proxy
   orgId: 1
   url: http://loki-server:3100
   isDefault: true
   version: 1
   editable: true
This resource will configure a datasource of type
loki, already pointing to theurlof the loki server running on port3100of my host.
- After that, run the following command to restart and apply our configuration to datasource
[root@loki-server ~]# podman pod restart monitoring
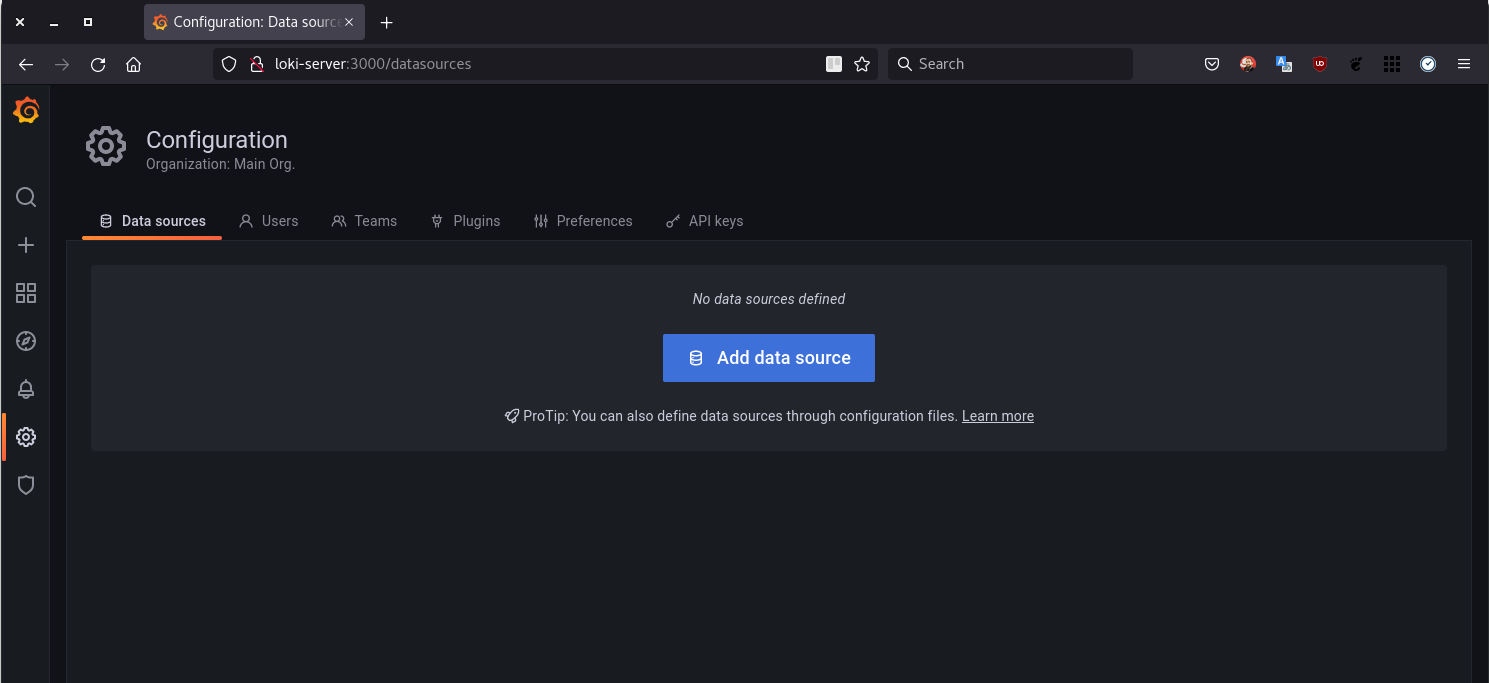
- Now we can go back to the Grafana interface and validate that our datasource was created successfully
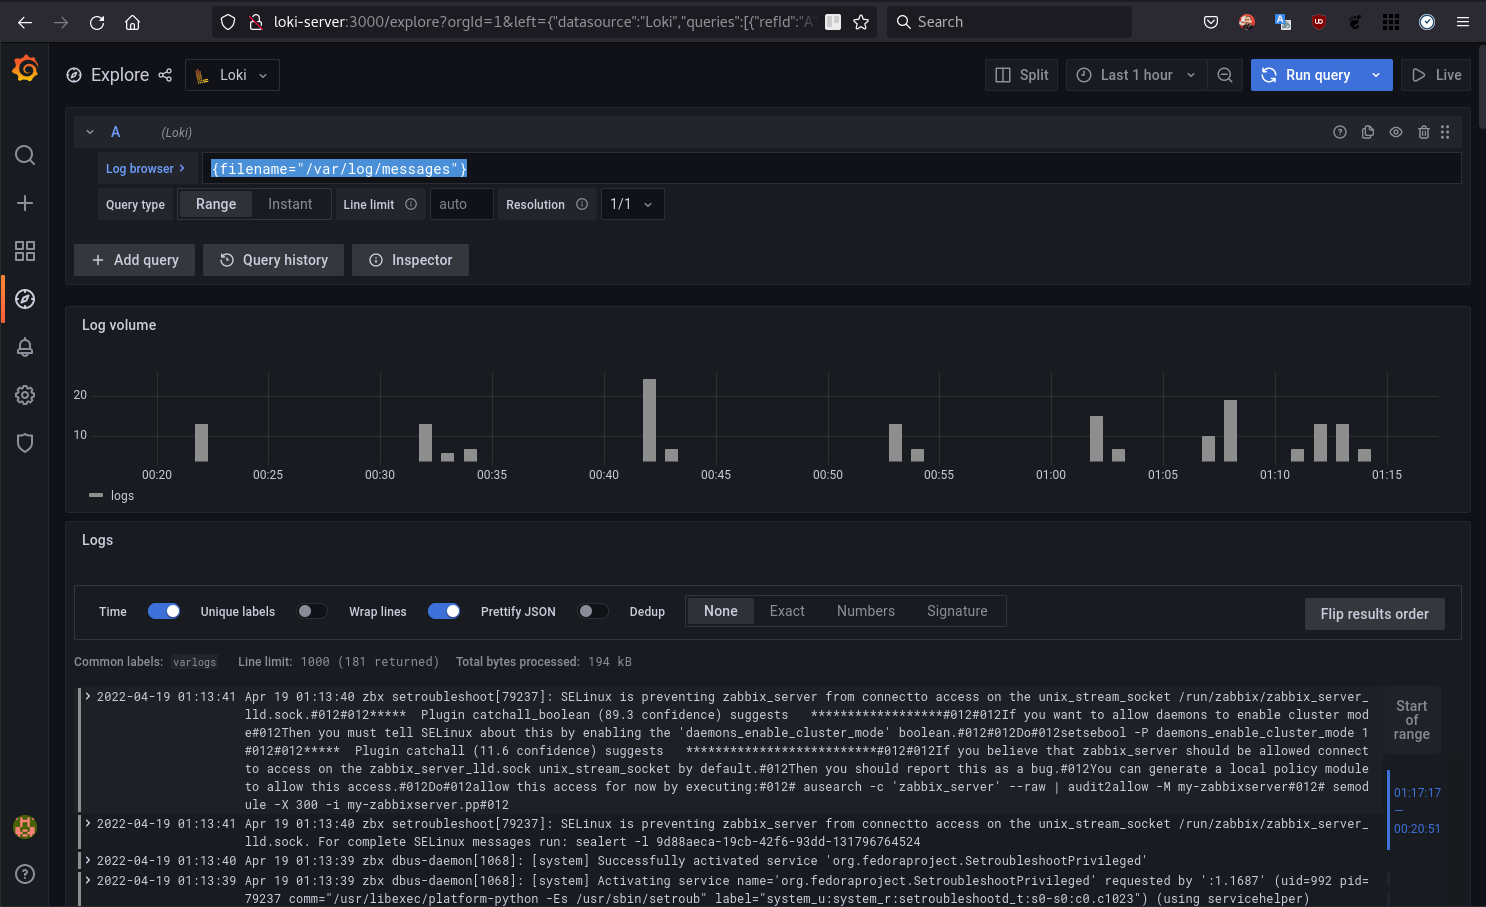
- To test our Loki using promtail with local logs, let's create the Explore icon in the side menu, now let's run the following query to validate
{filename="/var/log/messages"}
Now that we know that our Loki is working properly, let's move on to OpenShift.
OpenShift LogForwarder
Obs.: This article does not include the installation of OpenShift Logging, for more information, see the reference link.
-
Now in the OpenShift interface
- In the side menu, select
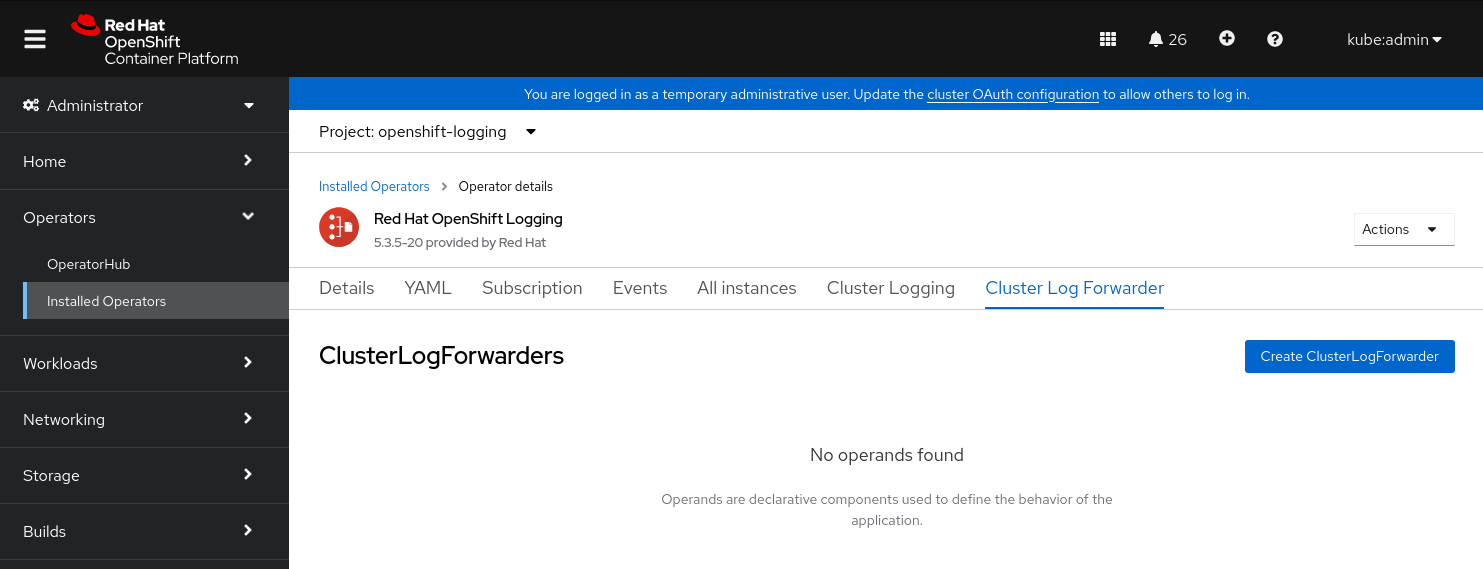
Installed Operators> Select theopenshift-logging project> Then click on "Cluster Log Forwarder" in Provided API's.
- In the side menu, select
- Now click on "
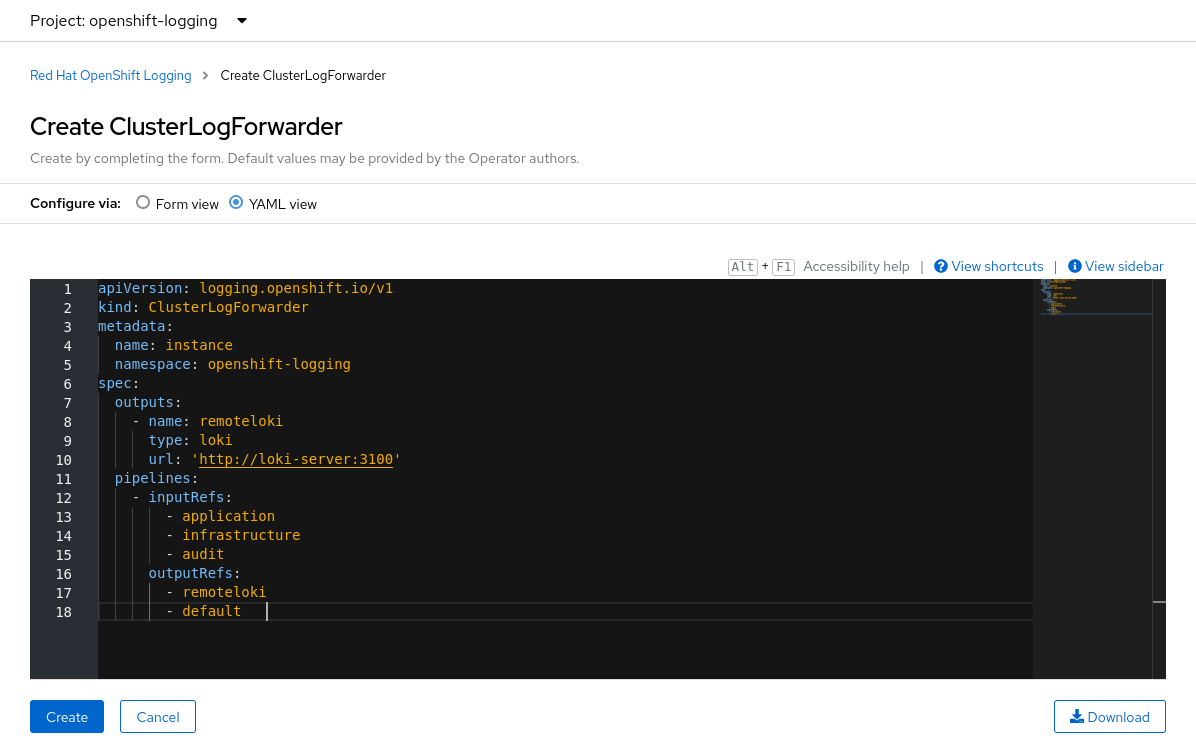
Create ClusterLogForwarder"
- In this yaml, we register our loki-server as
remotelokiand in thepipeline, we are informing that we want theapplication, infrastructure and auditlogs to be forwarded toremotelokiand to thedefault, which in this case is theinternal elasticsearchof Openhift Logging.
apiVersion: logging.openshift.io/v1
kind: ClusterLogForwarder
metadata:
  name: instance
  namespace: openshift-logging
spec:
  outputs:
    - name: remoteloki
      type: loki
      url: 'http://loki-server:3100'
  pipelines:
    - inputRefs:
        - application
        - infrastructure
        - audit
      outputRefs:
        - remoteloki
        - default
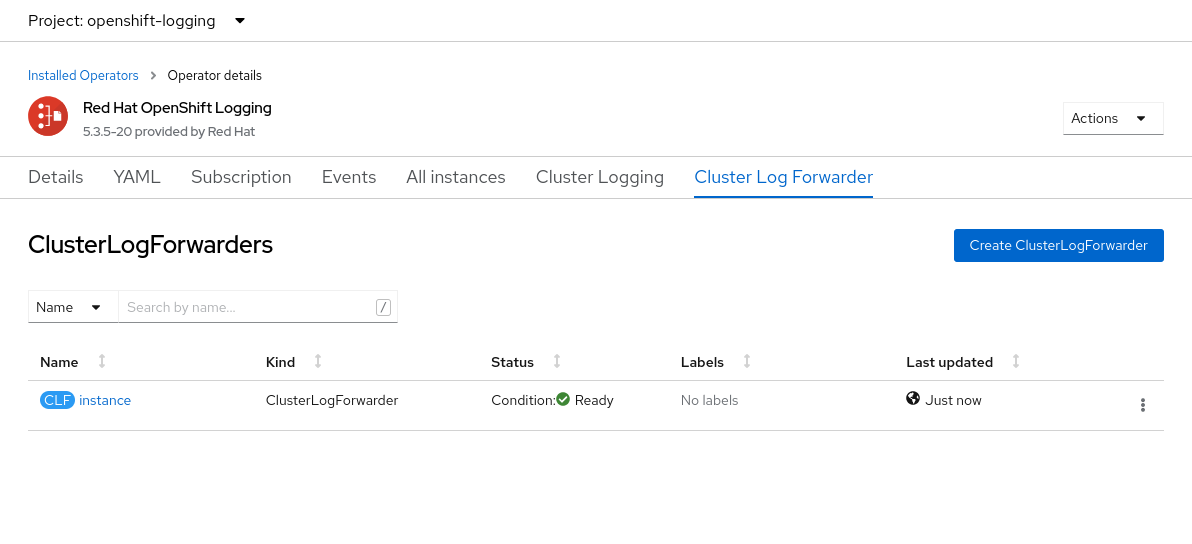
- After clicking Create, wait until the status is "
Condition: Ready", as shown in the image below
- After this process, the new configuration needs to be applied to the collector(fluentd) pods, wait until all have been restarted and have the new configuration
[root@bastion ~]# oc get pods -l component=collector -n openshift-logging
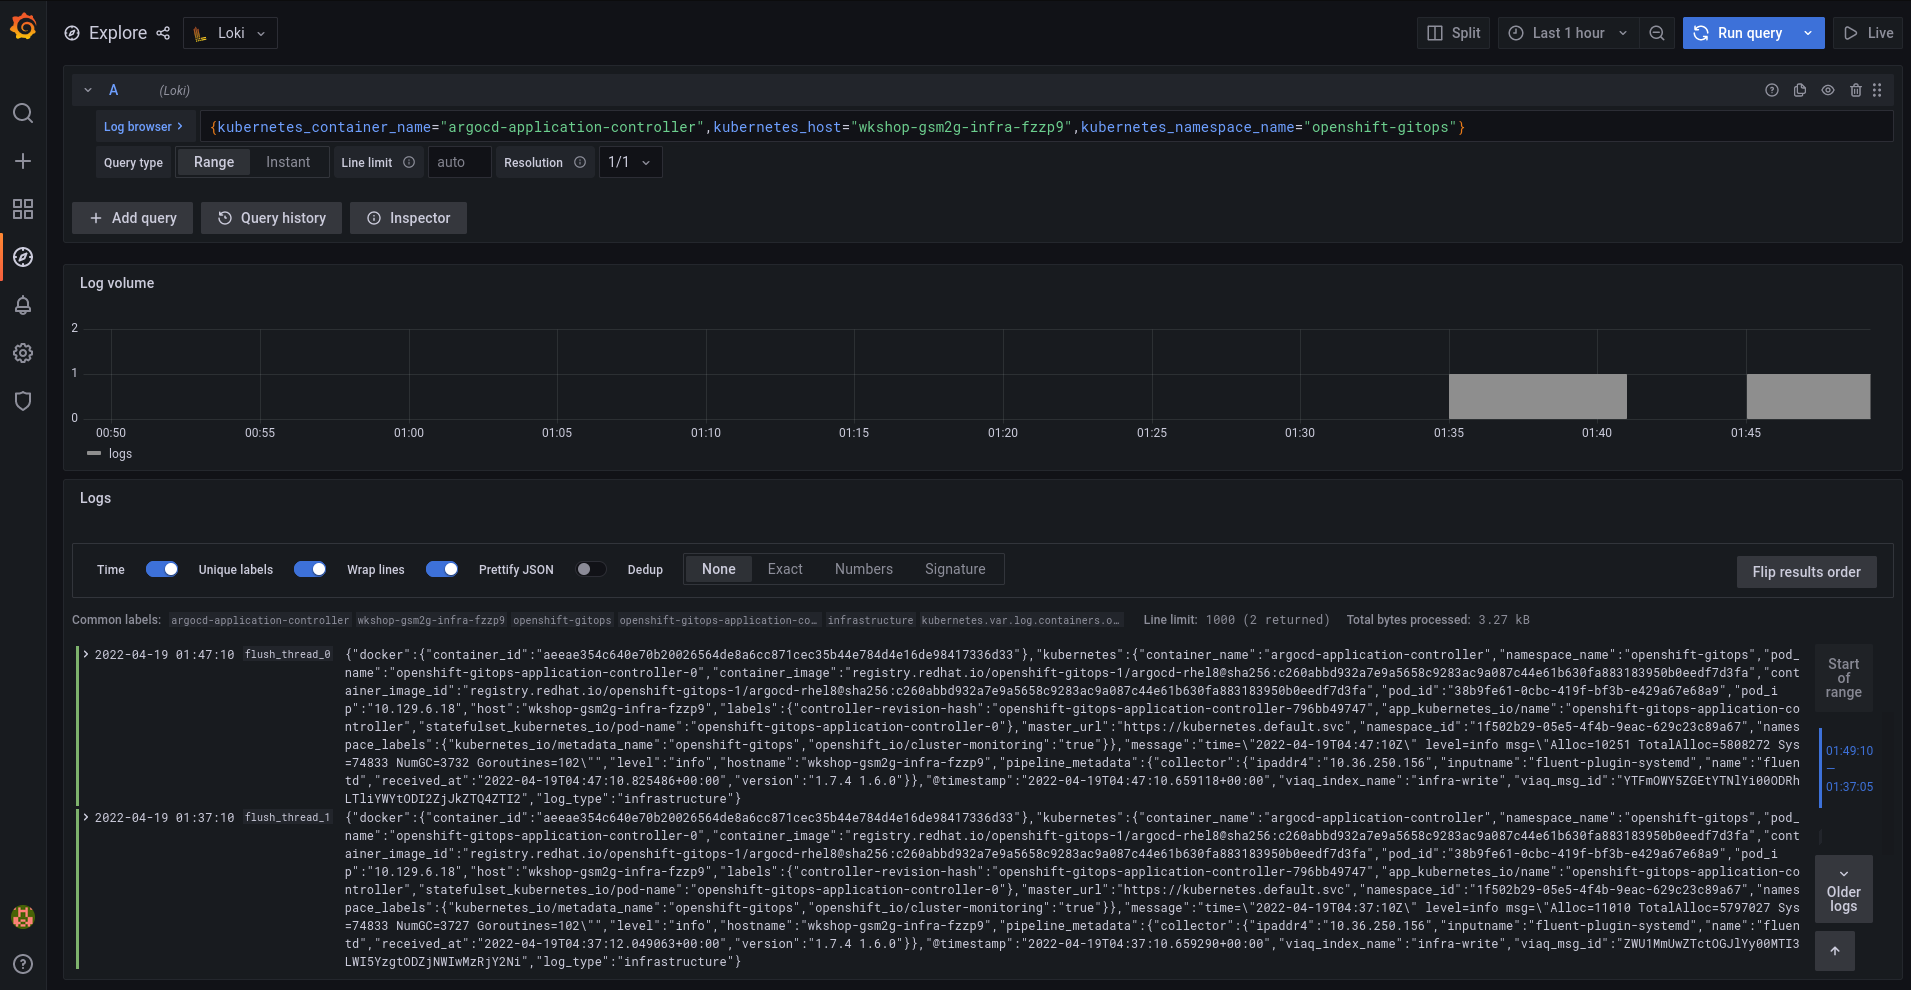
- Now back in Grafana, we can run the query below to validate that our logs are being successfully received from OpenShift
{log_type="application"}
- For more query and filter options, click the "
Log browser" button, then select the items you want to query and then "Show logs"
Example:
{kubernetes_container_name="argocd-application-controller",kubernetes_host="wkshop-gsm2g-infra-fzzp9",kubernetes_namespace_name="openshift-gitops"}
References:
執筆者紹介
チャンネル別に見る
自動化
テクノロジー、チームおよび環境に関する IT 自動化の最新情報
AI (人工知能)
お客様が AI ワークロードをどこでも自由に実行することを可能にするプラットフォームについてのアップデート
オープン・ハイブリッドクラウド
ハイブリッドクラウドで柔軟に未来を築く方法をご確認ください。
セキュリティ
環境やテクノロジー全体に及ぶリスクを軽減する方法に関する最新情報
エッジコンピューティング
エッジでの運用を単純化するプラットフォームのアップデート
インフラストラクチャ
世界有数のエンタープライズ向け Linux プラットフォームの最新情報
アプリケーション
アプリケーションの最も困難な課題に対する Red Hat ソリューションの詳細
仮想化
オンプレミスまたは複数クラウドでのワークロードに対応するエンタープライズ仮想化の将来についてご覧ください


