
Imagine you are working on an engine and need to tighten several bolts within a small space. Now, imagine you had the choice between a ratchet and a wrench. Would you rather make 100 quarter-turns? Or 25 full-turns? This is the level of improvement that htop brings to the table. A well-thought-out, modern interpretation of the top command, htop is my tool of choice for system analytics and process management.
The htop command makes many improvements over the original, the most prominent being in user experience. You can now scroll through the processes, and use point and click functionality. If you want to kill a specific process, scroll down to it and F9 it into oblivion. There is no need to search for the PID or have to use the kill command. Just point and click.
This command runs on Unix, Linux, and macOS. I used the newly released Fedora 31 distro for this demonstration. To install, just run:
$ sudo dnf install htop
You can see the command output in full in this article's title image, but we will break it down section by section as we go along.
Colors and graphs, oh my!
The first thing to notice is the color inclusion. Color is helpful in identifying specific information and is generally pleasing to the eye. After the chromatic shock, we come to the first graphical representation, which shows us CPU load and memory usage:
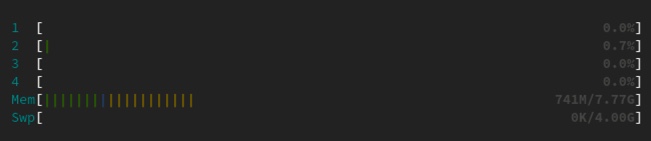
Notice the lines of various colors here in rows marked one through four. These rows represent CPU cores. These colors represent the following in the case of CPUs:
- Green: CPU utilization owned by normal users (percentage)
- Blue: CPU utilization by low priority processes
- Orange: CPU utilization by IRQ time
- Red: CPU utilization used by system processes
You will also find Mem(ory) and Sw(a)p. The colors for these sections are Green (Ram utilization by pages in memory) and Blue (RAM utilization by buffer pages).
You may see other colors here as well, but for the purpose of this breakdown we will focus on these. You can find more information online if needed.
Just to the right of the bar graph, you will find the following:
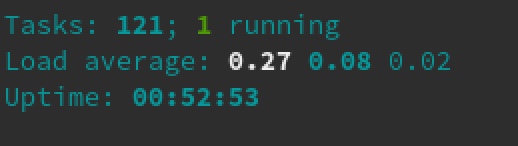
Let's break this down:
- 121 tasks (processes), 1 running
- Load Average: 0.27 0.08 0.02
- Uptime: 00:52:53
Only tasks that are consuming CPU will show as running, otherwise they can be listed as:
| Symbol | Description |
|---|---|
S |
Sleeping |
T/S |
Traced/Stopped |
Z |
Zombies |
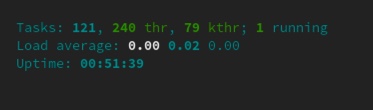
Note: You can use Shift+k to see the kernel threads and Shift+h to cycle the thread count on/off, as seen here:
As for the Load average, this is the same as top. Load average is calculated in three intervals: one minute, five minutes, and 15 minutes. These values refer to the amount of time the system has been active since the last reboot.
You can see the same information by running the uptime command.
Individual process breakdown
The headers above your process list are as follows, in order of when they appear from left to right:
| Symbol | Description |
|---|---|
PID |
Process ID number |
USER |
Process owner |
PRI |
Priority level by kernel |
N |
Priority set by user |
VIR |
Virtual memory being used |
RES |
Physical memory being used |
SHR |
Shared memory being used |
S |
Process state |
CPU% |
CPU usage |
MEM% |
Memory usage |
TIME+ |
Time since process started |
Command |
Full command being executed |
For more information on htop be sure to check the command's help section by pressing F1:

Try it out
The htop command is, in my opinion, an actual replacement for top. I actually have htop aliased on my systems in place of the standard tool. While I have had a great experience with htop, I recommend that you not take my word for whether it will work for you. Install it and try it out for yourself.
About the author
Tyler is the Sr. Community Manager at Enable Sysadmin, a submarine veteran, and an all-round tech enthusiast! He was first introduced to Red Hat in 2012 by way of a Red Hat Enterprise Linux-based combat system inside the USS Georgia Missile Control Center. Now that he has surfaced, he lives with his wife and son near Raleigh, where he worked as a data storage engineer before finding his way to the Red Hat team. He has written numerous technical documents, from military procedures to knowledgebase articles and even some training curricula. In his free time, he blends a passion for hiking, climbing, and bushcraft with video games and computer building. He is loves to read and enjoy a scotch or bourbon. Find him on Twitter or on LinkedIn.
More like this
What's new with image builder for Red Hat Enterprise Linux 10.2 and 9.8
Red Hat has updated the RISC-V Developer Preview
Operating System Management | Compiler
OS Wars_part 1 | Command Line Heroes
Browse by channel

Automation
The latest on IT automation for tech, teams, and environments

Artificial intelligence
Updates on the platforms that free customers to run AI workloads anywhere

Open hybrid cloud
Explore how we build a more flexible future with hybrid cloud

Security
The latest on how we reduce risks across environments and technologies

Edge computing
Updates on the platforms that simplify operations at the edge

Infrastructure
The latest on the world’s leading enterprise Linux platform

Applications
Inside our solutions to the toughest application challenges
Virtualization
The future of enterprise virtualization for your workloads on-premise or across clouds