
This article shows how to integrate Red Hat OpenShift-based Prometheus monitoring with ServiceNow workflows. This process is similar with any API-enabled IT service management (ITSM) tool.
[ Compare Red Hat OpenShift and Kubernetes. ]
Prerequisites
You need the following prerequisites to complete the example project:
- A fully configured Prometheus instance with alerting enabled on the target namespace where you create the alerts
- A basic understanding of the OpenShift monitoring stack
- A working ITSM tool that can be managed with an API, such as the ServiceNow instance I'll use in this article
- An understanding of Node.js
Source code example
I have provided a Git repo with the sample reference template for you to configure.
Build the proxy for your ITSM tool
I will use a ServiceNow developer instance to show the construction of this integration, but the logic is essentially the same for any ITSM tool. The Git repo contains an app folder with a simple one-page Node.js code sample to construct a container image you can customize for your needs.
First, prepare the server.js file. Open the file app/server.js. This file contains an Express-based app that receives data as a webhook from Prometheus. (I will show how to configure Prometheus webhooks on OpenShift later in the article.)
The request received from Prometheus is a POST request. Use a simple function to capture the body of the post and send it to be parsed by the requestParse function.
To view a sample request body format, refer to the webhook configurations.
app.post('/',jsonParser, async (req, res) => {
  await requestParse(req.body)
  res.send('Success');
});
The file contains five essential functions:
- requestParse
- itsmLogin
- constructUniqueString
- searchQuery
- createRecord, updateRecord, deleteRecord
I will show you how to customize each of the above functions to meet your needs.
[ Want to test your sysadmin skills? Take a skills assessment today. ]
1. Request parser
The requestParse function is the main control function that decides which operations to perform.
Prometheus provides the webhook body, which contains multiple alerts grouped together. It is necessary to write a for loop in the alerts section. However, before you can iterate on the foreach loop, you must log in.
Here is a sample request received:
{
  "receiver": "servicenow",
  "status": "firing",
  "alerts": [
{
      "status": "firing",
      "labels": {
        "alert": "servicenow",
        "alertname": "ExampleAlert",
        "namespace": "prom-snow"
      },
      "annotations": {},
      "startsAt": "2023-01-19T21:22:07.846Z",
      "endsAt": "0001-01-01T00:00:00Z",
      "generatorURL": "https://thanos-querier-openshift-monitoring.apps-crc.testing/api/graph?g0.expr=vector%281%29&g0.tab=1",
      "fingerprint": "d0212c4c33b62441"
    }
  ],
  "groupLabels": {
    "namespace": "prom-snow"
  },
  "commonLabels": {
    "alert": "servicenow",
    "namespace": "prom-snow"
  },
  "commonAnnotations": {},
  "externalURL": "https:///console-openshift-console.apps-crc.testing/monitoring",
  "version": "4",
  "groupKey": "{}/{alert=\"servicenow\"}:{namespace=\"prom-snow\"}",
  "truncatedAlerts": 0
}
After the login function itsmLogin, you need to create a unique fingerprint for each alert. This unique identifier queries the ITSM server to decide if a request must be created, updated, or marked as closed.
The unique string, which determines the operation to be performed, is accomplished by the constructUniqueString function.
The searchQuery function returns a search result from the ITSM tool to see if a record exists and helps decide the type of operation to perform. The if else conditions are a mechanism to determine the operation using the search results.
// The Request parse function
const requestParse = async (body) => {
  const login = await itsmLogin();
  body.alerts.forEach(async (alert) => {
        try {
                  console.log(alert)
                  const result = await searchQuery(login,constructUniqueString(alert))
                  if(result.length == 0 && alert.status === "firing") {  // no record exists create new record
                    await createRecord(login,constructUniqueString(alert),alert)
                  } else if(result.length == 1 && alert.status === "firing") { // update record with last info
                    await updateRecord(login,result[0].sys_id,alert)
                  } else if(result.length == 1 && alert.status === "resolved") { // resolve record
                    await closeRecord(login,result[0].sys_id,alert)
                  } else { // somthing is wrong
                    console.log("more than 1 record found for search criteria")
                    console.log(alert)
                    console.log("Search string: "+constructUniqueString(alert))
                  }
         }
         catch (e) {
          console.log(e)
         }
    });
};
2. ITSM login function
The itsmLogin function is fired once per webhook received from Prometheus and is responsible for logging in to your ITSM. Depending on your chosen ITSM tool or auth method, the REST request may change. The end goal of this request is to return a Bearer token for further calls.
Note: You can replace all the variables with environment data using process.env.VARIABLE_NAME by collecting data from the container/pod environment. This can be injected using standard mechanisms such as secret/config maps.
//Authentication into your ITSM tool

const  itsmLogin = async () => {
  const itsmLoginRequestConstruct ={
    baseURL: "https://<your service now>.service-now.com/oauth_token.do",
    method: "POST",
    rejectUnauthorized: false,
    data: querystring.stringify({
      grant_type: 'password',
      client_id: '<sample>', // Process.env.client_id  to obtain from environment variables
      client_secret: '<sample>', // Process.env.client_secret  to obtain from environment variables
      username: '<sample>', // Process.env.username  to obtain from environment variables
      password: '<sample>'  // Process.env.password  to obtain from environment variables
      }),
    headers: {
      'Content-Type': 'application/x-www-form-urlencoded'
    }
  }
  const login = await axios.request(itsmLoginRequestConstruct)
  return login.data
}
3. Construct a unique fingerprint
The constructUniqueString function has an input variable of the alert JSON and returns a unique string to create or find a specific ticket on your ITSM tool.
Note: Ensure this string is unique enough that ITSM will never return more than one record.
// the below function returns a unique string per alert raised/resolved.

const constructUniqueString = (alert) => {
  return  alert.labels.alertname +"-"+ alert.labels.namespace+"-"+alert.fingerprint
}
4. The search criteria
The searchQuery function searches the ITSM tool. You can construct the request object in many ways to suit your needs. In the case below, my unique identifier is the short_description field. The REST call can be constructed to search for any field that contains the unique string. However, ensure the query returns no more than one record.
The header is populated with the login token obtained from the login function:
  const itsmSearchConstruct ={
    baseURL: "https://<your service now>.service-now.com/api/now/table/incident",
    method: "GET",
    rejectUnauthorized: false,
    params: {
      sysparm_limit: 10,
      short_description: uniqueString
    },
    headers: {
      'Content-Type': 'application/x-www-form-urlencoded',
      'Authorization': 'Bearer '+login.access_token
    }
  }
  const searchResult = await axios.request(itsmSearchConstruct)
  return searchResult.data.result
5. The create, update, and closed methods
These three functions, represented by createRecord, updateRecord, and closeRecord in the server.js file, execute based on the control function requestParse.
When creating a new record, ensure the unique fingerprint is set on any field, such that the search function searchQuery can retrieve the record using the unique fingerprint field.
Ensure the updateRecord does not modify the unique field. However, you can change all other fields in the ITSM record.
The resolve function will usually be triggered by the last call made by Prometheus with that fingerprint. Prometheus sets alert.status to resolved. This is a clear indication that the request or incident can be resolved.
Add more fields as you see fit to all three functions. Labels are available through alert.label.. Environment variables are available as process.env.
[ Get the Kubernetes cheat sheet. ]
Build the proxy and generate the test alert
Build the proxy app using the container image Sample Containerfile in the app folder. You can build and deploy the image after configuring it using the steps above. Ensure all credentials are passed as environment variables and as secrets.
Refer to the OpenShift documentation for deployment information.
Create an alert with label matcher alert=servicenow:
apiVersion: monitoring.coreos.com/v1
kind: PrometheusRule
metadata:
  creationTimestamp: null
  labels:
    prometheus: example
    role: alert-rules
  name: prometheus-example-rules
spec:
  groups:
  - name: ./example.rules
    rules:
    - alert: ExampleAlert
      expr: vector(1)
      labels:
        alert: servicenow  ### this is a unique identifier to send requests on the webhook , this should match the next steps
        description: This is an example alert
        closenotes: if required to be added for audit purposed during closure
        ### any label you add here can be used inside javascript . accessible via alert.labels.closenotes in the create/update/resolve functions.
For more details on creating alerts and configuring webhooks, consult the Managing alerts documentation.
Create a receiver webhook
Your URL may be different based on your service. Depending on how you set up the service, you may want to add the http://{svc}:port in the URL field of the Edit Webhook Receiver interface:
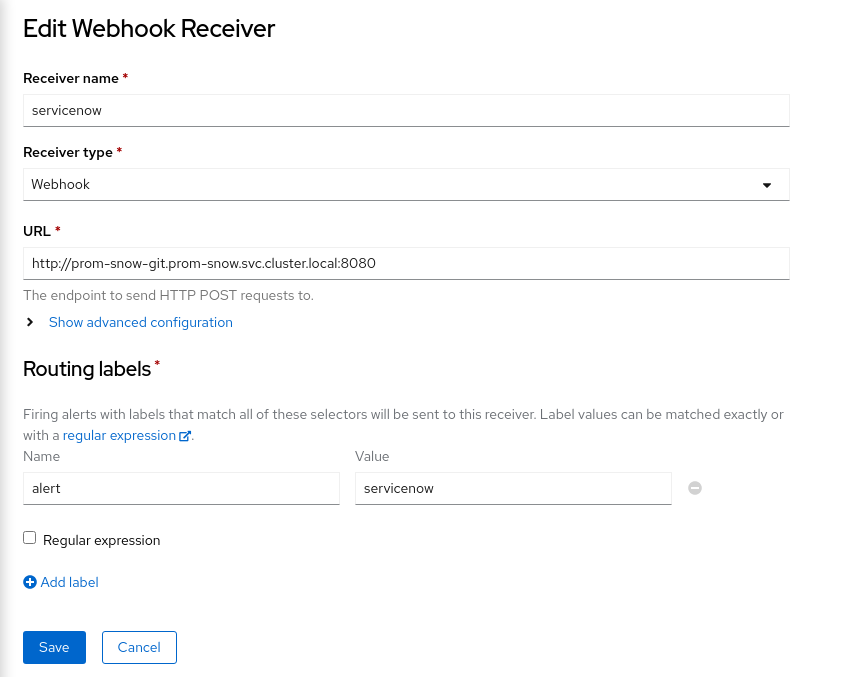
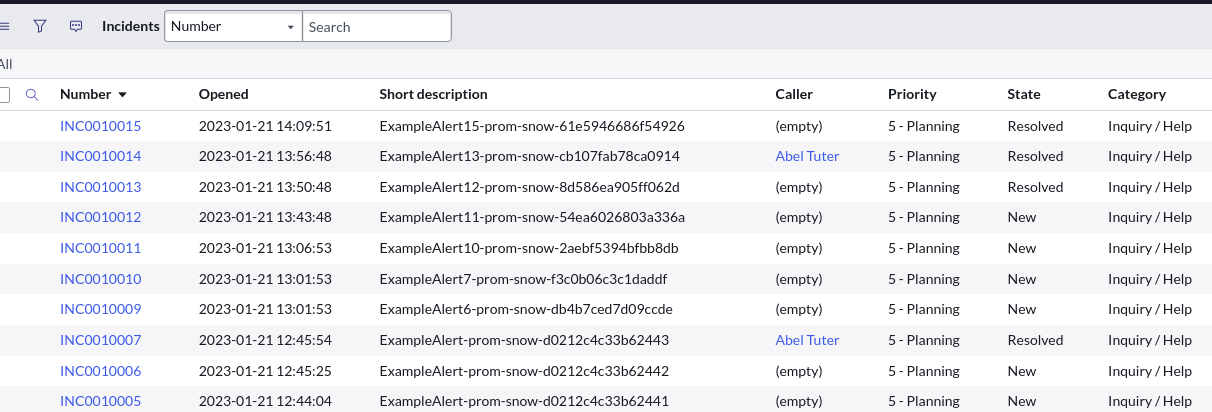
The next time alert fires, you will notice the output in the logs of the proxy container. This indicates that the proxy image has received the webhook and will start the sending process to ServiceNow. Once the request completes, you should see the request in ServiceNow.
Similarly, once the alert is resolved, the ServiceNow record also resolves. It may take a few minutes for Prometheus to detect the alert resolution and send the webhook.
Wrapping up
There are many steps to set this up, but once you have built it, it will have long-term benefits by integrating alerting with your existing ITSM process flow.
Any labels set on the Prometheus alerts are passed onto the webhook body, similar to alert=servicenow. You can set additional labels like description, short_description, owner, and close notes to be added when resolved. Pass these to the webhook and set it using the createRecord, updateRecord, and resolveRecord functions for the ITSM record.
If I encounter a failed state and need to recover, I rely on the OpenShift liveness probe, which works well for this example and is less complex. In your production code, you may want to add more error handling.
[ Learn about upcoming webinars, in-person events, and more opportunities to increase your knowledge at Red Hat events. ]
About the author
Gaurav Shankar is a Senior App Dev Consultant at Red Hat Canada, where he specializes in application development on OpenShift.
He has been an application architect for over 10 years, working in a variety of applications like databases, ETL tools, web servers, Java, NodeJS, Ansible, React, and more. He is the creator and maintainer of the open source project Datatrucker.IO which is a no-code API backend.
Gaurav enjoys spending time exploring new tech, building new tools, and playing with his kid and his dog.
More like this
The evolution of infrastructure automation in the age of AI: 4 key takeaways from Red Hat Summit 2026
From alert fatigue to automated action: Automated patching in the AI era
Untangling Networks | Compiler
Operating System Management | Compiler
Browse by channel

Automation
The latest on IT automation for tech, teams, and environments

Artificial intelligence
Updates on the platforms that free customers to run AI workloads anywhere

Open hybrid cloud
Explore how we build a more flexible future with hybrid cloud

Security
The latest on how we reduce risks across environments and technologies

Edge computing
Updates on the platforms that simplify operations at the edge

Infrastructure
The latest on the world’s leading enterprise Linux platform

Applications
Inside our solutions to the toughest application challenges
Virtualization
The future of enterprise virtualization for your workloads on-premise or across clouds