This is the sixth in Red Hat Ceph object storage performance series. In this post we will take a deep dive and learn how we scale tested Ceph with more than one billion objects, and share the performance secrets we discovered in the process. To better understand the performance results shown in this post, we recommend reviewing the first blog , where we detailed the lab environment, performance toolkit, and methodology used.
Executive Summary
-
Read: Observed consistent aggregated throughput (Ops) and read latency.
-
Write: Observed consistent write latency until the cluster reached approx. 90% of its capacity.
-
During the entire test cycle, we did not observe any bottlenecks on CPU, Memory, HDDs, NVMe, Network. Nor did we observe any issues with the Ceph daemons that would indicate that the cluster had difficulty with the volume of stored objects.
-
This testing was performed on a relatively small cluster.The combinatorial effect of meta-data spilling over to slower devices and the heavy usage of cluster's capacity affected overall performance. This can be mitigated by right sizing Bluestore meta-data devices and maintaining enough free capacity in the cluster.
Performance Summary
-
Successfully ingested more than one billion (1,014,912,090 to be precise) objects, distributed across 10K buckets via S3 object interface into Ceph cluster, with zero operational or data consistency challenges. This demonstrates the scalability and robustness of a Ceph cluster.
-
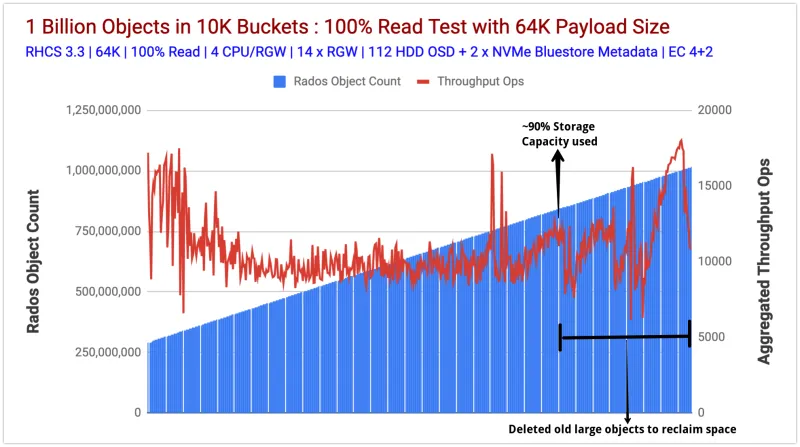
When the object population in the cluster approached 850 million, we ran short of storage capacity. When the cluster fill ratio reached ~90% we needed to make space for more objects, so we deleted larger objects from previous tests and activated the balancer module. Combined they created additional load, which we believe reduced client throughput and increased the latency..
-
The detrimental write performance is a reflection of Bluestore meta-data spill-over from flash to slow media. For use cases that involve storing billions of objects, it's recommended to appropriately size SSDs for Bluestore metadata (block.db) to avoid spillover of RocksDB levels to slower media.
-
Using bluestore_min_alloc_size = 64KB caused significant space amplification for small erasure coded objects.
-
Reducing bluestore_min_alloc_size eliminated the space amplification problem, however because 18KB was not 4KB aligned it resulted in reduced object creation rate.
-
The default bluestore_min_alloc_size for SSDs will change to 4KB in RHCS 4.1, and work is underway to make 4KB suitable for HDD as well.
-
For bulk delete operations, S3 object deletion API found to be significantly slower compared to Ceph Rados APIs. As such we recommend using either object expiration bucket lifecycles, or the radosgw-admin tool for bulk delete operations.
Test Methodology
To ingest one billion objects into the Ceph cluster, we used COSBench and performed several hundreds of test rounds, where each round comprises of
-
Creation of 14 new buckets.
-
Ingestion (aka write) of 100,000, 64KB payload sized objects per bucket.
-
Reading as many written objects as possible in a 300 seconds period.
Performance Results
Ceph is designed to be an inherently scalable system. The billion objects ingestion test we carried out in this project stresses a single, but very important dimension of Ceph’s scalability. In this section we will share our findings that we captured while ingesting one billion objects to the Ceph cluster.
Read performance
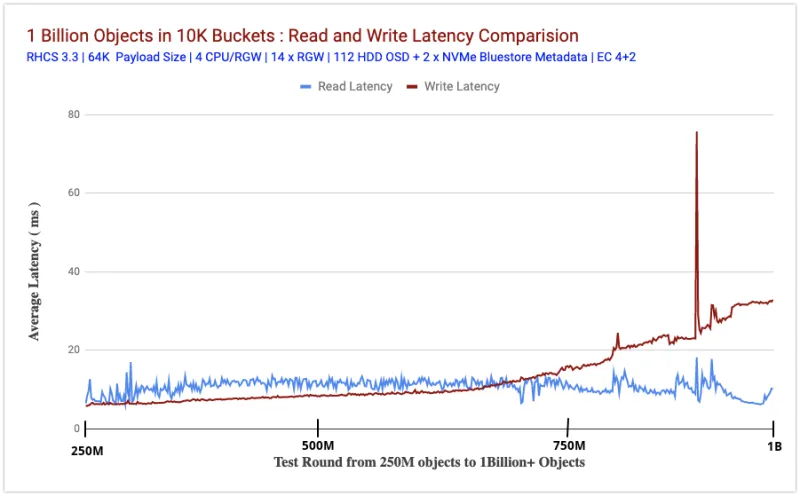
Chart 1 represents read performance measured in aggregated throughput (ops) metrics. Chart 2 shows average read latency, measured in milliseconds (blue line). Both of these charts show strong and consistent read performance from the Ceph cluster while the test suite ingested more than one billion objects. The read throughput stayed in the range of 15K Ops - 10K Ops across the duration of the test. This variability in performance could be related to high storage capacity consumption (~ 90%) as well as old large objects deletion and re-balancing operation occuring in the background.

Chart 1: Object Count vs Aggregated Read Throughput Ops
Chart 2 compares the average latency in milliseconds (measured from the client side) for both read and write tests, as we ingested the objects. Given the scale of this test, both read and write latencies, stayed very consistent until we ran out of storage capacity and high amount of Bluestore meta-data spill-over to slow devices.
The first half of the test shows that write-latency stayed lower compared to the reads. This could possibly be a Bluestore effect. The performance tests we did in the past showed a similar behaviour where Bluestore write latencies are found to be slightly lower than Bluestore read latencies, possibly because Bluestore does not rely on Linux page cache for read aheads and OS level caching.
In the later half of the test, read latency stayed lower compared to write, which could be possibly related to the Bluestore meta-data spill over from flash to slow HDDs (explained in the next section).

Chart 2 : Read and Write Latency Comparison
Write performance
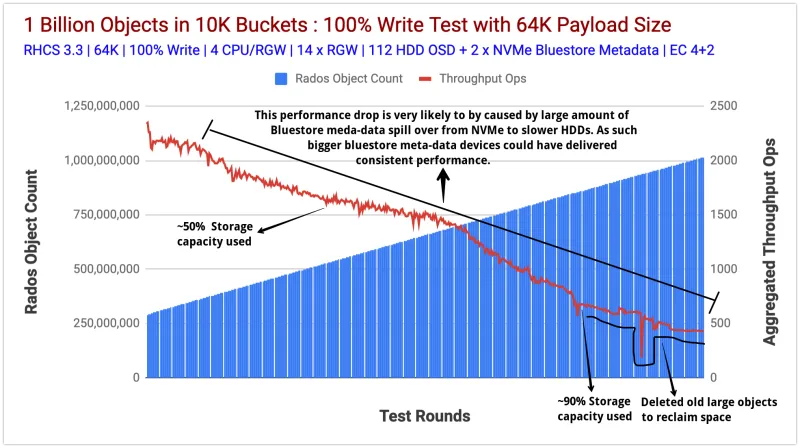
Chart 3 represents ingestion (write operations) of one billion 64K objects to our Ceph cluster through its S3 interface. The test started at around 290 Million objects which were already stored in the Ceph cluster.
This data that was created by the previous test runs, which we chose not to delete and started to fill the cluster from this point until we reached more than one billion objects. We executed more than 600 unique tests and filled the cluster with one billion objects. During the course, we measured metrics like total object count, write and read throughput (Ops), read and write average latency(ms) etc.
At around 500 million objects, the cluster reached 50% of its available capacity and we observed a down trend in aggregated write throughput performance. After several hundreds of tests, aggregated write throughput continues to go down, while cluster used capacity reached to an alarming 90%.
From this point, in order for us to reach our goal i.e. ingesting one billion objects, we needed more free capacity, hence we deleted / re-balanced old objects which were larger than 64KB.
Generally, as we know the performance of storage systems declines gradually as the overall consumption grows. We observed a similar behavior with Ceph, at approx 90% of used capacity, aggregated throughput declined compared to what we started with initially. As such, we believe that had we added more storage nodes to keep the utilized percentage low, the performance might not have suffered at the same rate as we have observed.
Another interesting observation, that could potentially be a reason for this declining aggregated performance is the frequent NVMe to HDD spillover of Bluestore metadata. We ingested approx one billion new objects, which generated a lot of Bluestore metadata, By design, Bluestore metadata gets stored in RocksDB, and it's recommended to have this partition on Flash media, in our case we used 80GB NVMe partition per OSD which is shared between Bluestore RocksDB and WAL.
RocksDB internally uses level style compaction, in which files in RocksDB are organized in multiple levels. For example Level-0(L0), Level-1(L1) and so on. Level-0 is special, where in-memory write buffers (memtables) are flushed to files, and it contains the newest data. Higher levels contain older data.
When L0 files reach a specific threshold (configurable using level0_file_num_compaction_trigger) they are merged into L1. All non-0 levels have a target size. RocksDB’s compaction goal is to restrict the data size in each level to be under the target. The target size is calculated as level base size x 10 as the next level multiplier. As such L0 target size is (250MB), L1 (250MB), L2(2,500MB), L3(25,000MB) and so on.
The sum of the target sizes of all levels is the total amount of RocksDB storage you need. As recommended by Bluestore configuration RocksDB storage should use flash media. In case we do not provide enough flash capacity to RocksDB to store its Levels, RocksDB spills the level data on to slow devices such as HDDs. After all, the data has to be stored somewhere.
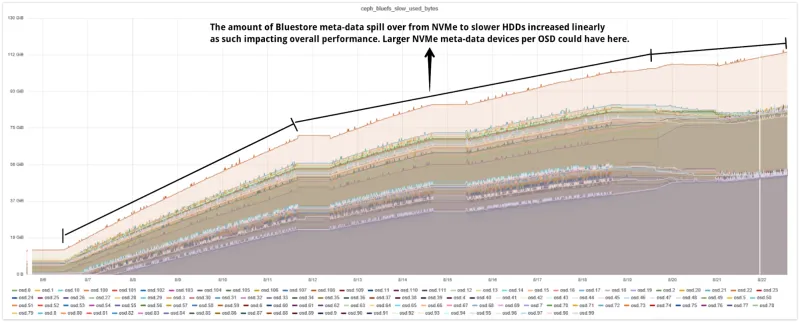
This spilling of RocksDB metadata from flash devices on to HDDs deteriorates the performance big time. As shown in chart-4 the spill-over meta-data reached north of 80+GB per OSD while we ingested the objects into the system.
So our hypothesis is that, this frequent spill-over of Bluestore metadata from flash media to slow media is the reason for decremental aggregated performance in our case.
As such, if you know that your use case would involve storing several billions of objects on Ceph cluster, the performance impact could potentially be mitigated by using large flash partitions per Ceph OSD for BlueStore (RocksDB) metadata, such that it can store at up to L4 files of RocksDB on flash.

Chart 3: Object Count vs Aggregated Write Throughput Ops

Chart 4: Bluestore Metadata Spill over to Slow (HDD) Devices
Miscellaneous Findings
In this section we want to cover some of our miscellaneous findings.
Deleting Objects at Scale
When we ran out of storage capacity in our cluster, we had no choice other than deleting old large objects stored in buckets and we had several millions of these objects. We initially started with S3 API’s DELETE method, but we soon realised that it's not applicable for bucket deletion, as such all the objects from the bucket must be deleted before the bucket itself could be deleted.
Another S3 API limitation we encountered is that it can only delete 1K objects per API request. We had several hundreds of buckets and each with 100K objects, so it was not practical for us to delete millions of objects using S3 API DELETE method.
Fortunately deleting buckets loaded with objects is supported using the native RADOS Gateway API which are exposed using radosgw-admin CLI tool. By using native RADOS Gateway API, it took us a few seconds to get rid of millions of objects. Hence for deleting objects at any scale Ceph’s native API comes to rescue.
Tinkering with the bluestore_min_alloc_size_hdd parameter
This testing was done on an erasure coded pool with a 4+2 configuration. Hence by design every 64K payload has to be splitted into 4 chunks of 16KB each. The bluestore_min_alloc_size_hdd parameter used by Bluestore, represents the minimal size of the blob created for an object stored in Ceph Bluestore objectstore and its default value is 64KB. Therefore in our case each 16KB EC chunk would be allocated with 64KB space, which will cause 48KB overhead of unused space, that cannot be further utilized.
So after our 1 Billion Object ingestion test, we decided to lower bluestore_min_alloc_size_hdd to 18KB and re-test. As represented in chart-5, the object creation rate found to be notably reduced after lowering the bluestore_min_alloc_size_hdd parameter from 64KB (default) to 18KB. As such, for objects larger than the bluestore_min_alloc_size_hdd , the default values seems to be optimal, smaller objects further require more investigation if you intended to reduce bluestore_min_alloc_size_hdd parameter. Note that, the bluestore_min_alloc_size_hdd cannot be set lower then the bdev_block_size (default 4096 - 4kB).

Chart 5: Object ingestion rate per minute
Summary & up next
In this post, we demonstrated the robustness and scalability of a Ceph cluster by ingesting one billion plus objects into the cluster. We learned about various performance characteristics associated with a cluster which is at its maximum capacity as well as how bluestore meta-data spill over to slow devices can shave performance, with mitigations that you can opt for while designing your Ceph clusters for scale. In the next blog, we will look at some random performance tests done on the cluster.
About the author
More like this
Implementing best practices: Controlled network environment for Ray clusters in Red Hat OpenShift AI 3.0
Friday Five — December 12, 2025 | Red Hat
Technically Speaking | Platform engineering for AI agents
Technically Speaking | Driving healthcare discoveries with AI
Browse by channel
Automation
The latest on IT automation for tech, teams, and environments
Artificial intelligence
Updates on the platforms that free customers to run AI workloads anywhere
Open hybrid cloud
Explore how we build a more flexible future with hybrid cloud
Security
The latest on how we reduce risks across environments and technologies
Edge computing
Updates on the platforms that simplify operations at the edge
Infrastructure
The latest on the world’s leading enterprise Linux platform
Applications
Inside our solutions to the toughest application challenges
Virtualization
The future of enterprise virtualization for your workloads on-premise or across clouds
