With Red Hat OpenShift 4.17, we continue to enhance the OpenShift observability offering. Observability plays a key role in monitoring, troubleshooting and optimizing OpenShift clusters. This article guides you through the latest features and integrations that help you improve the observability of your OpenShift environment.
Single pane of glass for cluster observability
September 2024 saw the release of Cluster Observability Operator 0.4.0, which enables the installation of specific observability components, such as a less-opinionated monitoring stack and UI plugins. This includes platform, visualization, analytics and profiles. Although 0.4.0 is a technology preview, it introduces several notable features:
- Traces UI Plugin - technology preview: With a brand new Perses-powered Gantt chart, OpenShift users can now explore trace details in a few clicks. Learn more in the distributed tracing section and in this blog article.
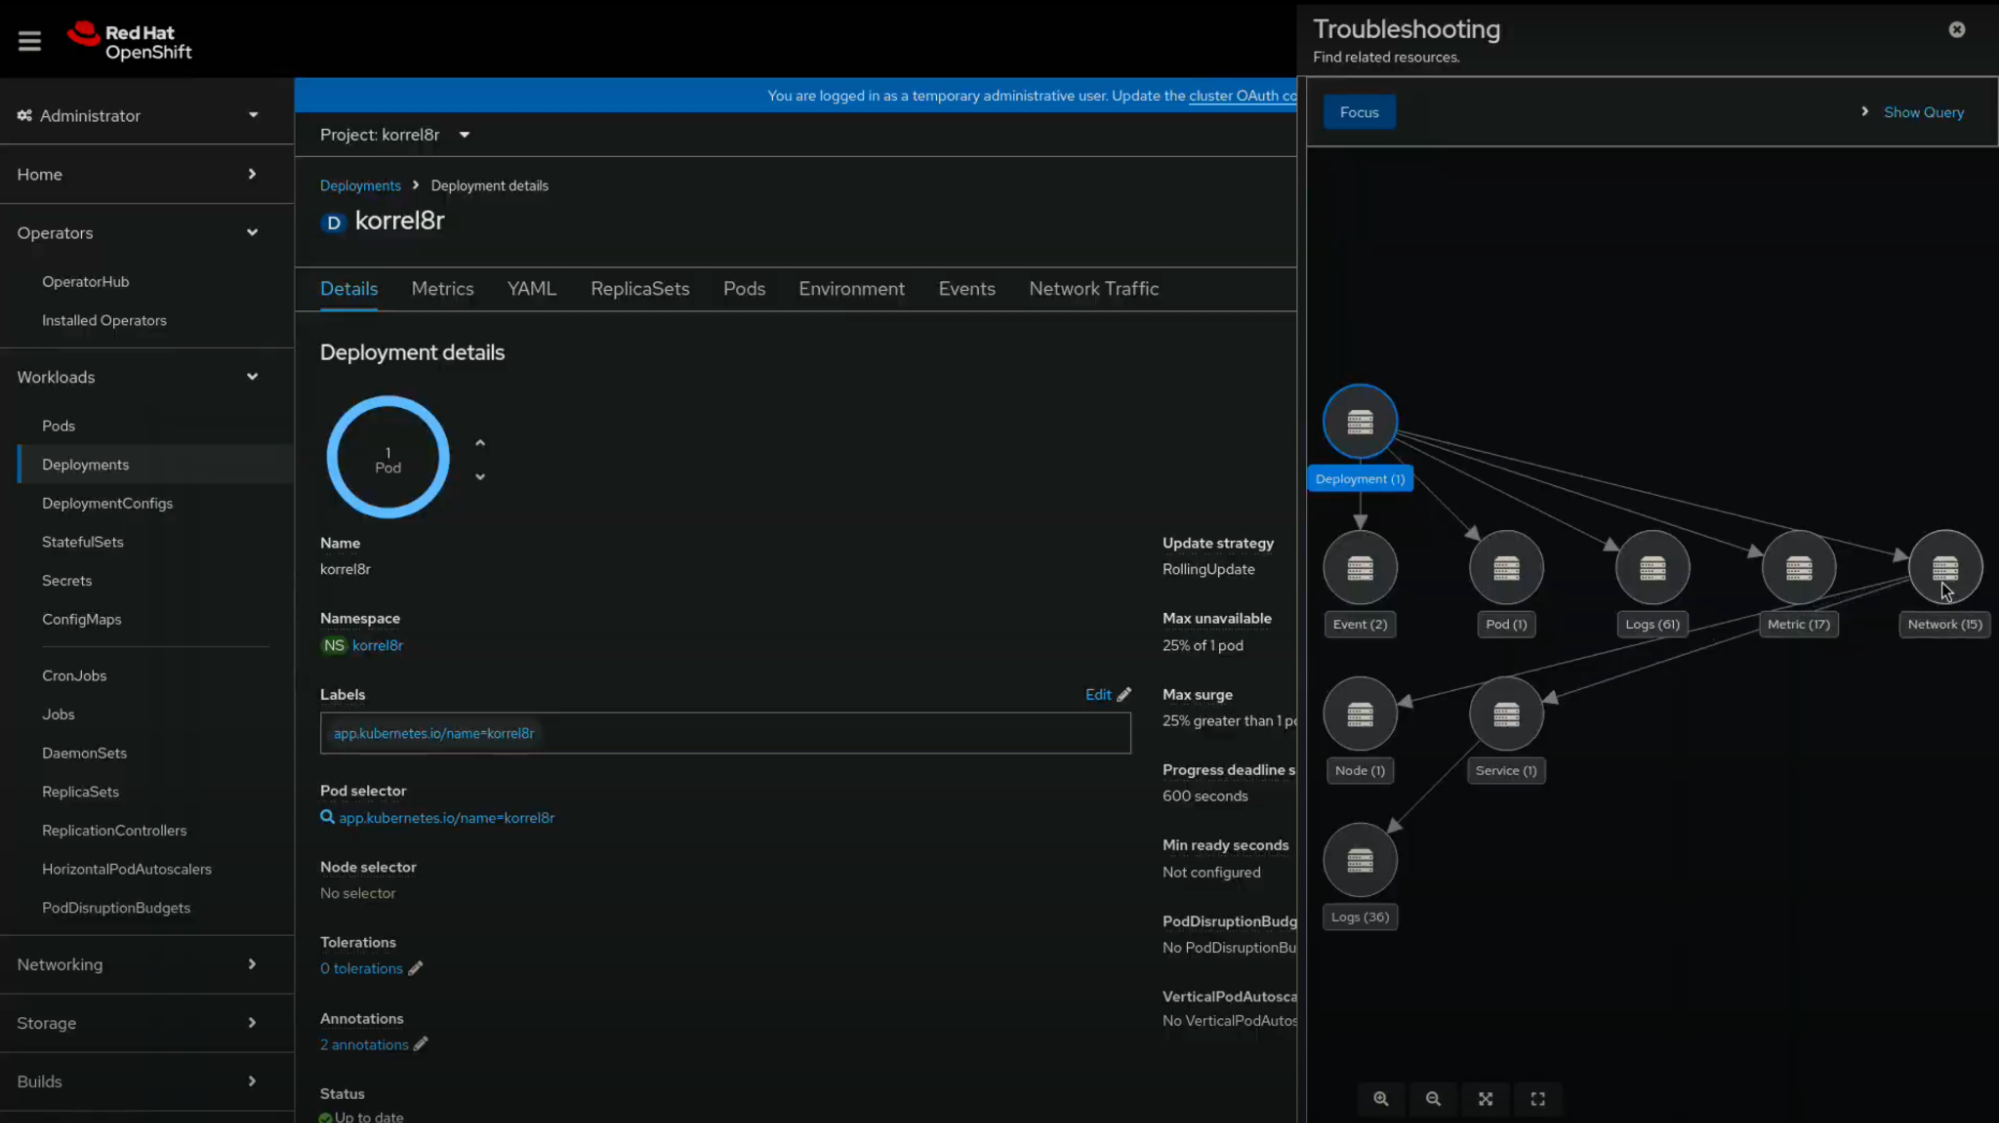
- Observability signal correlation - technology preview: Navigating correlated observability signals and Kubernetes resources has never been easier. Powered by Korrel8r, with an enhanced troubleshooting panel in the OpenShift web console, you can now more quickly detect the root cause of issues. Learn more in this dedicated blog article.
Observability troubleshooting journey
The observability troubleshooting journey initiative comprises key analytics features that together help OpenShift users troubleshoot issues more quickly. As mentioned above, with the latest Cluster Observability Operator release, you can use the technology preview of the observability signal correlation tool which includes an improved troubleshooting panel that provides a simplified navigation experience in the OpenShift web console. Note that the panel is interactive—by clicking on each node/icon, users are redirected to the relevant web console UI that displays that specific information/signal, such as pod, deployment, metric, etc.
Observability signal correlation’s backend is provided by the open source project Korrel8r, which, via a set of rules, correlates metrics, logs, alerts, netflows and additional signals and resources across data stores. Key improvements include:
- The troubleshooting panel now allows users to select and focus on a specific starting signal
- The troubleshooting panel can be triggered from the application launcher menu in the masthead of the OpenShift web console
- More visibility is given to Korrel8r’s queries, and the depth of investigation can be selected by the user

In-cluster monitoring
OpenShift comes with a preconfigured, preinstalled and self-updating monitoring stack that provides monitoring for core platform components. We are introducing a new feature to optimize metrics storage efficiency and to reduce the storage overhead by up to 50%. We are allowing Prometheus instances in the User Workload Monitoring (UWM) stack to tolerate scrape time jitter. This adjustment mitigates the impact of slight deviations in scrape timing, which can otherwise increase time series database (TSDB) storage requirements due to inefficient chunk compression. In high-availability (HA) configurations, these timing variations can result in a significant storage overhead—up to 50% more disk space usage. By enabling jitter tolerations, users can achieve better compression and reduce storage consumption, with the trade-off being a slight reduction in sample accuracy and potential effects on derivative metrics like running averages. This feature addresses the need for a balance between storage efficiency and data precision resulting in improved resource utilization in UWM environments.
Logging
As a cluster administrator, you can deploy the logging subsystem to aggregate all the logs from your OpenShift cluster, such as node system audit logs, application container logs and infrastructure logs. In the latest release, Logging 6.1, the Logging team is pleased to announce the technology preview of End-to-End OTLP (OpenTelemetry protocol) support. Logs that are collected by the Cluster Logging Operator can be forwarded via OTLP to an external OTLP enabled endpoint, or to the internal Loki log store.
In addition to receiving logs from the Cluster Logging Operator with OTLP, Loki will also be able to receive logs sent to it for storage from the Red Hat Build of OpenTelemetry, ensuring that platform and application logs can both be sent to the same log store.
Finally, logs sent from both the Cluster Logging Operator or the Red Hat Build of OpenTelemetry to Loki can be visualized in the OpenShift Observability UI. This ensures that logs sent from both operators are visualized in the same place.
Red Hat build of OpenTelemetry
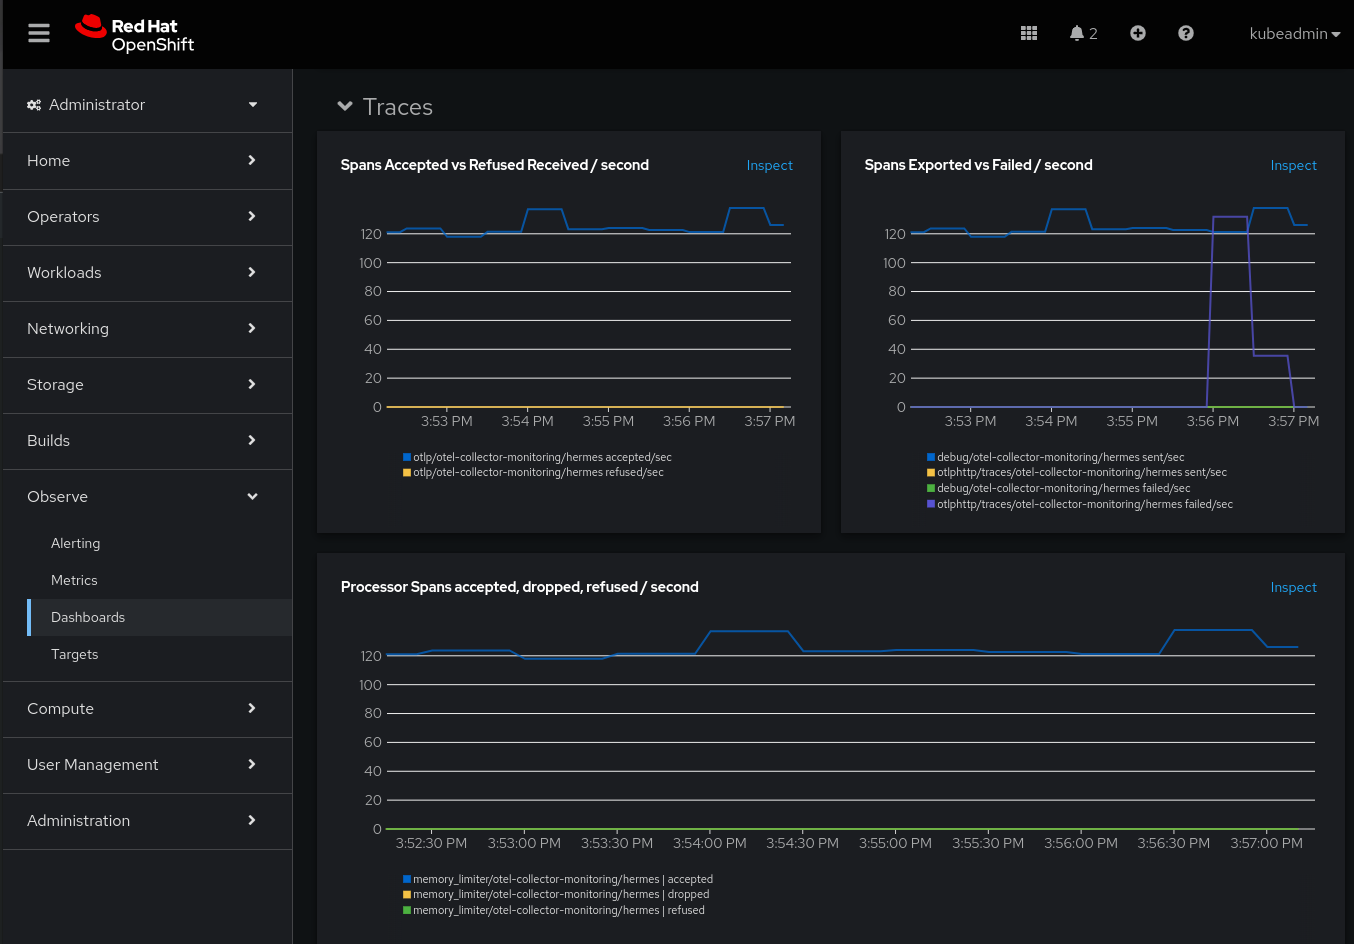
The Red Hat build of OpenTelemetry comes with added value to help users troubleshoot their observability pipelines. To understand the amount of observability data processed, ratios between ingested and rejected or even failed data, per-signal information and the amount of resources consumed by the OpenTelemetry collector, we've created a brand new dashboard in the OpenShift console.

Also, the Red Hat build of OpenTelemetry adds many components to the collector, such as metrics transform processor, group by attributes processor, routing connector, and Prometheus remote write exporter.
Read more here: Red Hat build of OpenTelemetry and OpenShift distributed tracing 3.3: New features for developers.
Distributed tracing
We are also excited to announce that, for the first time, users can now see distributed traces in a Gantt chart embedded in the Openshift console. Powered by Perses, and installed via a UI plugin from the Cluster Observability Operator (COO), the OpenShift Observability platform can now answer the needs of modern observability without the need of third-party tools. Check it out!

This important milestone comes right after the inclusion of the Bubble chart and tables for tracing just a few months back, and takes users one step closer to fully observing applications.
In the Gantt chart, when clicking on a specific span, a side panel on the right appears. This is important, because you now have context when checking:
- Which spans take more time
- The relationship between spans
- If there are any problematic spans
Read more here: Enhancements to the Traces UI in the OpenShift web console: Technology preview release | Red Hat Developer
Other relevant updates in distributed tracing include configuring temporary access to AWS S3 with AWS Security Token Service (STS), and TLS configuration via service annotation in Tempo.
Easier start with Network Observability
Two other new features landed in Network Observability 1.6.
Network Observability on demand
The Network Observability CLI (oc netobserv) is a lightweight flow and packet visualization tool. It deploys a NetObserv eBPF agent and flowlogs-pipeline on your Kubernetes cluster to collect flows or packets from nodes network interfaces and streams data to a single collector for analysis and visualization. This first version of the tool allows users to capture flows or packets running a simple command. It reuses the NetObserv components without the need to install and configure operator(s).
Read more here: Network observability on demand
Lightweight Network Observability Operator
The Network Observability Operator released version 1.6 added a major enhancement to provide network insights for your OpenShift cluster without the Loki log aggregation system. This enhancement was described in the What's new in Network Observability 1.6 article. Until this release, Loki was required to be deployed alongside Network Observability to store the network flows data.
In this article, we describe some of the advantages and trade-offs users would have when deploying the Network Observability Operator with Loki disabled. We also demonstrate where this lightweight stack has its benefits.
What’s next for Red Hat OpenShift Observability?
Stay tuned because, very soon, you'll be able to do Application Performance Monitoring right in the OpenShift console. Thanks to the OpenTelemetry community, we will also start delivering a streamlined integration experience, end-to-end, between cloud platforms, observability vendors and technologies, which makes OpenShift the "Default to Open" platform that we all love.
We are also continuing our efforts to bring analytics features and UI improvements in Cluster Observability Operator. The next release will bring closer integration of features announced here as technology preview with other observability signals and components.
We continue to be focused on providing a well-integrated Observability stack, working to reduce noise and so you can more easily understand and navigate within the different types of signals. We also want to make sure all this information can also be integrated within your preferred tools.
Wrap up
Ready to explore these new features? Visit the redhat.com/observability and documentation pages to learn more and get started with the latest observability tools in OpenShift.
The Red Hat’s Developers Observability page also contains information to help you learn about and implement observability capabilities.
We value your feedback! Share your thoughts and suggestions using the Red Hat OpenShift feedback form.
執筆者紹介
Roger Florén, a dynamic and forward-thinking leader, currently serves as the Principal Product Manager at Red Hat, specializing in Observability. His journey in the tech industry is marked by high performance and ambition, transitioning from a senior developer role to a principal product manager. With a strong foundation in technical skills, Roger is constantly driven by curiosity and innovation. At Red Hat, Roger leads the Observability platform team, working closely with in-cluster monitoring teams and contributing to the development of products like Prometheus, AlertManager, Thanos and Observatorium. His expertise extends to coaching, product strategy, interpersonal skills, technical design, IT strategy and agile project management.
Jamie Parker is a Product Manager at Red Hat who specializes in Observability, particularly in the Logging and OpenStack areas. At Red Hat, Jamie works with organizations and customers to learn about their needs within the ever changing Observability landscape, and based on their feedback, helps to guide upcoming products within the Red Hat Observability Platform. Jamie enjoys sharing lessons learned to the community by frequently speaking at meetups and conferences, and by blogging.
Vanessa is a Senior Product Manager in the Observability group at Red Hat, focusing on both OpenShift Analytics and Observability UI. She is particularly interested in turning observability signals into answers. She loves to combine her passions: data and languages.
Jose is a Senior Product Manager at Red Hat OpenShift, with a focus on Observability and Sustainability. His work is deeply related to manage the OpenTelemetry, distributed tracing and power monitoring products in Red Hat OpenShift.
His expertise has been built from previous gigs as a Software Architect, Tech Lead and Product Owner in the telecommunications industry, all the way from the software programming trenches where agile ways of working, a sound CI platform, best testing practices with observability at the center have presented themselves as the main principles that drive every modern successful project.
With a heavy scientific background on physics and a PhD in Computational Materials Engineering, curiousity, openness and a pragmatic view are always expected. Beyond the boardroom, he is a C++ enthusiast and a creative force, contributing symphonic and electronic touches as a keyboardist in metal bands, when he is not playing videogames or lowering lap times at his simracing cockpit.
チャンネル別に見る
自動化
テクノロジー、チームおよび環境に関する IT 自動化の最新情報
AI (人工知能)
お客様が AI ワークロードをどこでも自由に実行することを可能にするプラットフォームについてのアップデート
オープン・ハイブリッドクラウド
ハイブリッドクラウドで柔軟に未来を築く方法をご確認ください。
セキュリティ
環境やテクノロジー全体に及ぶリスクを軽減する方法に関する最新情報
エッジコンピューティング
エッジでの運用を単純化するプラットフォームのアップデート
インフラストラクチャ
世界有数のエンタープライズ向け Linux プラットフォームの最新情報
アプリケーション
アプリケーションの最も困難な課題に対する Red Hat ソリューションの詳細
仮想化
オンプレミスまたは複数クラウドでのワークロードに対応するエンタープライズ仮想化の将来についてご覧ください


