
The uptime command is straightforward and simple, but it can still be nice to see how some sysadmins use these common tools. Documenting the system's uptime may be important for service level agreements, performance monitoring, and general troubleshooting.
[ You might also like: Important Linux /proc filesystem files you need to know ]
The uptime command
The uptime command provides several useful results, depending on the information you need.
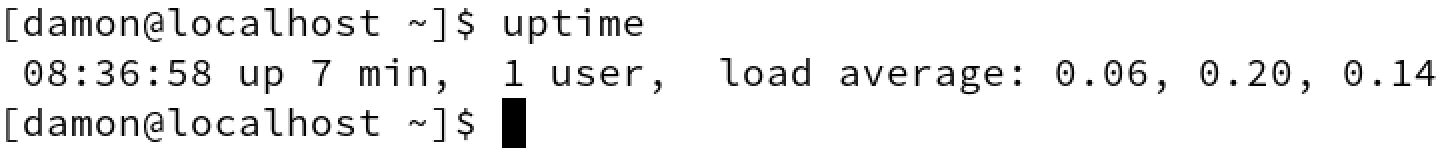
Breaking down the output here:
- Current time
- Up (the current status of the system)
- Total time the system has been running
- User count (number of current logged in users)
- System load averages over 1, 5, and 15 minutes
Note: The load average is based on both running and uninterruptable processes.
Documenting system uptime
So how can sysadmins use this information?
First, the command itself gives a quick look at a few general performance parameters. For example, you can see whether the system has restarted recently. You can also see how many users are logged in, letting you know whether the system is busy, if it can be rebooted, or even how useful the local services might be. Obviously, the ability to see the system load averages over time provides important system performance information.
Next, you can combine the uptime results with other commands to document the system's configuration and current status. Such a report might be important for service level agreements or general server availability queries by management. I have written a few quick examples of gathering system information below.
You can use general redirectors to document uptime results:
# uptime > system-doc.txt
Take a look at my recent article Five ways to use redirect operators in Bash for a reminder on using redirectors.
If there's already content in the system-doc.txt file, be sure to use the append redirector instead:
# uptime >> system-doc.txt
It is easy to combine the uptime results with the output of other commands to quickly report on the system's current status:
# date > system-doc.txt
# hostname >> system-doc.txt
# uptime >> system-doc.txt
# ip a >> system-doc.txt

There are plenty of ways to automate and streamline such commands.
The uptime options
The uptime command doesn't have many options. In fact, there are only four, and one of those is the help option to view the other three. That option is -h.
First, use the -p option to organize the uptime output into a "pretty" format. Using this option results in just the system's running time being displayed on the screen.

Redirect it into your documentation file like this:
# uptime -p >> system-doc.txt
Next, display the system date and time since the system started by using the -s option.

SCREEN uptime -s
Redirect it into your documentation file like this:
# uptime -s >> system-doc.txt
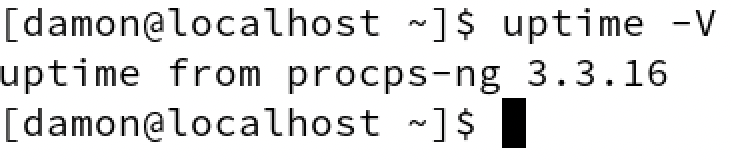
Finally, the -V option displays the version information for the uptime command.
# uptime -V
[ Getting started with containers? Check out this free course. Deploying containerized applications: A technical overview. ]
Wrap up
I think it's worth pointing out that the uptime results are also displayed in the first line of the top command's output. That's pretty handy information when troubleshooting performance issues using top. In that case, knowing the system load averages over the five and fifteen-minute ranges is good as related to the current information dynamically displayed in top. For a reminder on how to use and customize top, see this article here on Enable Sysadmin.
While the uptime command is simple, I think it's useful for displaying basic system information. It can answer questions regarding how long the system has been available and give a general idea of performance based on user load.
執筆者紹介
Damon Garn owns Cogspinner Coaction, LLC, a technical writing, editing, and IT project company based in Colorado Springs, CO. Damon authored many CompTIA Official Instructor and Student Guides (Linux+, Cloud+, Cloud Essentials+, Server+) and developed a broad library of interactive, scored labs. He regularly contributes to Enable Sysadmin, SearchNetworking, and CompTIA article repositories. Damon has 20 years of experience as a technical trainer covering Linux, Windows Server, and security content. He is a former sysadmin for US Figure Skating. He lives in Colorado Springs with his family and is a writer, musician, and amateur genealogist.
類似検索
Red Hat Enterprise Linux における SSH のポスト量子機能の強化
Red Hat Device Edge が NVIDIA Jetson Orin で実行可能に
Infrastructure At The Edge | Compiler
Operating System Management | Compiler
チャンネル別に見る

自動化
テクノロジー、チームおよび環境に関する IT 自動化の最新情報

AI (人工知能)
お客様が AI ワークロードをどこでも自由に実行することを可能にするプラットフォームについてのアップデート

オープン・ハイブリッドクラウド
ハイブリッドクラウドで柔軟に未来を築く方法をご確認ください。

セキュリティ
環境やテクノロジー全体に及ぶリスクを軽減する方法に関する最新情報

エッジコンピューティング
エッジでの運用を単純化するプラットフォームのアップデート

インフラストラクチャ
世界有数のエンタープライズ向け Linux プラットフォームの最新情報

アプリケーション
アプリケーションの最も困難な課題に対する Red Hat ソリューションの詳細
仮想化
オンプレミスまたは複数クラウドでのワークロードに対応するエンタープライズ仮想化の将来についてご覧ください