Network Observability (NetObserv) is a Red Hat operator providing observability over all network traffic on a cluster by installing eBPF agents on nodes to generate flow logs. These flows are collected, stored, and converted into metrics so they can be queried from dashboards and so on.
What is Red Hat Advanced Cluster Management?
Red Hat Advanced Cluster Management provides end-to-end management visibility and control for managing a multi-cluster Kubernetes or Red Hat OpenShift environment. It can be deployed with an OLM operator, and is integrated with the OpenShift Console, with all managed clusters being supervised from a hub cluster console.
Combining Red Hat Advanced Cluster Management and NetObserv
Red Hat Advanced Cluster Management has an Observability add-on that uses Thanos and Prometheus federation to pull some of the metrics from the monitored clusters, automatically injecting cluster name and ID as metric labels. It provides an API to configure which additional metrics to pull.
On the other hand, NetObserv generates metrics out of the processed flow logs. They are pulled and stored by Prometheus, in each cluster where NetObserv is installed.
So it seems there could be a match between Red Hat Advanced Cluster Management and NetObserv?
(Spoiler: yes!) Let's dive into the details and set it up.
Pre-requisites
To set this up, you must have:
- A running OpenShift cluster, configured as a hub with Red Hat Advanced Cluster Management. For this blog, I've installed the Advanced Cluster Management for Kubernetes operator from the console Operator Hub, with the default
MultiClusterHubresource. - Other clusters imported in Red Hat Advanced Cluster Management. To do this, navigate to your OpenShift Console and select All Clusters from the drop-down menu in the top left.
- NetObserv operator installed and configured on each cluster you want to monitor. This can also be done from the OpenShift Console, using OperatorHub or Red Hat Advanced Cluster Management policies. There are templates you can install on the hub cluster. If you choose to use them, NetObserv install is triggered by adding the label
netobserv=trueon clusters, but at the time of writing, it does not cover installing Loki, which means you don't get full-featured NetObserv.
This blog has been tested with Red Hat Advanced Cluster Management 2.8 and 2.9, and NetObserv 1.4.2 and pre-release 1.5.
Configure NetObserv metrics
By default, NetObserv configures a small set of metrics:
namespace_flows_totalnode_ingress_bytes_totalworkload_ingress_bytes_total
For the purpose of this blog, I've enabled additional metrics. Note that the more metrics you enable, the more you may impact the performance of Prometheus. Monitor Prometheus resource usage carefully!
If you're running NetObserv 1.4.x or older, open the FlowCollector resource and find the property spec.processor.metrics.ignoreTags. Remove egress and packets.
If you're running NetObserv 1.5 or above, open the FlowCollector resource and find the property spec.processor.metrics.includeList. Set it up with:
namespace_flows_totalnode_ingress_bytes_totalworkload_ingress_bytes_totalworkload_egress_bytes_totalworkload_egress_packets_totalworkload_ingress_packets_total
Take a look at the available metrics if you want to customize this setup further.
If you are only interested in metrics, you don't need to install and enable Loki. While NetObserv doesn't currently provide the ability to view multi-cluster logs from Loki, these flow logs are still the most detailed and accurate data available when it comes to troubleshooting the network by cluster, providing a finer insight than metrics.
Metrics are the best for wide angle, aggregated view: ideal for a multi-cluster single pane of glass. Flow logs are the best for zoomed-in, detailed views: ideal for an in-cluster deep dive.
Start the observability add-on
If you already have observability configured in
Red Hat Advanced Cluster Management, you can skip this section.
To get started, follow the official documentation. This demonstrates how to configure access for metrics storage, including options for AWS S3, Google Cloud Storage, ODF, and others.
Proceed until you have created a MultiClusterObservability resource. Once you've got that set up, verify that the observability stack is up and running:
kubectl get pods -n open-cluster-management-observability -w
NAME                             READY STATUS  RESTARTS...
observability-alertmanager-0     3/3   Running   0
observability-alertmanager-1     3/3   Running   0
observability-alertmanager-2     3/3   Running   0
observability-grafana-6c998...   3/3   Running   0
observability-grafana-6c998...   3/3   Running   0
observability-observatorium...   1/1   Running   0
[...]
observability-thanos-store-...   1/1   Running   2
observability-thanos-store-...   1/1   Running   2
Configure pulling NetObserv metrics
To pull metrics, you must create a new ConfigMap declaring all metrics to be pulled from the federated Prometheus, along with recording rules:
kind: ConfigMap
apiVersion: v1
metadata:
  name: observability-metrics-custom-allowlist
  namespace: open-cluster-management-observability
data:
  metrics_list.yaml: |
    rules:
    # Namespaces
    - record: namespace:netobserv_workload_egress_bytes_total:src:rate5m
      expr: sum(label_replace(rate(netobserv_workload_egress_bytes_total[5m]),\"namespace\",\"$1\",\"SrcK8S_Namespace\",\"(.*)\")) by (namespace)
    - record: namespace:netobserv_workload_ingress_bytes_total:dst:rate5m
      expr: sum(label_replace(rate(netobserv_workload_ingress_bytes_total[5m]),\"namespace\",\"$1\",\"DstK8S_Namespace\",\"(.*)\")) by (namespace)
    - record: namespace:netobserv_workload_egress_packets_total:src:rate5m
      expr: sum(label_replace(rate(netobserv_workload_egress_packets_total[5m]),\"namespace\",\"$1\",\"SrcK8S_Namespace\",\"(.*)\")) by (namespace)
    - record: namespace:netobserv_workload_ingress_packets_total:dst:rate5m
      expr: sum(label_replace(rate(netobserv_workload_ingress_packets_total[5m]),\"namespace\",\"$1\",\"DstK8S_Namespace\",\"(.*)\")) by (namespace)

    # Namespaces / cluster ingress|egress
    - record: namespace:netobserv_workload_egress_bytes_total:src:unknown_dst:rate5m
      expr: sum(label_replace(rate(netobserv_workload_egress_bytes_total{DstK8S_OwnerType=\"\"}[5m]),\"namespace\",\"$1\",\"SrcK8S_Namespace\",\"(.*)\")) by (namespace)
    - record: namespace:netobserv_workload_ingress_bytes_total:dst:unknown_src:rate5m
      expr: sum(label_replace(rate(netobserv_workload_ingress_bytes_total{SrcK8S_OwnerType=\"\"}[5m]),\"namespace\",\"$1\",\"DstK8S_Namespace\",\"(.*)\")) by (namespace)
    - record: namespace:netobserv_workload_egress_packets_total:src:unknown_dst:rate5m
      expr: sum(label_replace(rate(netobserv_workload_egress_packets_total{DstK8S_OwnerType=\"\"}[5m]),\"namespace\",\"$1\",\"SrcK8S_Namespace\",\"(.*)\")) by (namespace)
    - record: namespace:netobserv_workload_ingress_packets_total:dst:unknown_src:rate5m
      expr: sum(label_replace(rate(netobserv_workload_ingress_packets_total{SrcK8S_OwnerType=\"\"}[5m]),\"namespace\",\"$1\",\"DstK8S_Namespace\",\"(.*)\")) by (namespace)

    # Workloads
    - record: workload:netobserv_workload_egress_bytes_total:src:rate5m
      expr: sum(label_replace(label_replace(label_replace(rate(netobserv_workload_egress_bytes_total[5m]),\"namespace\",\"$1\",\"SrcK8S_Namespace\",\"(.*)\"),\"workload\",\"$1\",\"SrcK8S_OwnerName\",\"(.*)\"),\"kind\",\"$1\",\"SrcK8S_OwnerType\",\"(.*)\")) by (namespace,workload,kind)
    - record: workload:netobserv_workload_ingress_bytes_total:dst:rate5m
      expr: sum(label_replace(label_replace(label_replace(rate(netobserv_workload_ingress_bytes_total[5m]),\"namespace\",\"$1\",\"DstK8S_Namespace\",\"(.*)\"),\"workload\",\"$1\",\"DstK8S_OwnerName\",\"(.*)\"),\"kind\",\"$1\",\"DstK8S_OwnerType\",\"(.*)\")) by (namespace,workload,kind)
That YAML defines Prometheus recording rules.
Red Hat Advanced Cluster Management offers two options for pulling custom metrics from the managed clusters. You can declare either:
- Metric names to pull
- Recording rules
The former is easier to configure but in many cases, this is probably not what you want. When pulling metrics from many sources, the key concept to have in mind is metrics cardinality. The more metrics you configure, the bigger the impact on Prometheus and Thanos resource usage and performance. "Cardinality" here does not refer to the number of record rules or names that we declare in this configuration - these are called metric families - after all, if you look closely, we only mention four distinct metric families in this config, which isn't a lot. No, what really matters with cardinality is the distinct count of all metric families and all their combinations of label keys and values.
Imagine a metric that provides per-pod information: this is a high cardinality. Imagine a metric that provides per-source pod and per-destination pod information: cardinality explodes. Imagine all of that, pulled from hundreds, thousands of clusters: I prefer not to.
Thankfully, in each cluster, NetObserv's metrics aren't per-pod, but per-workload. This is a first level of aggregation to tackle cardinality. So the cardinality of such metrics is capped at N², where N is the number of workloads in the cluster. For multi-cluster metrics, this is probably still too much, so we filter or aggregate further using recording rules. Also, multi-cluster dashboards don't have to go ultra deep in the level of details, they need to provide overviews, so we can keep the more detailed metrics just per-cluster, possibly with a smaller retention.
In the config shown above, we reduce the workload metrics cardinality to 2N by storing independently ingress metrics (per destination, without the source) and egress metrics (per source, without the destination). We also create other metrics more aggregated, per namespace. And finally, there is a set of metrics with special filters dedicated to watching traffic in and out of the cluster.
Creating the ConfigMap
Create this ConfigMap in your hub cluster (the one where the Red Hat Advanced Cluster Management operator is installed):
kubectl apply -f https://raw.githubusercontent.com/netobserv/documents/main/examples/ACM/netobserv-metrics.yamlIf you're using the NetObserv upstream (community) operator, metrics are only available as user workload metrics. The procedure to configure
Red Hat Advanced Cluster Management observability differs a little bit from what I'm doing here. The ConfigMap must be deployed in a different namespace, and the file key must be uwl_metrics_list.yaml.
Your new configuration is immediately detected by the metrics collector. To ensure that everything is working as expected, you can take a look at the logs:
kubectl logs -n open-cluster-management-addon-observability -l component=metrics-collector -fFrom this, you see a message such as Metrics pushed successfully. If you've made mistakes in your ConfigMap, you get errors in the logs, so review them closely.
Installing the dashboards
We're building two dashboards for the set of metrics configured. One shows an overview of clusters, and the other provides detail on each cluster. To install them:
kubectl apply -f https://raw.githubusercontent.com/netobserv/documents/main/examples/ACM/dashboards/clusters-overview.yaml
kubectl apply -f https://raw.githubusercontent.com/netobserv/documents/main/examples/ACM/dashboards/per-cluster.yaml
Viewing the dashboards
From the hub cluster console, select the All Clusters view:

Click the Grafana link.

The new dashboards are in the NetObserv directory. You can see the Clusters Overview:

You can see the overall in/out stats and top namespaces:
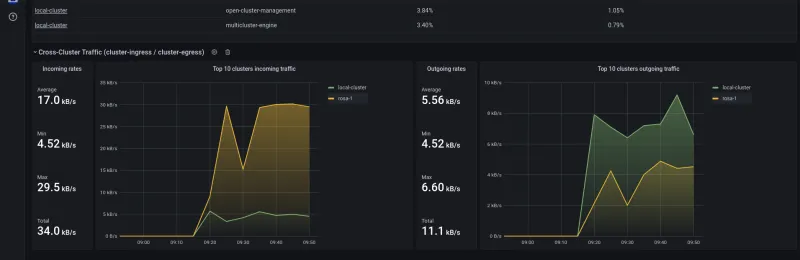
You can see the top namespaces:

You can view namespaces and workloads tables:

These dashboards provide a high level view of cluster metrics. For more detail, troubleshooting, and performance analysis, use the NetObserv plugin or metrics on a given cluster through the OpenShift Console. The metrics are more accurate there, with less aggregation and better resolution, and there are more details available in the raw flow logs (such as pod, port, IP, and interface information for each flow, and accurate timestamps) that aren't visible in metrics.
Customize your dashboard
You can customize these dashboards or create new ones.
Here's a simple example. You might want to track workloads involving external traffic. In that case, you can adapt the rules defined in this article. Look at them closely and you might notice they're all using the same four metrics: netobserv_workload_egress_bytes_total, netobserv_workload_ingress_bytes_total, and their equivalent for packets.
To track per-workload external traffic, you can use them again. As for namespaces, filter on empty SrcK8S_OwnerType or DstK8S_OwnerType. This is an easy way to detect when NetObserv hasn't been able to identify any in-cluster resource corresponding to a specific source or destination, which exposes a likely cluster-external caller or service.
You end up with these two new rules:
    - record: workload:netobserv_workload_egress_bytes_total:src:unknown_dst:rate5m
      expr: sum(label_replace(label_replace(label_replace(rate(netobserv_workload_egress_bytes_total{DstK8S_OwnerType=\"\"}[5m]),\"namespace\",\"$1\",\"SrcK8S_Namespace\",\"(.*)\"),\"workload\",\"$1\",\"SrcK8S_OwnerName\",\"(.*)\"),\"kind\",\"$1\",\"SrcK8S_OwnerType\",\"(.*)\")) by (namespace,workload,kind)
    - record: workload:netobserv_workload_ingress_bytes_total:dst:unknown_src:rate5m
      expr: sum(label_replace(label_replace(label_replace(rate(netobserv_workload_ingress_bytes_total{SrcK8S_OwnerType=\"\"}[5m]),\"namespace\",\"$1\",\"DstK8S_Namespace\",\"(.*)\"),\"workload\",\"$1\",\"DstK8S_OwnerName\",\"(.*)\"),\"kind\",\"$1\",\"DstK8S_OwnerType\",\"(.*)\")) by (namespace,workload,kind)
Be careful about escaping double-quotes. It's not pretty, but it's necessary to avoid parsing errors. Also, the label_replace chained calls in this example YAML look messy and could be avoided, but they actually make it easier to manipulate those metrics later on in Grafana.
NetObserv has many more metrics to show, including TCP latencies, packet drop counters, and more on the way. We're also working on a new API in NetObserv that will soon let you build pretty much any metric you want out of flow logs, providing you with even more dashboarding possibilities.
If you want to get in touch with the NetObserv team, you can use our discussion board.
About the author

More like this
Introducing OpenShift Service Mesh 3.2 with Istio’s ambient mode
How Banco do Brasil uses hyperautomation and platform engineering to drive efficiency
Technically Speaking | Taming AI agents with observability
A composable industrial edge platform | Technically Speaking
Browse by channel

Automation
The latest on IT automation for tech, teams, and environments

Artificial intelligence
Updates on the platforms that free customers to run AI workloads anywhere

Open hybrid cloud
Explore how we build a more flexible future with hybrid cloud

Security
The latest on how we reduce risks across environments and technologies

Edge computing
Updates on the platforms that simplify operations at the edge

Infrastructure
The latest on the world’s leading enterprise Linux platform

Applications
Inside our solutions to the toughest application challenges
Virtualization
The future of enterprise virtualization for your workloads on-premise or across clouds