Monitoring of application environments is very important, and there are many kinds of monitoring to consider – infrastructure capacity and availability, as well as application responsiveness and availability to name a few. This is also true in a Platform-as-a-Service (PaaS) environment, such as one running the Red Hat OpenShift Container Platform. The use of containers mean that applications can be built as an immutable image that is deployed and promoted to multiple hosting environments at a rapid pace. This makes monitoring more complex, and the need for dynamic adaptation to the running environment is key to success. But what is the best way to deploy and manage the monitoring solution itself, which in many cases is also running fully or partially within containers? This is where Infrastructure-as-Code (IaC) comes in a useful approach. First, let’s define IaC.
What is Infrastructure-as-Code?
Infrastructure-as-Code (IaC), and the related Configuration-as-Code (CaC), is an approach to how the management of infrastructure components is automated, and the configuration data, serving as input parameters to the automation, is maintained with source control lifecycle processes - similar to how regular software development source code is maintained and updated. IaC has many benefits, including the elimination of error-prone manual tasks, quicker and more consistent deployments (avoiding “snowflakes”) as well as tracking of changes (who, when, what) applied to the environment. However, “infrastructure” is an overloaded term and can often have different meanings depending on the environment it is running in as well as the background and knowledge of the individuals working in this environment. In a PaaS hosted environment, the use of IaC can even encapsulate the management of deployments on top of the PaaS, in addition to the core infrastructure components themselves. For this blog post, we will take a closer look at how IaC can be used to control the deployment of monitoring components in a PaaS environment, including monitoring of core infrastructure as well as applications.
Dynatrace
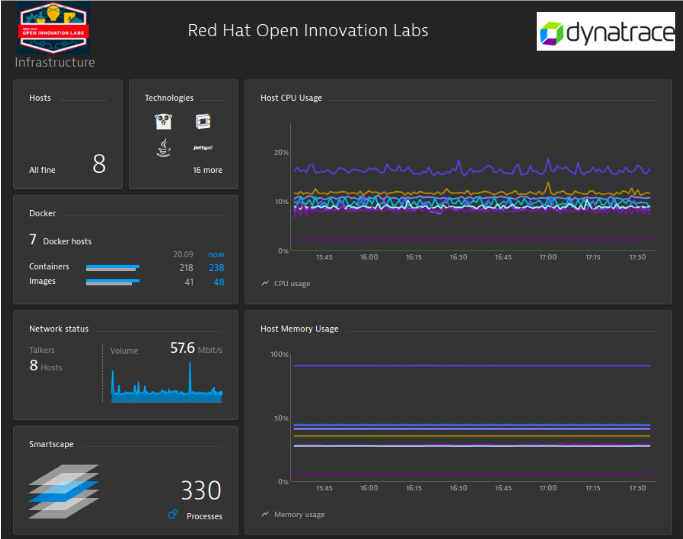
The Red Hat Open Innovation Labs team has done work with Dynatrace to integrate their monitoring solution with Red Hat OpenShift Container Platform for use as part of Open Innovation Labs residencies. [Please see this blog posting for more information about the work done]. Based on this work, I have found that deploying the Dynatrace solution is fairly straightforward and it provides a comprehensive monitoring solution for both the IaaS (Infrastructure-as-a-Service) and PaaS, as well as the applications running in the environment. Even though we have done work around monitoring of the IaaS, such as the Red Hat OpenStack Platform, with Dynatrace (and it did quickly find some bottlenecks in our hosting environment), the IaaS story is outside of the scope of this blog posting and something we may cover another time.

Automated Deployments
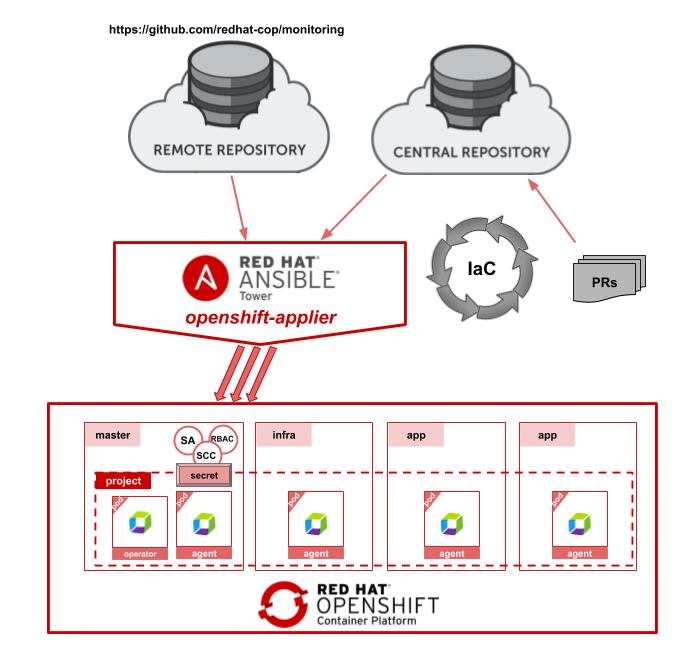
Installing and configuring the Dynatrace monitoring solution on top of the Red Hat OpenShift Container Platform is quite fast and only requires a few manual steps to set it up correctly. However, in an environment where the target is 100% automation, even a few manual steps is too much. Hence, I wanted to see what it would take to fully automate the deployments utilizing our openshift-applier. The openshift-applier is an Ansible based implementation completely driven by source controlled inventories that can be combined in a modular fashion to compose a complete cluster deployment. The starting point for this Dynatrace deployment was the work already done by their team, and the well documented steps found in their github repository. Since they already were using a static yaml files approach to perform the install (paired with a few manual steps), the move to being 100% automated was mostly about just converting this to OpenShift templates and define the inventory for the openshift-applier. The final result can be found in our Communities-of-Practice repository for monitoring. Utilizing this repository, it makes it very easy to combine this inventory (especially the openshift_cluster_content portion), with other openshift-applier based inventories. This allows for a fully automated deployment of everything from cluster operation/maintenance to CI/CD pipelines and user space applications.
Cluster Content
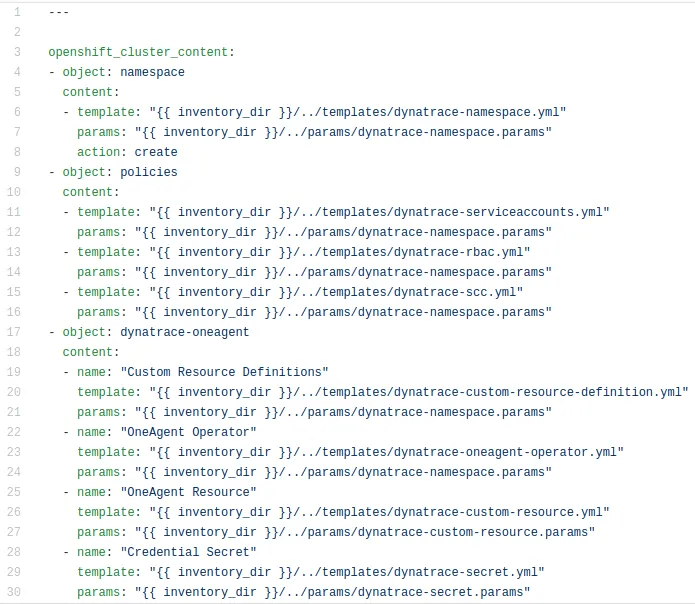
The following sample inventory was taken from the monitoring repository and shows how the deployment is logically broken into 3 sections with 8 templates. This can be used as-is to perform the deployment, but it also allows for a modular replacement of any of these templates to better fit with the target environment. Each template is paired up with a set of parameters stored in params files that allows for minor customizations of the deployment without having to replace the template - such as deploying to a different namespace, etc. There are 2 parameter files that have to be updated before the deployment is done, and those are the files containing the environment specific values, such as the Dynatrace (SaaS) URL, API Token and PaaS Token. Once this is done, the setup can be done with just a few commands seen below.
> oc login <cluster>

> ansible-playbook -i <inventory> openshift-applier/playbooks/openshift-cluster-seed.yml


Happy Monitoring
That is it. After the above command has been successfully executed, the Dynatrace OneAgent deployment will be running and set up the components running on each of the nodes. Within a few minutes the OpenShift nodes will appear in the Dynatrace monitoring dashboards, and you can choose to customize what data to expose, as well as what alerts to receive.
Additional Reading
Make sure to check out the various Dynatrace blog posts that covers more specific aspects of both infrastructure and application monitoring:
https://www.dynatrace.com/news/blog/introducing-dynatrace-oneagent-operator/
https://www.dynatrace.com/news/blog/dynatrace-monitoring-for-kubernetes-and-openshift/
https://www.dynatrace.com/news/blog/observations-from-red-hat-summit-2018/
Connect with Red Hat Services
Learn more about Red Hat Consulting
Learn more about Red Hat Training
Learn more about Red Hat Certification
Join the Red Hat Learning Community
Subscribe to the Training Newsletter
Follow Red Hat Services on Twitter
Follow Red Hat Open Innovation Labs on Twitter
Like Red Hat Services on Facebook
Watch Red Hat Training videos on YouTube
Follow Red Hat Certified Professionals on LinkedIn

執筆者紹介

類似検索
エージェント型のパラドックスとハイブリッド AI の事例
過去を管理するのをやめて、IT の未来を構築しましょう
Collaboration In Product Security | Compiler
Keeping Track Of Vulnerabilities With CVEs | Compiler
チャンネル別に見る

自動化
テクノロジー、チームおよび環境に関する IT 自動化の最新情報

AI (人工知能)
お客様が AI ワークロードをどこでも自由に実行することを可能にするプラットフォームについてのアップデート

オープン・ハイブリッドクラウド
ハイブリッドクラウドで柔軟に未来を築く方法をご確認ください。

セキュリティ
環境やテクノロジー全体に及ぶリスクを軽減する方法に関する最新情報

エッジコンピューティング
エッジでの運用を単純化するプラットフォームのアップデート

インフラストラクチャ
世界有数のエンタープライズ向け Linux プラットフォームの最新情報

アプリケーション
アプリケーションの最も困難な課題に対する Red Hat ソリューションの詳細
仮想化
オンプレミスまたは複数クラウドでのワークロードに対応するエンタープライズ仮想化の将来についてご覧ください