
Have you ever found yourself in a situation where you need to know who's using up all of your bandwidth and what they're using it on? I certainly have and I want to introduce you to a tool that can help you answer that question. When I worked as a support admin, I routinely found myself trying to run replication jobs that were bottlenecking at the interface. The interface and associated hardware were more than capable of pushing upwards of 10Gb. However, I only saw about 3Gb of that. So the question arises, especially on a dedicated interface, who is burning up all of the bandwidth? Or is there another issue at play?
The best troubleshooting techniques are the quick, effortless steps that you take to eliminate one of many potential outcomes. Enter iftop.
What does it do?
Much like top and htop, the iftop command is used to resource usage on your system. Specifically, it monitors the bandwidth of active ethernet interfaces. When applied to the situation I described above, you can run the iftop command to see what is actually using the bandwidth across the data replication interface. This can be incredibly efficient when you consider how long it might take you to come to that conclusion by troubleshooting the interface itself. There is no problem, just an excess of activity on the interface.
Let's look at the process of installing and using this practical tool.
Installation
Before you install the iftop tool, you need a few prerequisite packages. You need to install libpcap (which is used for capturing the interface data in real time), as well as libncurses (an API used for building text-based interfaces independent of a terminal). I am using a Fedora 32 VM to demonstrate this tool. If you're using a different OS, your installation will vary slightly. To install:
    [tcarrigan@client ~]$ sudo yum -y install libpcap-devel ncurses ncurses-devel
    [sudo] password for tcarrigan:
    Fedora 32 openh264 (From Cisco) - x86_64                      4.8 kB/s | 989  B     00:00
    Fedora 32 openh264 (From Cisco) - x86_64                      3.3 kB/s | 2.5 kB     00:00
    Fedora Modular 32 - x86_64                                     28 kB/s |  15 kB     00:00
    Fedora Modular 32 - x86_64 - Updates                           38 kB/s | 7.6 kB     00:00
    Fedora Modular 32 - x86_64 - Updates                          189 kB/s | 1.0 MB     00:05
    Fedora 32 - x86_64 - Updates                                   46 kB/s |  10 kB     00:00
    Fedora 32 - x86_64 - Updates                                  221 kB/s |  12 MB     00:54
    Fedora 32 - x86_64                                             40 kB/s |  15 kB     00:00
    Package ncurses-6.1-15.20191109.fc32.x86_64 is already installed.
    Dependencies resolved.
    ==============================================================================================
     Package                  Architecture   Version                         Repository      Size
    ==============================================================================================
    Installing:
     libpcap-devel            x86_64         14:1.9.1-3.fc32                 fedora         136 k
     ncurses-devel            x86_64         6.1-15.20191109.fc32            fedora         503 k
    Installing dependencies:
     ncurses-c++-libs         x86_64         6.1-15.20191109.fc32            fedora          39 k

    Transaction Summary
    ==============================================================================================
    Install  3 Packages

    Total download size: 678 k
    Installed size: 1.2 M
    Downloading Packages:
    (1/3): ncurses-c++-libs-6.1-15.20191109.fc32.x86_64.rpm        55 kB/s |  39 kB     00:00
    (2/3): libpcap-devel-1.9.1-3.fc32.x86_64.rpm                  159 kB/s | 136 kB     00:00
    (3/3): ncurses-devel-6.1-15.20191109.fc32.x86_64.rpm          174 kB/s | 503 kB     00:02
    ----------------------------------------------------------------------------------------------
    Total                                                         181 kB/s | 678 kB     00:03
    Running transaction check
    Transaction check succeeded.
    Running transaction test
    Transaction test succeeded.
    Running transaction
      Preparing        :                                                                      1/1
      Installing       : ncurses-c++-libs-6.1-15.20191109.fc32.x86_64                         1/3
      Installing       : ncurses-devel-6.1-15.20191109.fc32.x86_64                            2/3
      Installing       : libpcap-devel-14:1.9.1-3.fc32.x86_64                                 3/3
      Running scriptlet: libpcap-devel-14:1.9.1-3.fc32.x86_64                                 3/3
      Verifying        : libpcap-devel-14:1.9.1-3.fc32.x86_64                                 1/3
      Verifying        : ncurses-c++-libs-6.1-15.20191109.fc32.x86_64                         2/3
      Verifying        : ncurses-devel-6.1-15.20191109.fc32.x86_64                            3/3

    Installed:
      libpcap-devel-14:1.9.1-3.fc32.x86_64         ncurses-c++-libs-6.1-15.20191109.fc32.x86_64
      ncurses-devel-6.1-15.20191109.fc32.x86_64

    Complete!
Once you have the prerequisite packages installed, you can install the actual iftop tool:
    [root@client ~]# dnf install iftop
    Last metadata expiration check: 0:01:45 ago on Thu 08 Oct 2020 06:22:52 PM EDT.
    Package iftop-1.0-0.23.pre4.fc32.x86_64 is already installed.
    Dependencies resolved.
    Nothing to do.
    Complete!
[ Readers also liked: 11 Linux commands I can’t live without ]
Basic usage
Once you have all of the required packages installed, run iftop to get a feel for the output and the information presented. Keep in mind that without any options, iftop will run against the default interface (eth0 in most cases).
To run the default command:
[root@client ~]# iftop
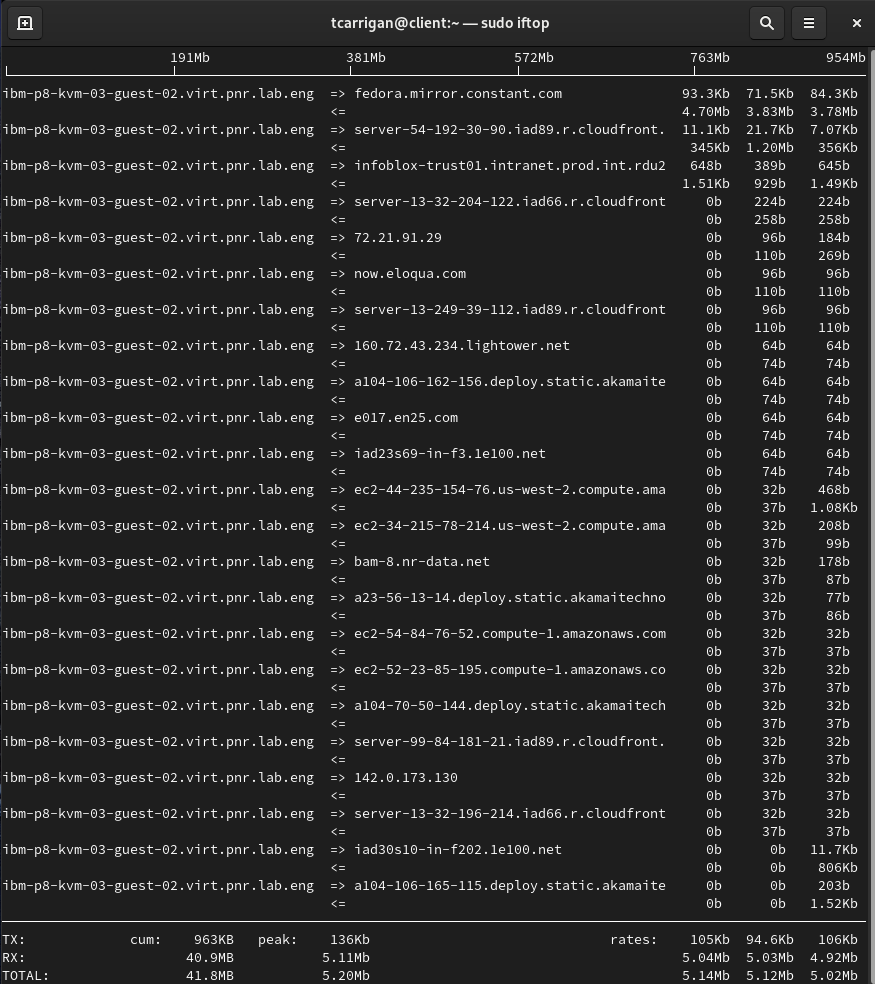
From left to right, note the following:
- Resolved hostnames (source or destination, notated by the arrows)
- Average data transmission rates (2, 10, 40-second intervals)
You'll see TX (transferred) RX (received) TOTAL transmission rates at the bottom of the output. There are also figures for cumulative totals and averages, as well as peak numbers.
Getting specific
As powerful as this tool is, it can throw too much information at you in a busy environment. To circumvent this issue, we will use specific options to filter down the output presented. In the scenario I described above, I would only want to see the analytics around the specific replication interface I was trying to use. To look at a particular interface, we are going to add the -i option.
[tcarrigan@client ~] $ sudo iftop -i enp0s3
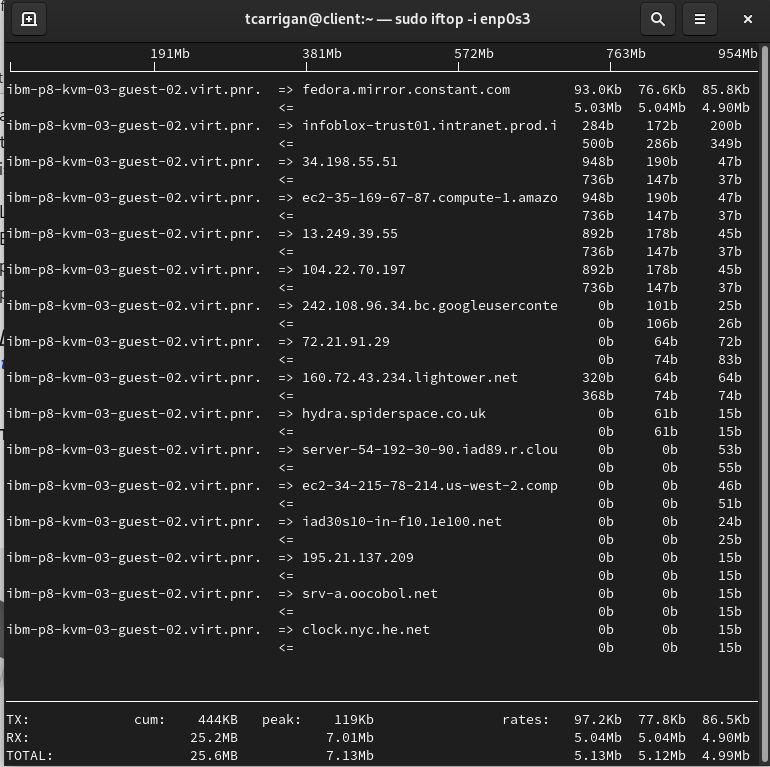
Here we can see the same information presented as before. However, this is only looking at interface enp0s3.
If you wanted to view IP information, use the -n flag to disable the hostname resolution.
[tcarrigan@client ~] $ sudo iftop -n
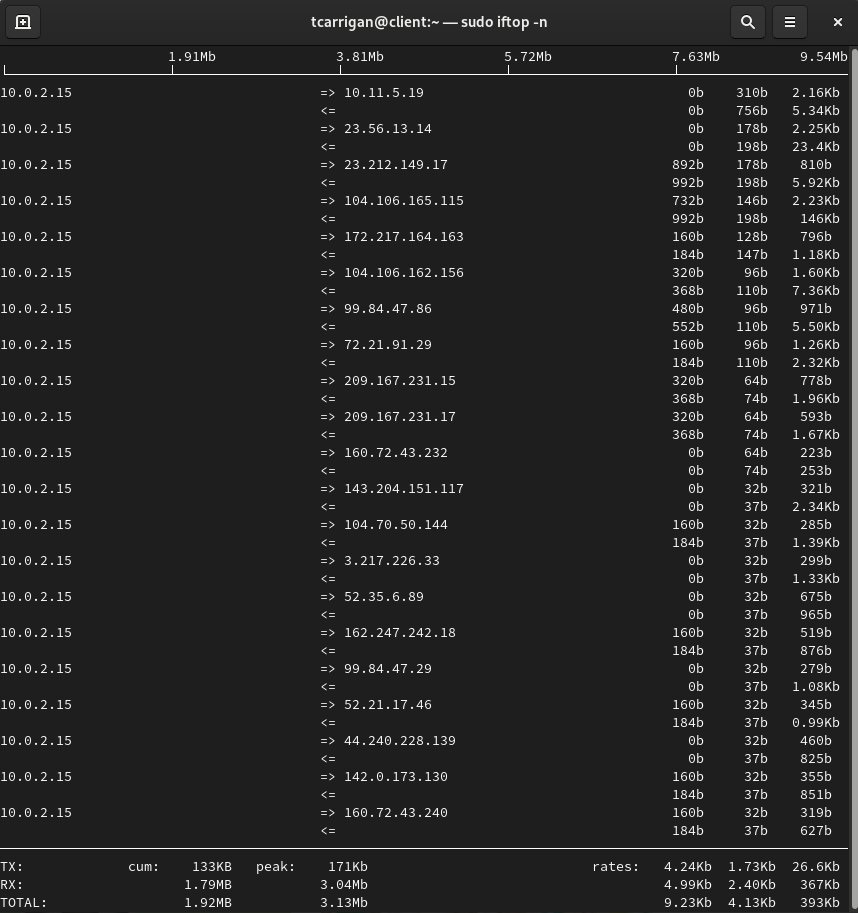
You can see from the screenshot above that the IP addresses are now visible. This can be a much easier way of troubleshooting in large environments where hostnames can become confusing.
There are various other options that you can utilize to really dial in the information presented to you. The following list is pulled directly from the man page, which can be found by running man iftop.

[ Free online course: Red Hat Enterprise Linux technical overview. ]
Summary
If you made it this far, you looked at the utility offered by iftop and the options for targeted usage. When you need to figure out what bandwidth is being used, and where it is going to or from, iftop can be a powerful asset. You can filter its output down to be as specific as you need it using the huge array of available options, making this a no-brainer to keep in your sysadmin tool belt.
About the author
Tyler is the Sr. Community Manager at Enable Sysadmin, a submarine veteran, and an all-round tech enthusiast! He was first introduced to Red Hat in 2012 by way of a Red Hat Enterprise Linux-based combat system inside the USS Georgia Missile Control Center. Now that he has surfaced, he lives with his wife and son near Raleigh, where he worked as a data storage engineer before finding his way to the Red Hat team. He has written numerous technical documents, from military procedures to knowledgebase articles and even some training curricula. In his free time, he blends a passion for hiking, climbing, and bushcraft with video games and computer building. He is loves to read and enjoy a scotch or bourbon. Find him on Twitter or on LinkedIn.
More like this
How Red Hat solves the toughest challenges in agentless infrastructure scanning
An introduction to the vi editor
Infrastructure At The Edge | Compiler
Operating System Management | Compiler
Browse by channel

Automation
The latest on IT automation for tech, teams, and environments

Artificial intelligence
Updates on the platforms that free customers to run AI workloads anywhere

Open hybrid cloud
Explore how we build a more flexible future with hybrid cloud

Security
The latest on how we reduce risks across environments and technologies

Edge computing
Updates on the platforms that simplify operations at the edge

Infrastructure
The latest on the world’s leading enterprise Linux platform

Applications
Inside our solutions to the toughest application challenges
Virtualization
The future of enterprise virtualization for your workloads on-premise or across clouds