
The Unified Modeling Language (UML) is a comprehensive and standardized approach to technical diagramming. As I wrote in my introduction to UML, before the Object Management Group (OMG) adopted the UML standard in 1997, there was no uniform way to model structural diagrams for designing large enterprise applications. UML provides a way for enterprise architects to visualize their designs that anyone who knows UML can understand.
My intro article answers essential questions like: What is UML? Why was UML created? Who created UML? and Why should you use UML? There are two basic types of UML diagrams: static and dynamic. In this article, I'll get into the details of static diagrams, and in another article, I describe dynamic diagrams.
Each example diagram for this article represents a particular aspect of a hypothetical application called the Instructional Video Service. That application is a system that delivers an educational video to a user according to a selection made from a catalog of videos.
Types of static diagrams
Static diagrams describe the state of a system from a variety of perspectives. A static diagram describes what a piece of the system is. A dynamic diagram describes what a portion of the system is doing.
There are seven types of static diagrams:
The following sections describe the details of each static diagram type.
Component
As the name implies, a component diagram is a diagram that describes the various components that make up all or part of a software system. A component diagram is concerned with the various components that make up the system and the interfaces that those components expose and consume.
[ You might also be interested in reading Understanding developer experience: An illustrated guide to the value of using diagrams. ]
Component example
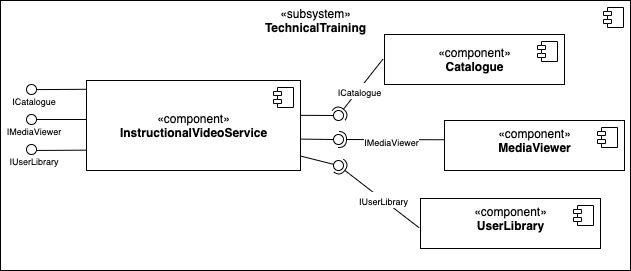
Figure 1 shows four components: InstructionalVideoService, Catalogue, MediaViewer, and UserLibrary. The InstructionalVideoService consumes services provided by the Catalogue, MediaViewer, and UserLibrary components. The services provided by the associated components are represented as required interfaces using lollipop notation. Take a look at the symbols section that follows the diagram below to learn the details of lollipop notation.
Interface symbols represent the services that the InstructionalVideoService provides.
Notice that the component diagram defines a stereotype <<component>>. A stereotype is a name used to describe an artifact in a general manner. In the diagram below, each element in the diagram is a component stereotype. Each component has a specific name (for example, InstructionalVideoService) to make it distinct.
Component symbols
Figure 2 describes the symbols used in the component diagram (Figure 1).

Class
A class diagram describes classes that are part of a software system. The term class is used in object-oriented programming to define a data structure consisting of properties and functions (also called methods).
[ Change may be inevitable, but resistance to change might be more so. Watch the on-demand webinar The conflicts of transformation to learn how to make navigating change easier. ]
Class example
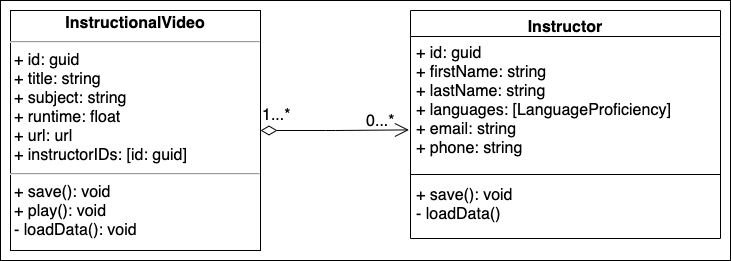
The class diagram (Figure 3) illustrates three classes, InstructionalVideo, Instructor, and LanguageProficiency. The diagram also describes an enumeration: Proficiency.
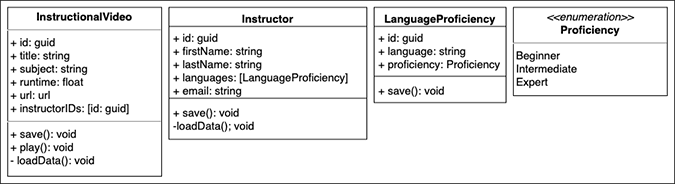
An enumeration is a way of expressing an immutable value using a name instead of a number. In this case, the system knows the underlying numeric values for Beginner, Intermediate, and Expert in the enumeration, Proficiency. These enumeration values never change. But, for clarity of description expression, the name associated with the Proficiency value is used when diagramming and programming.
The class diagram does not describe a particular instance of an InstructionalVideo, Instructor, or LanguageProficiency. Instead, the diagram describes the properties and methods that all InstructionalVideo, Instructor, or Language instances have.
Class symbols
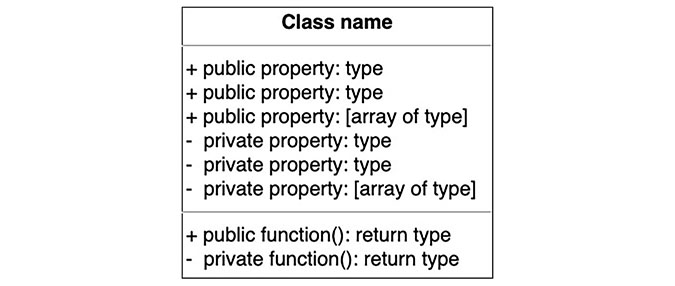
Figure 4 illustrates the symbols that describe a class in a UML class diagram.
Object
An object diagram describes specific objects in a software system. An object is an artifact used in object-oriented programming. Whereas a class describes something in general, an object describes something in particular.
Object example
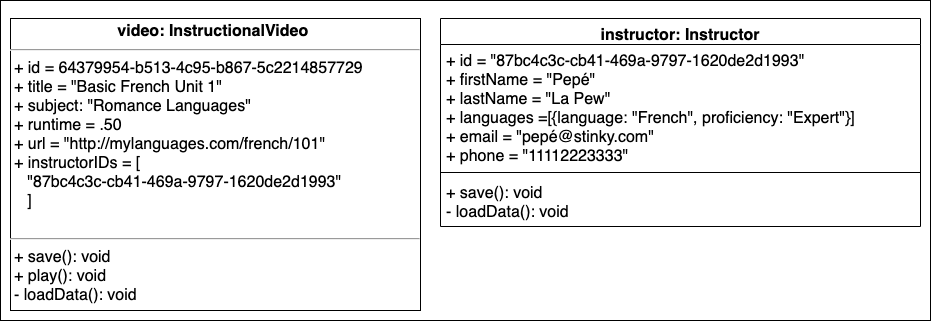
Figure 5 describes two objects. One object is an instance of an InstructionalVideo. The other object is an instance of an Instructor class. Notice that all the objects' properties have values associated with them.
Object symbols
The symbols used in an object diagram are similar to the symbols used in a class diagram. The difference is that the object diagram has values assigned to the properties.
Composite
A composite diagram describes the relationships between components or classes. The usual relationships are association, aggregation, or composition.
An association relationship is when one component or class works with another component or class. For example, one component sends a message to another component.
[ Start Preparing your IT infrastructure for the next 10 years. ]
An aggregation relationship is where one component comprises another component or class, but the constituent lives on when the main component is destroyed. For example, an instructor is assigned to teach a course. But, if the course gets canceled, the instructor still exists. The instructor does not get destroyed along with the course.
A composition relationship is one in which the constituent members of a component or class are not independent of the component. Thus, when the component gets destroyed, so are the constituent members. For example, an automobile has tires. If the automobile gets destroyed, so will the tires. The relationship is one of composition.
Composite example
Figure 6 is an example of a composite diagram. The diagram describes a class, InstructionalVideo, that has an aggregation relationship with one or many instructors.
In a composite diagram, the arrowheads used on a line are meaningful. In this case, the diamond-shaped arrowhead connected to the InstructionalVideo class means that the InstructionalVideo must have at least one Instructor, but can have many.
The arrowhead attached to the Instructor class on the right side of the diagram indicates that an Instructor can belong to none or many InstructionalVideos.
Composite symbols
Figure 7 describes the symbols used in the composite diagram in Figure 6.

Deployment
A deployment diagram describes a component(s) in terms of its hosting artifacts. It also describes how communication is facilitated among the various deployment hosts.
Deployment example
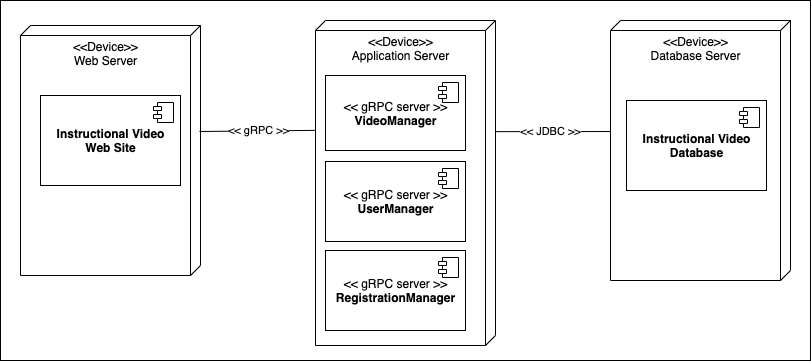
Figure 8 is a deployment diagram that describes three hosting environments according to the stereotype <<Device>>. The Web Server hosts the website for selecting and viewing instructional videos. The Application Server hosts the VideoManager, UserManager, and RegistrationManager components. The Web Server communicates with the Application Server using the gRPC protocol. Each component hosted by the Application Server is a gRPC server, as indicated by its stereotype.
[ Find out how to use everyday tools to solve data management challenges at scale. ]
A Database Server hosts the Instructional Video Database component. The components in the Application Server communicate with the Instructional Video Database component using the JDBC protocol.
Deployment symbols
Figure 9 describes the symbols used in the deployment diagram in Figure 8.

Package
As the name implies, the package diagram describes the various packages that are part of a software system. In addition to describing packages, a package diagram can describe relationships and dependencies among packages.
Typically, a package is specific to a programming language or framework. For example, in Java, a package might be a JAR or WAR file. In .NET, the package can be a DLL. In Node.js, the package is an NPM package.
Some packages are not specific to a programming language or framework. For example, you can consider a Linux container as a package.
Package example
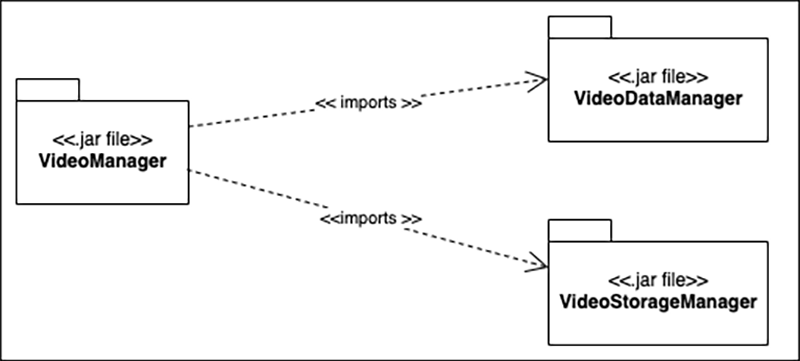
Figure 10 is a package diagram that describes three packages represented as JAR files. The VideoManager package imports classes defined in the VideoDataManager package and the VideoStorageManager package.
Package symbols
Figure 11 describes the symbols used in the package diagram (Figure 10).

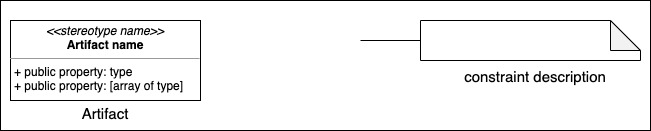
Profile
A profile diagram describes the stereotypes, rules, and constraints relevant to particular artifacts in a software system.
Profile example
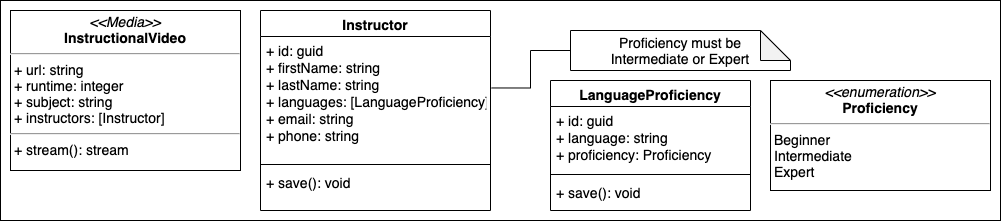
Figure 12 is a profile diagram that describes an InstructionalVideo class as an example of a Media stereotype. The diagram also describes that the Instructor class for a given InstructionalVideo needs to conform to a particular constraint. The constraint is that an instructor for an InstructionalVideo must have a language proficiency of Intermediate or Expert.
Profile symbols
Figure 13 describes the symbols used in the UML profile diagram in Figure 12.
Conclusion
UML is a very detailed set of diagram types and symbols, but those details are what make the standard a standard. When enterprise architects use a common diagramming language, it enables any developer in any company to work on any system designed by any architect. For more details about UML static diagrams, you can read the specification at uml.org.
About the author
Bob Reselman is a nationally known software developer, system architect, industry analyst, and technical writer/journalist. Over a career that spans 30 years, Bob has worked for companies such as Gateway, Cap Gemini, The Los Angeles Weekly, Edmunds.com and the Academy of Recording Arts and Sciences, to name a few. He has held roles with significant responsibility, including but not limited to, Platform Architect (Consumer) at Gateway, Principal Consultant with Cap Gemini and CTO at the international trade finance company, ItFex.
More like this
The value of unconventional experience: From sweeping hair to shaping careers
Red Hat Learning Subscription Course reimagines virtual training
Container Roundup | Compiler
Untangling Networks | Compiler
Browse by channel

Automation
The latest on IT automation for tech, teams, and environments

Artificial intelligence
Updates on the platforms that free customers to run AI workloads anywhere

Open hybrid cloud
Explore how we build a more flexible future with hybrid cloud

Security
The latest on how we reduce risks across environments and technologies

Edge computing
Updates on the platforms that simplify operations at the edge

Infrastructure
The latest on the world’s leading enterprise Linux platform

Applications
Inside our solutions to the toughest application challenges
Virtualization
The future of enterprise virtualization for your workloads on-premise or across clouds