
Does your private cloud feel like a free-for-all buffet? You know it's providing value, but when the bill comes due, it’s nearly impossible to tell who’s eating what.
In today's dynamic cloud environments, it’s increasingly important to be able to properly attribute costs to internal users, especially for enterprises running their own cloud infrastructure. You need to establish accountability in order to distribute costs fairly among departments or encourage teams to right-size their workloads—and gaining visibility is the first step.
With feature release 5 (FR5) of Red Hat OpenStack Services on OpenShift 18, we are shipping a critical piece to help solve that puzzle: the ability to perform rating based on your tenants' measured usage.
We are introducing CloudKitty, the OpenStack-native rating service, as generally available in FR5. This service fills the gap between your raw technical metrics and your financial operations.
Why is CloudKitty important?
CloudKitty provides a translation layer that turns data about server usage into information that can inform departmental budgets. Think of CloudKitty as the meter reader: it sits between your collected metrics and your FinOps or billing solution. It takes raw technical data, like how many hours a virtual machine (VM) ran or how much storage was consumed, and applies your specific rating rules to generate a report. This helps you achieve 2 major goals:
- Transparent cost recovery: You can now see a clear, itemized breakdown of resource usage per tenant. This allows you to recoup operational expenses accurately without surprising internal customers with opaque charges.
- Trust and optimization: When tenants see how their own consumption (broken down by project, flavor, and metric) affects their costs, they can make informed decisions, like archiving stale data or optimizing their VM usage.
Note that CloudKitty acts purely as a visibility and rating engine; it does not actively enforce budgets or block the creation of resources (like Nova instances) if a tenant exceeds a certain cost threshold.
How does CloudKitty work?
While not a full billing solution, CloudKitty provides the crucial link between usage and cost. The workflow, in simple terms, goes like this:
Set Rating Rules → Collect Metrics → Generate Rating Reports
Setting the rules
Let’s introduce a sample tenant from our fictional roster: the Ministry of Data. Historically, the Ministry has been spinning up massive VMs for their analytics workloads, and they’re left running long after the computations are done.
To achieve transparent cost recovery, we need to track their compute footprint. We'll do this by tracking the ceilometer_cpu metric. This specific metric allows us to provide flavor-based uptime, meaning that for every period a VM instance is running, CloudKitty can calculate a different rate based on its size.
Step 1: Create the service
First, we need to create a top-level container for our metric. The service name must be an exact match for the metric name or the alt_name defined in metrics.yaml. (We’ll discuss this file in more detail later.)
openstack rating hashmap service create ceilometer_cpu
+----------+--------------------------------------+
| Name     | Service ID                           |
+----------+--------------------------------------+
| ceilometer_cpu | <uuid>                         |
+----------+--------------------------------------+
Save that Service ID (UUID)—you'll need it for the next commands!
By creating a service named ceilometer_cpu, we help ensure that every single CPU data point that comes in from the collector will be routed directly to this new rating rule.
Step 2: Creating a group (optional)
We don't want the Ministry's compute charges getting tangled up with their storage or networking bills. Groups help us organize related mappings and isolate calculations from each other.
openstack rating hashmap group create cpu_ratingBy grouping these mappings, we separate different billing scenarios. If multiple mappings in the same group happen to match, CloudKitty will only apply the most expensive one.
Step 3: Create a mapping
Mappings are the cost rules. First, let's establish a baseline for the Ministry of Data by charging a fixed cost per item. By substituting <service_id> and <group_id> with the UUIDs returned in the previous steps, you can link this new rule directly to your ceilometer_cpu service and cpu_ratinggroup.
openstack rating hashmap mapping create 0.02 \
    -s <service_id> \
    -g <group_id> \
    -t flat
In this scenario, 0.02 means 0.02 units per collection period (every hour by default). Each CPU instance is charged a flat 0.02 units regardless of how much it's used.
Step 4: Field-based rating (the secret weapon)
The Ministry of Data runs tiny web servers alongside massive, resource-hungry database nodes. Charging a flat rate for everything wouldn't be fair. We want to charge them different prices for each of the specific VM flavors they use.
First, we create a field referencing the metadata key:
openstack rating hashmap field create <service_id> flavor_idThen, we create a specific mapping for that flavor value:
openstack rating hashmap mapping create 0.05 \
    --field-id <field_id> \
    --value <flavor_uuid> \
    -t flat
We will repeat this mapping creation for every flavor available in our environment. For each flavor, a new rule is created so that the rating service knows what rate to calculate when that specific VM size is running.
The result: How it works together
When the end of the month arrives and the Ministry of Data asks to see their usage, here is how CloudKitty processes the rules we built above:
ceilometer_cpu (metric)
    └─> Service: ceilometer_cpu
           └─> Field: flavor_id (optional)
                  └─> Mapping: m1.tiny = 0.01, m1.large = 0.05
           └─> Mapping (direct): 0.02 flat
If you can measure it, you can rate it
We used the Ministry of Data's CPU usage (ceilometer_cpu) as our primary example, but compute is only one part of the puzzle. The true power of CloudKitty in Red Hat OpenStack Services on OpenShift is its integration with Prometheus.
Remember, any metric that is already collected can be used for rating. This means you can easily create rating rules for the rest of your tenant's footprint using the exact same steps we outlined above. For example, you can build cost mappings for:
- Block storage: Tracking GB-month capacity using
ceilometer_disk_device_capacity - Networking: Charging for allocated public-facing addresses using
ceilometer_ip_floating - Outbound bandwidth: Rating total egress traffic from VMs using
ceilometer_network_outgoing_bytes
Once CloudKitty fetches this scope of data from Prometheus, the processor applies your customized rating rules and pushes the finalized, rated metrics directly to a storage backend. It serves as the ultimate automated bridge between your raw technical telemetry and your FinOps reporting.
Generate rating reports: The moment of truth
Once you’ve created your rules and collected metrics from Prometheus, the final step is extracting the rated data.
It is important to note that CloudKitty is not an invoicing system. It doesn't try to generate a pretty PDF bill. Instead, it is designed to serve as a robust data engine that provides clean, parsable JSON data via its REST API or the OpenStack client. This allows you to more easily plug the rated data directly into your enterprise's existing FinOps, showback, or billing middleware.
The tenant's view: The Ministry checks their tab
CloudKitty has built-in tenant-aware access control. When the Ministry of Data wants to see their current usage, they can only access their own project's footprint. Any attempts to view other tenants' data are automatically blocked or ignored by the API.
To get their monthly summary, the Ministry can use the OpenStack client:
# Get summary for a specific month
openstack rating summary get --begin 2026-02-01 --end 2026-03-01
The administrator's view: The bird's-eye perspective
While the Ministry of Data is restricted to their own usage, cloud administrators need a holistic view of the entire environment to manage capacity and facilitate global chargeback.
Using an admin token, operators have full visibility. They can build on the command to isolate a specific tenant using --tenant-id <project_uuid>.
openstack rating summary get \
--begin 2026-02-01 \
--end 2026-03-01 \
--tenant-id <project_uuid>
Alternatively, if the FinOps team needs the complete picture to export to their billing system, the administrator can pull the rated data for the entire cloud all at once by using the --all-tenants flag.
Connecting directly to your FinOps solution
If your FinOps middleware is pulling this data programmatically, it can use the REST API to request a detailed breakdown grouped by the specific service types we configured earlier (like ceilometer_cpu):
curl -X GET \
-H "X-Auth-Token: $TENANT_TOKEN" \
"http://localhost:8888/v1/report/summary?begin=2026-02-01T00:00:00&end=2026-03-01T00:00:00&groupby=res_type"
The resulting JSON output cleanly lays out the resource type, the time period, and the total calculated units
{
  "summary": [
    {
      "tenant_id": "MoD-project-uuid",
      "res_type": "ceilometer_cpu",
      "begin": "2026-02-01T00:00:00",
      "end": "2026-03-01T00:00:00",
      "rate": 125.50
    }
  ]
}
By funneling this structured, aggregated JSON data directly into your enterprise's broader financial software, you successfully close the loop between raw infrastructure consumption and cost accountability.
A look under the hood
Now that we've seen CloudKitty in action from the operator's perspective, let's lift the hood and look at the engine underneath. Understanding the architecture will help you reason about scalability, troubleshoot issues, and appreciate why certain design decisions were made.
Architecture overview
CloudKitty runs as 2 independent processes, each with a distinct responsibility:
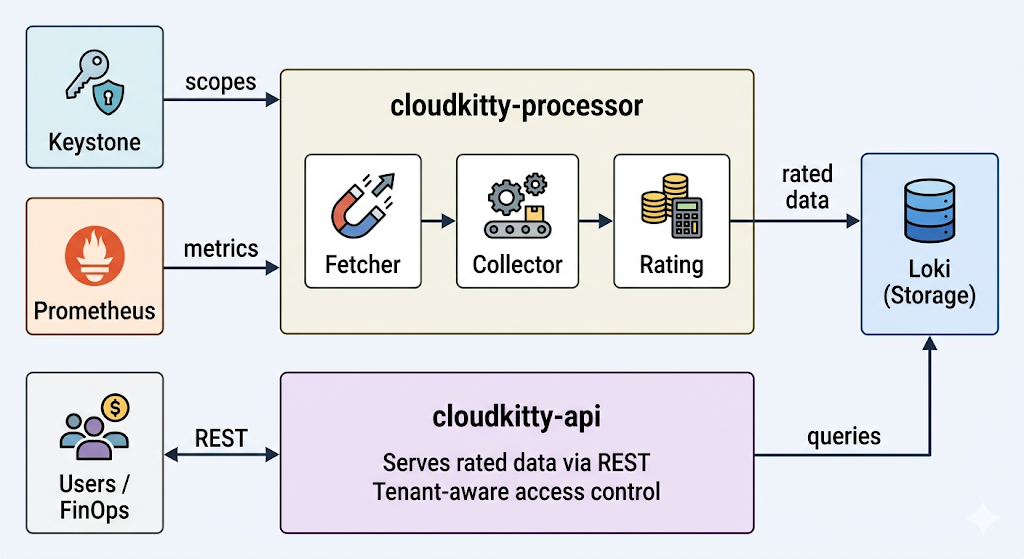
Figure 1. The CloudKitty architecture. cloudkitty-processor fetches scopes from Keystone and metrics from Prometheus, rates the data, and stores it in Loki. cloudkitty-api serves the rated data from Loki to users and FinOps tools via REST.
cloudkitty-processor is the rating engine. On every collection period (1 hour by default), it executes a 4-stage pipeline:
- Fetch: Asks Keystone for the list of OpenStack projects (scopes) that need to be rated.
- Collect: For each scope, queries Prometheus for the raw metric values defined in
metrics.yaml. - Rate: Applies the hashmap rules (the services, fields, and mappings we configured earlier) to convert raw consumption into rated data.
- Store: Pushes the resulting rated dataframes to Loki for persistence.
cloudkitty-api is the REST front end. It handles all incoming queries from tenants, administrators, and external FinOps tools. When a user requests a rating summary, it queries Loki and returns the results. This process is stateless and can be scaled horizontally to handle more concurrent requests.
Because the two processes are decoupled, you can scale them independently: add more API replicas to handle query load, or tune the processor's parallelism to rate more scopes concurrently.
Why Loki?
Using Grafana Loki as the storage backend for rated data may seem like an unconventional choice as Loki is primarily known as a log aggregation system, but it’s actually an excellent fit:
- Time-series native: Rated data is inherently temporal: cost per scope per collection period. Loki is purpose-built for efficient time-range queries over structured streams.
- Already in the stack: OpenStack Services on OpenShift deployments already include a LokiStack for log management. CloudKitty reuses the same operator-managed infrastructure, so there is no additional database to deploy or maintain.
- Object-storage backed: Loki persists data to S3-compatible object storage, keeping the operational footprint small—no additional PVCs or database clusters to manage.
- Structured metadata: In the future, CloudKitty will store indexed metadata (tenant, metric type, flavor) directly on each log entry. This will enable fast filtered queries without full JSON parsing, significantly improving query performance at scale.
The metrics configuration
At the heart of the collection stage lies metrics.yaml. This file tells CloudKitty which Prometheus metrics to collect and how to handle them. Here is a representative excerpt from the shipped configuration:
metrics:
  ceilometer_cpu:
    unit: instance
    alt_name: instance
    groupby:
      - resource
      - user
      - project
      - flavor_name
      - flavor_id
    mutate: NUMBOOL
    extra_args:
      aggregation_method: max
  ceilometer_image_size:
    unit: MiB
    factor: 1/1048576
    groupby:
      - resource
      - project
    metadata:
      - container_format
      - disk_format
    extra_args:
      aggregation_method: max
Each entry controls how CloudKitty collects and interprets a specific Prometheus metric:
unit: The billing unit that appears in rating reports (e.g., instance, GiB, B, ip).alt_name: An alternative name for the metric. When creating hashmap services, you can use either the Prometheus metric name (ceilometer_cpu) or thealt_name(instance).groupby: The Prometheus labels used to disaggregate the metric. For ceilometer_cpu, grouping by flavor_name and flavor_id is what enables the flavor-based rating rules we configured earlier.mutate: A transformation applied to the raw value. NUMBOOL converts any non-zero value to 1, which is perfect for "is this resource active?" semantics—we don't care about the raw CPU counter, only that the instance is running.factor: A multiplication factor for unit conversion. For example,ceilometer_image_sizeuses 1/1048576 to convert raw bytes into MiB.metadata: Additional Prometheus labels to carry through to the rated data for informational purposes (e.g.,container_format,disk_formatfor images).extra_args: Back end-specific arguments.aggregation_method: maxtells the Prometheus collector to use the maximum value within each collection period.
Because CloudKitty's collector speaks directly to Prometheus, rating for any available metric is straightforward: add a new entry to metrics.yaml with the appropriate labels and unit, and CloudKitty will start collecting and rating it on the next processing cycle.
Inspecting the raw data
While the command openstack rating summary get gives you aggregated totals, sometimes you need to look deeper. Whether you are verifying that your rating rules are being applied correctly, debugging a missing metric, or trying to understand what CloudKitty is storing, the openstack rating dataframes get command lets you inspect the individual rated data points that live in Loki.
Think of summaries as the monthly statement and dataframes as the individual line items on the receipt.
To retrieve the raw rated dataframes for a specific time window:
openstack rating dataframes get --begin 2026-03-01T00:00:00Z --end 2026-03-01T01:00:00ZEach row in the output represents a single rated data point for 1 collection period:
Begin | End | Metric Type | Unit | Qty | Price | Group By | Metadata |
2026-03-01T00:00:00Z | 2026-03-01T01:00:00Z | ceilometer_cpu | instance | 1 | 0.05 | flavor_id=<uuid>, flavor_name=m1.large, project=<project_uuid>, resource=<vm_uuid> | |
2026-03-01T00:00:00Z | 2026-03-01T01:00:00Z | ceilometer_cpu | instance | 1 | 0.01 | flavor_id=<uuid>, flavor_name=m1.tiny, project=<project_uuid>, resource=<vm_uuid> |
Let's break down what each column tells you:
- Begin/End: The collection period this data point covers. By default, CloudKitty collects every hour, so you will see 1-hour windows.
- Metric Type: The metric name from
metrics.yaml(e.g.,ceilometer_cpu,ceilometer_ip_floating). - Unit: The billing unit, as defined in
metrics.yaml. - Qty: The raw quantity after any mutate or factor transformations. For
ceilometer_cpuwithNUMBOOL, this will be 1 if the instance was running. - Price: The rated value after applying your hashmap rules. This is where you can verify that the correct mapping was applied—if you set
m1.largeto 0.05, that's what should appear here. - Group By: The label values from the
groupbyfields inmetrics.yaml. This is how CloudKitty disaggregates the data and is what allows you to drill into specific resources, flavors, or projects. - Metadata: Any additional labels carried through via the metadata field in
metrics.yaml.
This gives operators a concrete tool to trace the full path from raw metric to final price, making CloudKitty's behavior transparent and debuggable at every step.
Ready to count costs?
Whether your goal is strict cost recovery from internal departments or providing transparent visibility into resource consumption, CloudKitty gives you the structured, reliable data you need to make it happen. It bridges the gap between your raw OpenStack telemetry and your enterprise FinOps middleware.
The days of treating the private cloud like a free-for-all buffet are over. We are thrilled to bring this native, highly customizable capability to the OpenStack Services on OpenShift ecosystem in feature release 5. It’s time to stop guessing and start rating.
Get started
Explore the official documentation to configure and manage CloudKitty in your environment:
See it in action
Check out the video demo to see how an administrator can easily configure flavor-based rating rules and extract their first monthly breakdown.
This video is a curated cut of 2 separate terminal sessions. If you want a closer, interactive look at the raw commands used under the hood, you can explore the full, uncut Asciinema recordings here:
- https://asciinema.org/a/ofDLdVKxHfMAsaNM: Deploying CloudKitty and creating the flavor-based rating rules.
- https://asciinema.org/a/P11NR7CEqfiewF4R: Verifying the chargeback dataframes and extracting the monthly summary.
Product trial
Red Hat OpenShift Container Platform | Product Trial
About the authors
Juan Larriba is a software engineer specializing in cloud infrastructure and OpenStack observability. He is a contributor to the OpenStack Kubernetes Operators ecosystem, where he works on the Telemetry Operator — a project that brings together metrics collection, alarming, and rating services like CloudKitty into cloud-native Kubernetes deployments. His work focuses on bridging traditional OpenStack telemetry components with modern container-native architectures, helping operators gain visibility and cost insight into their cloud workloads. Juan is passionate about open source collaboration and has contributed to projects spanning Ceilometer, Aodh, and CloudKitty, with a focus on making rating and chargeback capabilities more accessible in production OpenStack environments.
More like this
Why Operational Resilience and Digital Sovereignty Top the CIO Agenda
How Red Hat OpenShift 4.22 impacts enterprise AI’s bottom line
Avoiding Failure In Distributed Databases | Code Comments
Challenges In Solutions Engineering | Code Comments
Browse by channel

Automation
The latest on IT automation for tech, teams, and environments

Artificial intelligence
Updates on the platforms that free customers to run AI workloads anywhere

Open hybrid cloud
Explore how we build a more flexible future with hybrid cloud

Security
The latest on how we reduce risks across environments and technologies

Edge computing
Updates on the platforms that simplify operations at the edge

Infrastructure
The latest on the world’s leading enterprise Linux platform

Applications
Inside our solutions to the toughest application challenges
Virtualization
The future of enterprise virtualization for your workloads on-premise or across clouds