
You probably know that Grafana has excellent integration with Prometheus exporter. In fact, it comes with several prebuilt dashboards that can collect and display many types of metrics.
Now imagine that you also have your hosts organized in logical groups, and you have a nice Ansible inventory file where you list your hosts:
---
# Inventory host for a fictional network for the Nunez Barrios family
---
all:
  children:
    linux:
      hosts:
        macmini2:
        raspberrypi:
        dmaf5:
        mac-pro-1-1:
      vars:
        description: Linux servers for the Nunez Barrios family
    windows:
      hosts:
        windows01:
      vars:
        description: Windows Desktops/ laptops for the Nunez Barrios family
    osx:
      hosts:
        veronicalaptop
      vars:
        description: OSX Desktops/ laptops for the Nunez Barrios family
    pi:
      hosts:
        raspberrypi
      vars:
        description: Raspberry PI 4 servers for Nunez Barrios family
The Ansible playbooks will get access to this inventory like this:
$ ansible-inventory --inventory ~/grafana/Dashboards/hosts.yaml --list
{
    "_meta": {
        "hostvars": {
            "dmaf5": {
                "description": "Linux servers for the Nunez Barrios family"
            },
            "mac-pro-1-1": {
                "description": "Linux servers for the Nunez Barrios family"
            },
            "macmini2": {
                "description": "Linux servers for the Nunez Barrios family"
            },
            "raspberrypi": {
                "description": "Raspberry PI 4 servers for Nunez Barrios family"
            },
            "veronicalaptop": {
                "description": "OSX Desktops/ laptops for the Nunez Barrios family"
            },
            "windows01": {
                "description": "Windows Desktops/ laptops for the Nunez Barrios family"
            }
        }
    },
    "all": {
        "children": [
            "linux",
            "osx",
            "pi",
            "ungrouped",
            "windows"
        ]
    },
    "linux": {
        "hosts": [
            "dmaf5",
            "mac-pro-1-1",
            "macmini2",
            "raspberrypi"
        ]
    },
    "osx": {
        "hosts": [
            "veronicalaptop"
        ]
    },
    "pi": {
        "hosts": [
            "raspberrypi"
        ]
    },
    "windows": {
        "hosts": [
            "windows01"
        ]
    }
}
Normally, Ansible inventory files are well maintained and kept on a source-control repository like Git. Sometimes, sysadmins generate them dynamically. In this tutorial, I'll show you how to filter hosts by group in your Grafana dashboard using variables. I will also show how to populate those variables from the Ansible host inventory file (taking advantage of the groups).
By the time you complete this tutorial, you will have learned:
- How to install plugins in Grafana running inside a Podman container.
- How to create mock REST API endpoints to simulate a web service for quick prototyping using Mockoon.
- How to connect the mock REST API with Grafana to populate missing values on a panel that uses Prometheus data for monitoring.
- How to write a simple web service to provide a static host inventory file through a REST endpoint to Grafana.
You will need the following resources for this tutorial:
- A basic knowledge of Ansible inventories (not required but never hurts)
- A Fedora or RPM-based distribution, with elevated privileges (like sudo)
- A working Podman installation
- A working Grafana installation as described in detail on Grafana's website
- One or more nodes running the Prometheus node exporter. I will show you how to connect a Prometheus data source, but in reality, you can do this integration with any other Grafana data source.
- An editor like Vim, VSCode, or Pycharm to make changes to the templates included in the source code for this tutorial.
- Curiosity!
I'll begin with how to connect an Ansible inventory file with Grafana.
[ Get started with IT automation with the Ansible Automation Platform beginner's guide. ]
Choose a JSON data source: Pick your poison
There are several choices for the JSON data source. I will mention three of them and why I choose the one I did.
- Grafana Simple JSON is the official plugin, but it is deprecated (the last update was at least 16 months ago on GitHub). Stay away from it.
- simpod-json-data source is very complete and easy to use. The documentation is also well written and is actively maintained. However, I decided against it because:
- It will force you to generate the JSON with a well-defined structure that the plugin understands. This is not an issue for this demonstration, as I will craft the resulting JSON from scratch, but if you have an existing web service exporting JSON, this is less than convenient.
- The endpoint that shows the data (
/query) requires you to use the POST method (so you can pass search arguments). Not a big deal, but if you feel more at home using GET with query arguments, you are out of luck.
- JSON API is my favorite because:
- You can use an existing REST endpoint and get the fields you want using JSONPath expressions. You can also define an alias for the retrieved values.
- It is well documented and maintained.
- Installation is very easy.
[ Want to test your sysadmin skills? Take a skills assessment today. ]
For the Grafana installation, install the JSON API:
$ podman exec --interactive --tty grafana /bin/bash
I have no name!@ae23d7e1123e:grafana-cli plugins install marcusolsson-json-datasource
✔ Downloaded marcusolsson-json-datasource v1.3.1 zip successfully
Please restart Grafana after installing plugins. Refer to Grafana documentation for instructions if necessary.
exit
podman restart grafana
Now Grafana is now ready to pull data in JSON format, which you will use to customize the dashboard.
Working in reverse: Define how the REST-API will look using a mock
Before you start coding, you need an idea of what the API to be consumed by the JSON API plugin should look like. The following must be true:
GET /with 200 status code response. Use this for a "test connection" on the data source config page.GET /search, which you will use to filter servers by group.GET /query/{ansiblegroup}/, which you will use to return the list of all the available groups when searching by group.
So before writing any code to serve the Ansible inventory file contents, put together some fake data with the Grafana data source.
Faking it until it works using Mockoon
The definition of a mock is to mimic or resemble closely.
And that is exactly what you will do. Create a fake REST web service with a JSON good enough to connect to Grafana to simulate the web service. Once you're satisfied with the results, you can invest time writing the real REST endpoint.
First, install and run the Mockoon GUI:
$ sudo dnf install -y https://github.com/mockoon/mockoon/releases/download/v1.20.0/mockoon-1.20.0.rpm
...
Installed:
  mockoon-1.20.0-1.x86_64
Complete!
mockoon
It will look like something like this:

After experimenting with the GUI and following the documentation, create a REST mock:
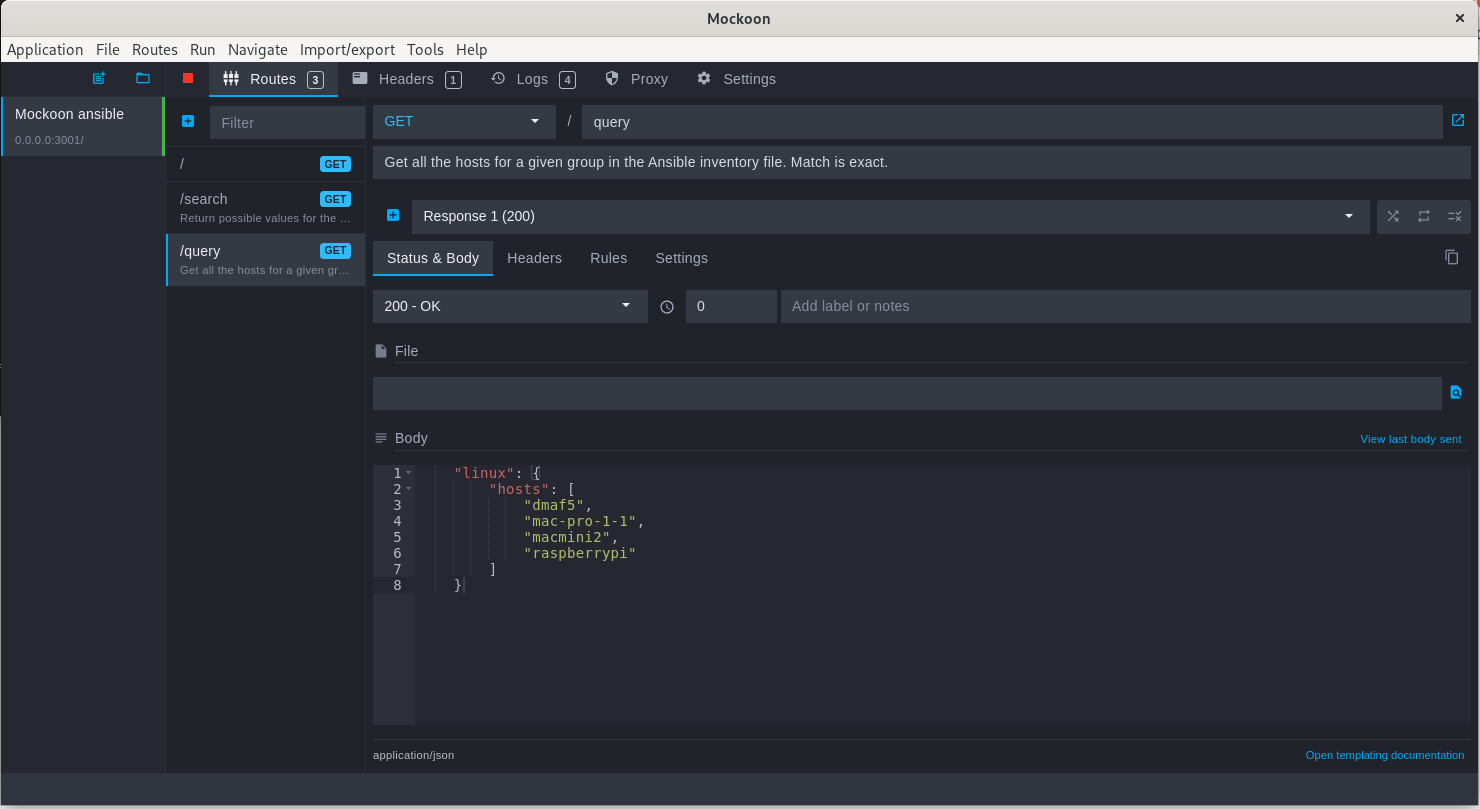
Unsurprisingly, it looks a lot like the Ansible inventory file converted to JSON format. That is the whole point of this exercise.
Here is how it looks when you run queries against it using curl:
[ Download the curl command cheat sheet. ]
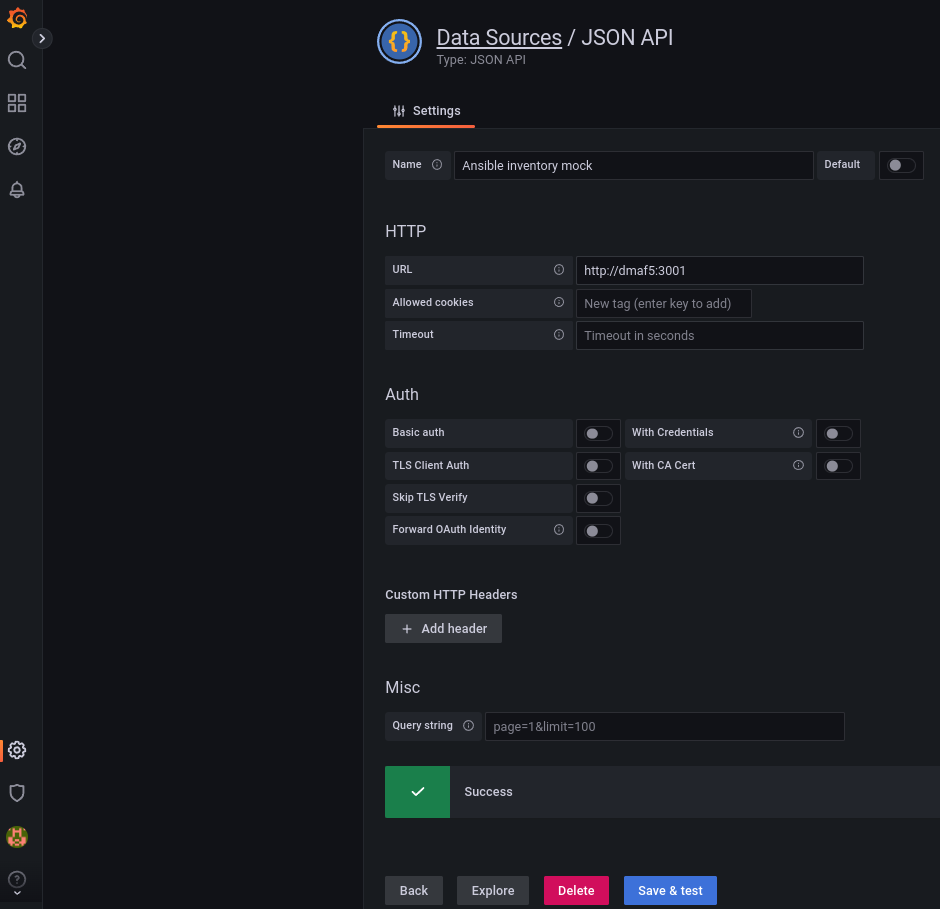
The next step is to construct the dashboard with data coming from Prometheus. First, create a new data source using the JSON API:
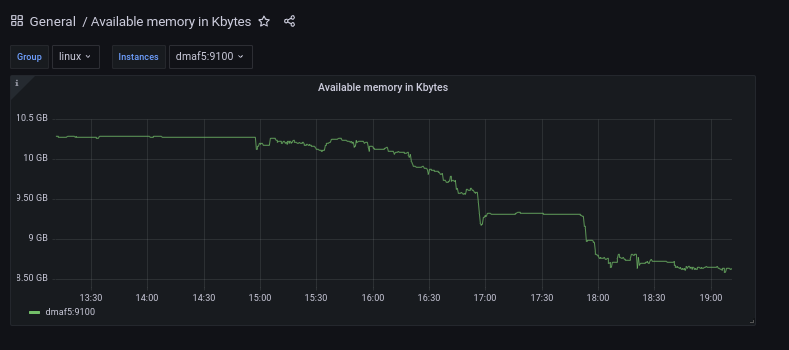
Next, create a dashboard. In this example, it will monitor available RAM in kilobytes over time:

Now add a variable that will hold the groups and the hosts. Also, you will have to "enrich" the name of the machine a little to match the label used by the Prometheus node. (Hint: A tool like jsonpath.com will help ensure the JSONPath expression is correct. I found the inline editor to be picky sometimes.)
You need two query variables. Here are the expressions:
- Get the list of all the groups:
jsonpath $.all.children[*]. It will return something likejson ["linux", "osx", "pi", "ungrouped", "windows" ]. Save a single result, like the first group, on a variable calledgroup. - Then using that
groupvariable (assume the members arelinux), you can query the list of hosts. For example to get all the linux machines,json $.linux.hosts[*]will display something likejson [ "dmaf5", "mac-pro-1-1", "macmini2", "raspberrypi"]. - But you need to make the group generic. Use the Grafana variables again, and the JSONPath becomes
json $.linux.${group}[*]. - This displays the list of hosts by group.
If you notice, Prometheus returns either a job (node-exporter) or an instance (raspberrypi:9100) for a given host. You can enrich the host list to make it look like a Prometheus instance by passing an extra argument to the query (enrich=true). It returned host like raspberrypi:9100 instead of raspberrypi.
[ Learn how to manage your Linux environment for success. ]
Not so fast: You're not getting any data for your variable!
You can try to get the list of all the available groups in the inventory from a JSON fragment like this:
{
  "all": {
        "children": [
            "linux",
            "osx",
            "pi",
            "ungrouped",
            "windows"
        ]
    }
}
But the variable creation doesn't work due to a bug involving parsing the nested children tag.
The JSON path renders the array-like results you're looking for, so what is going on here? (I'm using the Python jsonpath module to illustrate.)
(inventory)$ python
Python 3.9.9 (main, Nov 19 2021, 00:00:00)
[GCC 10.3.1 20210422 (Red Hat 10.3.1-1)] on linux
Type "help", "copyright", "credits" or "license" for more information.
>>> from jsonpath import JSONPath
>>> import json
>>> data=json.loads('''{
...   "all": {
...         "children": [
...             "linux",
...             "osx",
...             "pi",
...             "ungrouped",
...             "windows"
...         ]
...     }
... }''')
>>> query="$.all.children[*]"
>>> JSONPath(query).parse(data)
['linux', 'osx', 'pi', 'ungrouped', 'windows']
It is probably a bug on the plugin. To prove it, change the structure returned with Mockoon to remove the unnecessary children tag:
{
  "all": [
            "linux",
            "osx",
            "pi",
            "ungrouped",
            "windows"
        ]
}
Try Grafana again, and you should see that the structure is now parsed properly:
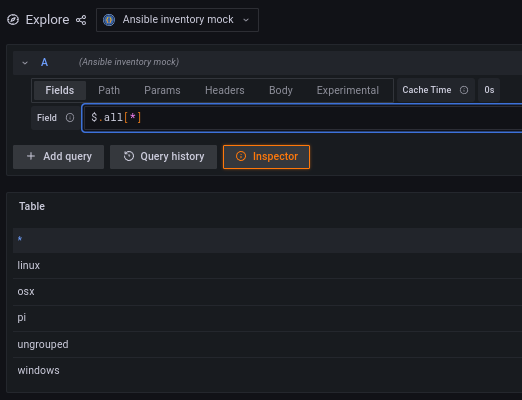
That's an example of the power of working with a Mock REST API for rapid prototyping.
Once you have the group, you can write a more intuitive REST endpoint that uses the group you selected in the previous step. For example, if you call /query/linux, you could get:
[ "dmaf5:9100", "mac-pro-1-1:9100", "macmini2:9100", "raspberrypi:9100" ]The second variable path looks like this (using the variable $group in the path expression):
/query${group}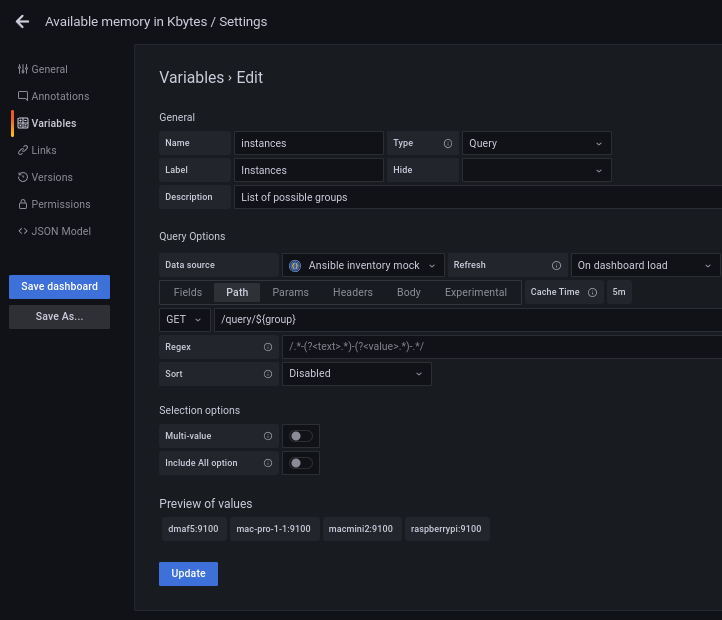
And the fields get as simple as $.[*]:
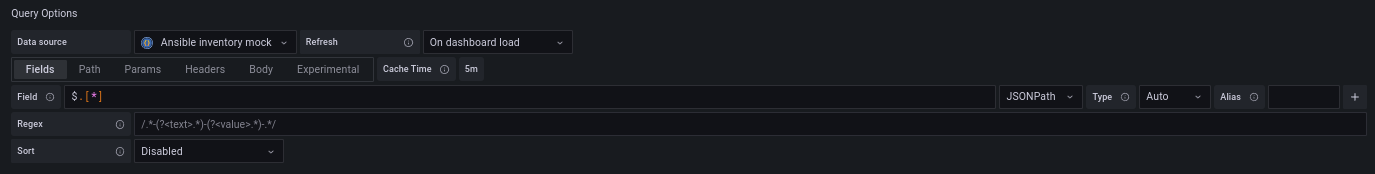
The two variables look like this at the end:
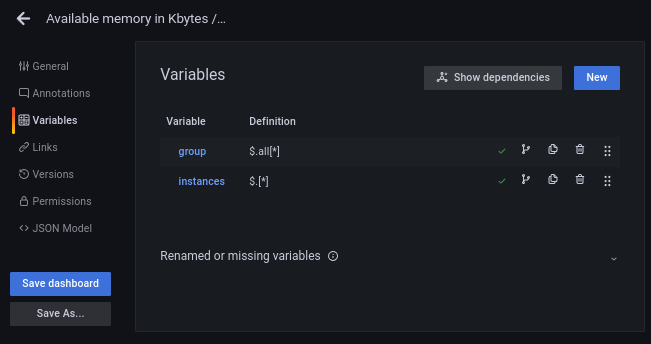
Now that you know what you want, you can focus on writing a web service with the required REST endpoints.
Getting real: Write a REST web service using FastAPI and Python
If you clone the project, then you can set it up to run the web service like this (passing the --reload-include '*.yaml' restarts the application if the inventory file changes):
$ sudo dnf install -y python3-pyyaml
$ python3 -m venv --system-site-packages ~/virtualenv/inventory
. ~/virtualenv/inventory/bin/activate
$ pip install --upgrade pip
$ pip install --upgrade build
$ pip install --upgrade wheel
$pip install --editable .
uvicorn --host 0.0.0.0 --reload --reload-include '*.yaml' inventory.main:app
You can quickly test the REST API on a different terminal:
The only change you need to make now is to create a new data source pointing to the web service (not the one running Mockoon) and see it in action:
What's next?
- Grafana's ability to mix multiple data sources to create a comprehensive view of a system is a powerful tool. Each data source offers various parameters to filter and transform the data, and you saw how you could combine two by using variables.
- FastAPI is a great tool to create REST API endpoints. I didn't cover automated testing, and this is something you should read about.
- Mockoon offers several fancy features like partial proxy (when you don't want to mock a whole service) or serving files as a response. It is worth your time to take a look.
- It is easy to start services with Podman. What if you want to coordinate the startup to start the Ansible web service you wrote and then launch Grafana? You can use docker compose for that.
- I used Python JSONPath but did not explain its features in detail; it is worth adding to the list of tools in your arsenal.
About the author
Proud dad and husband, software developer and sysadmin. Recreational runner and geek.
More like this
From alert fatigue to automated action: Automated patching in the AI era
Why automated network configuration assurance matters for enterprise NetOps
Operating System Management | Compiler
Technically Speaking | Taming AI agents with observability
Browse by channel

Automation
The latest on IT automation for tech, teams, and environments

Artificial intelligence
Updates on the platforms that free customers to run AI workloads anywhere

Open hybrid cloud
Explore how we build a more flexible future with hybrid cloud

Security
The latest on how we reduce risks across environments and technologies

Edge computing
Updates on the platforms that simplify operations at the edge

Infrastructure
The latest on the world’s leading enterprise Linux platform

Applications
Inside our solutions to the toughest application challenges
Virtualization
The future of enterprise virtualization for your workloads on-premise or across clouds