Nigel's Monitor (nmon) is a system performance monitoring tool originally developed by IBM for the AIX operating system and later ported for Linux on several CPU architectures.
The main benefit of nmon is that it allows you to monitor different aspects of your system, such as CPU utilization, memory, disk busy, network utilization, and more, in a single, concise view. Without nmon, you have to use specialized monitoring tools like top for processes, iostat for disks, and ifstat for the network to monitor various resources. Each of them presents the data differently.
I used nmon for the first time about 10 years ago as an AIX sysadmin. By using nmon, I was able to troubleshoot some hard-to-spot issues, including one that initially seemed like a network bottleneck. By inspecting several resources simultaneously using nmon, I discovered it was an application issue caused by opening too many files.
In addition to interactively monitoring your system, you can also use nmon in batch mode to collect and save performance data for analysis. For more information about nmon for Linux, consult the project's official page.
This article looks at this powerful monitoring tool. Start by installing it.
Install nmon
nmon is available in the default repository of many Linux distributions. For example, use DNF to install it on Fedora 35:
$ sudo dnf -y install nmon
For Red Hat Enterprise Linux or CentOS, nmon is available in the Extra Packages for Enterprise Linux (EPEL) repository.
To install nmon, first enable EPEL:
$ sudo dnf -y install \
https://dl.fedoraproject.org/pub/epel/epel-release-latest-8.noarch.rpm

$ sudo dnf repolist
Then install nmon using dnf:
$ sudo dnf -y install nmon
Now that you have installed nmon, use it to monitor your system.
Use nmon interactively
With the applications installed, you can monitor your system interactively by running nmon. You're presented with an initial screen containing system information and a little help menu, displaying which keys you can press to toggle different metrics:
$ nmon

┌─16k──[H for help]──Hostname=f35ks01─Refresh= 2secs ─18:04:27────┐
│                                                                 │
│------------------------------                                   │
│ _ __  _ __ ___   ___  _ __    For help type H or ...            │
│| '_ \| '_ ` _ \ / _ \| '_ \    nmon -?  - hint                  │
│| | | | | | | | | (_) | | | |   nmon -h  - full details          │
│|_| |_|_| |_| |_|\___/|_| |_|                                    │
│                               To stop nmon type q to Quit       │
│------------------------------                                   │
│                                                                 │
│Fedora release 35 (Thirty Five) VERSION="35 (Thirty Five)"       │
│Vendor=AuthenticAMD Model=AMD EPYC-Milan Processor               │
│MHz=1911.004 bogomips=3822.00     lscpu:CPU=4 Little Endian      │
│ProcessorChips=4 PhysicalCores=1        Sockets=4 Cores=1 Thrds=1│
│                 VirtualCPUs =4         MHz=0 max=0 min=0        │
│                                                                 │
│Use these keys to toggle statistics on/off:                      │
│  c = CPU         l = CPU Long-term     - = Faster screen updates│
│  C = " WideView  U = Utilisation       + = Slower screen updates│
│  m = Memory      V = Virtual memory    j = File Systems         │
│  d = Disks       n = Network           . = only busy disks/procs│
│  r = Resource    N = NFS               h = more options         │
│  k = Kernel      t = Top-processes     q = Quit                 │
│─────────────────────────────────────────────────────────────────│
For example, pressing C toggles the CPU utilization display:
┌─16k──[H for help]──Hostname=f35ks01─Refresh= 2secs ─18:05:58─┐
│ CPU Utilisation ─────────────────────────────────────────────│
│---------------------------+---------------------------------+│
│CPU User%  Sys% Wait%  Idle|0          |25   |50 |75   100|   │
│  1   3.6  17.2   0.0  79.2|Ussssssss>                    |   │
│  2   2.1   6.2   0.0  91.7|Usss    >                     |   │
│  3   0.0   1.1   0.0  98.9| >                            |   │
│  4   6.1  17.2   0.0   0.5|UUUssssssss>                  |   │
│---------------------------+---------------------------------+│
│Avg   3.0  10.3   0.0  86.7|Usssss>                       |   │
│---------------------------+---------------------------------+│
│──────────────────────────────────────────────────────────────│
Pressing N toggles the network display and automatically stacks it under the CPU display:
┌─16k──[H for help]──Hostname=f35ks01─Refresh= 2secs ─18:17:01─┐
│ CPU Utilisation ─────────────────────────────────────────────│
│---------------------------+---------------------------------+│
│CPU User%  Sys% Wait%  Idle|0         |25    |50  |75  100|   │
│  1   2.6  10.3   0.0  87.1|Usssss     >                  |   │
│  2   0.0   2.2   0.0  97.8|s           >                 |   │
│  3   6.5  11.0   0.0  82.5|UUUsssss>                     |   │
│  4   0.0   0.5   0.0  99.5|               >              |   │
│---------------------------+---------------------------------+│
│Avg   2.4   5.9   0.0  91.6|Uss     >                     |   │
│---------------------------+---------------------------------+│
│ Network I/O ─────────────────────────────────────────────────│
│I/F Name Recv=KB/s Trans=KB/s p_in p_out in_sz out_sz Peak->..│
│      lo      0.0       0.0       0.0    0.0     0.0    0.0...│
│  enp1s0      0.0       0.0       0.5    0.0    52.0    0.0...│
│  enp7s0    218.6    5923.4    3335.5 9989.68   67.1  607.2...│
│ Network Error Counters ──────────────────────────────────────│
│I/F Name iErrors iDrop iOverrun iFrame oErrors   oDrop oOver..│
│      lo       0       0       0       0       0       0   ...│
│  enp1s0       0   34419       0       0       0       0   ...│
│  enp7s0       0   34419       0       0       0       0   ...│
│──────────────────────────────────────────────────────────────│
Continue to press other keys to stack additional metrics in the same view. For example, use D for Disk I/O, M for Memory, and T for Top processes.
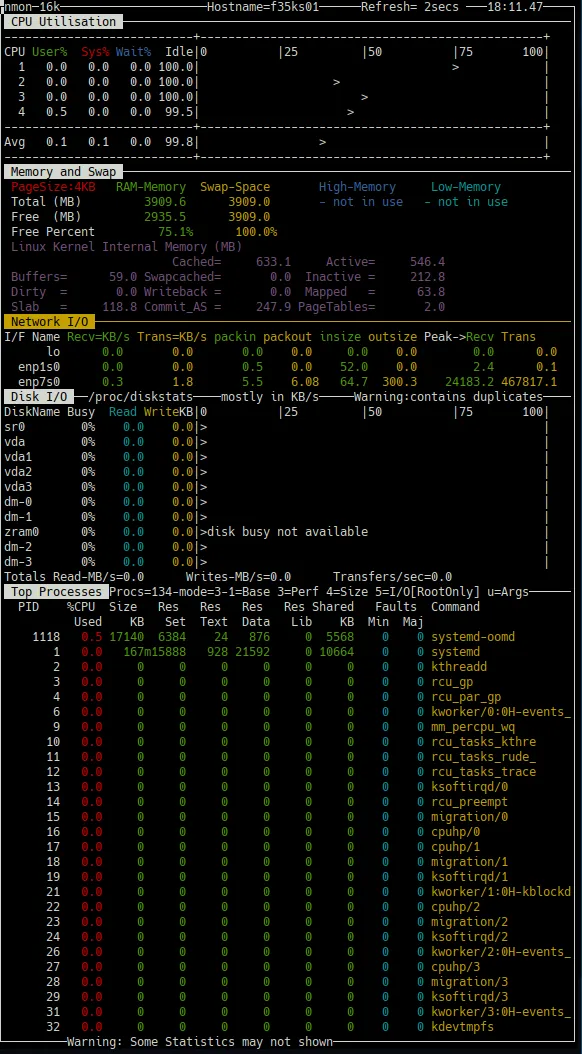
In addition to stacking new monitors, you can also press the dot or period key (.) to display only busy CPUs and disks, as well as + and - to increase or decrease the screen refresh time. Use H to display help.
Because you can enable and disable different monitors and metrics at any time, nmon is a highly flexible tool that helps you to understand your system's behavior. It also aids in troubleshooting issues by displaying different metrics simultaneously, providing a holistic view of the system and improving your ability to understand issues.
When you're done, press Q to quit and end the monitoring session.
Collect performance data
In addition to providing a holistic, interactive view of your system, you can also run nmon in batch mode to collect long-time performance data from your system for posterior analysis.
This feature allows you to understand how your system behaves over a longer period, in addition to the real-time metrics provided by the interactive mode. It's a powerful feature that enables capacity planning and the opportunity to troubleshoot sporadic issues that are hard to catch live.
To run nmon in batch, use the flag -f when launching the application. It has to be the first parameter provided. By default, nmon collects data every five minutes for one day. You can change these default values by specifying the parameters -s for collection interval and -c for the number of snapshots.
For example, to enable nmon in batch mode, collecting data every minute for one hour, including capturing of top processes -t, execute this command:
$ nmon -f -s60 -c60 -t
Your terminal prompt returns immediately, as the application runs in the background when you execute this command. You can see it running by using ps:
$ ps -ef | grep nmon
ricardo 1849 1 0 12:27 pts/0 00:00:00 nmon -f -s60 -c60 -t
In batch mode, nmon saves the collected data using the comma-separated value (CSV) format with the extension .nmon in the current directory:
$ ls -l
total 36
-rw-r--r--. 1 ricardo ricardo 36395 Feb 13 12:28 f35ks01_220213_1227.nmon
Since this is a CSV file, you can process it using other Linux text manipulation command-line tools, or open it using spreadsheet software for further analysis.
$ head f35ks01_220213_1227.nmon
AAA,progname,nmon
AAA,command,nmon -f -s60 -c60 -t
AAA,version,16k
AAA,disks_per_line,150
AAA,max_disks,256,set by -d option
AAA,disks,10,
AAA,host,f35ks01
AAA,user,ricardo
AAA,OS,Linux,5.16.8-200.fc35.x86_64,#1 SMP PREEMPT Tue Feb 8 20:58:59 UTC 2022,x86_64
AAA,runname,f35ks01
In addition to these methods, the nmon development team provides a script to convert this data into charts that you can visualize using your web browser. I'll look at how to do that next.
[ It wouldn't be Linux if there weren't a dozen ways to perform any task. For info on the various ways to install software, download this guide to installing applications on Linux. ]
Generate charts
CSV is a flexible format that allows you to export, analyze, and view this data using different applications such as spreadsheet processor software. The nmon developers created nmonchart to make it a little easier. This shell script converts this data to HTML using Google Charts JavaScript to visualize and interact with the data in a graphical environment.
To use nmoncart, download it from the nmon home page:
$ curl -LO http://sourceforge.net/projects/nmon/files/nmonchart40.tar
Then extract the package's content using tar:
$ mkdir nmonchart

$ tar xvf nmonchart40.tar -C nmonchart
nmonchart uses the Korn shell (ksh), so to create charts, first install ksh in your system using dnf:
$ sudo dnf install -y ksh
Next, convert the .nmon file created when you executed nmon in batch mode with this command:
$ ./nmonchart/nmonchart f35ks01_220213_1227.nmon
The script creates an HTML file with the same name as the source .nmon file. Optionally, you can provide the destination file name as a second parameter to nmonchart. Here is an example:
$ ls -lg
total 4164
-rw-r--r--. 1 ricardo 113822 Feb 14 18:52 f35ks01_220213_1227.html
-rw-r--r--. 1 ricardo 93436 Feb 13 13:26 f35ks01_220213_1227.nmon
drwx------. 2 ricardo 4096 Aug 28 2020 nmonchart
Your system charts are now ready. Your next step is to view them.
[ Get the Bash shell scripting cheat sheet. ]
Visualize performance charts
nmonchart creates a single HTML file for each .nmon source file you provide with the required charting JavaScript libraries embedded. If you have the HTML file on your local machine, view it directly in your web browser.
You can also serve these files using a web server. One of my favorite ways to do this is by using Nginx in a Podman container, as I suggested in 20 one-line Linux commands to add to your toolbox.
First, create a directory and move the HTML files there:
$ mkdir html

$ mv f35ks01_220213_1227.html html/
Then use Podman to serve content from the html directory using Nginx on port 8080:
$ podman run --rm -v ./html:/usr/share/nginx/html:ro,Z -p 8080:80 -d nginx
If required, open port 8080 on your server's firewall to allow traffic:
$ sudo firewall-cmd --add-port 8080/tcp
Then point your browser to your URL http://<YOUR_SERVER_IP_ADDR>:8080/f35ks01_220213_1227.html to view the charts:

Click on any of the buttons at the top of the screen to view the corresponding chart. The charts are interactive. You can zoom in and out to view more granular data or hover your mouse over the chart to see detailed data for a given time.
Wrap up
nmon is a flexible and powerful system-monitoring application that helps you better understand your system and troubleshoot it in case of issues. Its combined capabilities of monitoring and consolidating real-time data from different system resources with long-term performance data collection and analysis make it a fantastic tool to have in your sysadmin belt.
About the author

Ricardo Gerardi is a Principal Consultant at Red Hat, having transitioned from his previous role as a Technical Community Advocate for Enable Sysadmin. He's been at Red Hat since 2018, specializing in IT automation using Ansible and OpenShift.
With over 25 years of industry experience and 20+ years as a Linux and open source enthusiast and contributor, Ricardo is passionate about technology. He is particularly interested in hacking with the Go programming language and is the author of Powerful Command-Line Applications in Go and Automate Your Home Using Go. Ricardo also writes regularly for Red Hat and other blogs, covering topics like Linux, Vim, Ansible, Containers, Kubernetes, and command-line applications.
Outside of work, Ricardo enjoys spending time with his daughters, reading science fiction books, and playing video games.
More like this
More than meets the eye: Behind the scenes of Red Hat Enterprise Linux 10 (Part 5)
AI insights with actionable automation accelerate the journey to autonomous networks
Technically Speaking | Taming AI agents with observability
Should Managers Code? | Compiler
Browse by channel

Automation
The latest on IT automation for tech, teams, and environments

Artificial intelligence
Updates on the platforms that free customers to run AI workloads anywhere

Open hybrid cloud
Explore how we build a more flexible future with hybrid cloud

Security
The latest on how we reduce risks across environments and technologies

Edge computing
Updates on the platforms that simplify operations at the edge

Infrastructure
The latest on the world’s leading enterprise Linux platform

Applications
Inside our solutions to the toughest application challenges
Virtualization
The future of enterprise virtualization for your workloads on-premise or across clouds