
Streamlit is an open source data visualization framework written in Python. In Display your application data with Streamlit, I introduced the framework and provided some basic examples of how to use it.
This article expands on the previous one, covering the following topics:
- Using Ansible to set up a Prometheus Node Exporter and a scraper to collect metrics about your system.
- Connecting to the Prometheus scraper to get the metrics and display them in real-time using Streamlit.
You will need the following to complete the tutorial:
- Elevated permissions to install Prometheus Node Exporter and the scraper.
- Some experience with Python programming.
- Curiosity!
The first step is to learn how to collect metrics over time from your machines using Prometheus.
Monitor memory utilization periodically from host machines
Prometheus is an open source framework created to collect metrics about your system. It also provides visualization, efficient storage, and many other cool features.
In a typical on-premises Prometheus setup, you have one or more Node Exporters collecting data and a main scraper aggregating the data from all those nodes.
You can visualize the collected data directly on your agent using the local URL http://prometheuscollector:9090/, or you can have another visualization tool, like Grafana, talk to the collector.
In this article, I'll develop a Streamlit application that talks to Prometheus to visualize this data. First, I'll look at some of the required components.
The Prometheus collector (scraper)
Say your homelab has two machines, named raspberrypi and dmaf5, both running Prometheus Node Exporter agents. You can set up your Prometheus scraper configuration prometheus.yaml to reflect:
---
global:
    scrape_interval: 30s
    evaluation_interval: 30s
    scrape_timeout: 10s
    external_labels:
        monitor: 'nunez-family-lab-monitor'

scrape_configs:
    - job_name: 'node-exporter'
      static_configs:
          - targets: ['raspberrypi.home:9100', 'dmaf5.home:9100']
How can you install all the data acquisition pieces? You can use an Ansible playbook for that.
[ Write your first Ansible playbook in this hands-on interactive lab. ]
Provision metrics collection (or how to automate the boring stuff with Ansible)
Put the following pieces together for the automation recipe to work:
- Inventory file: Tells Ansible where to install and deploy the Node Exporter agents
- Template to set up the Prometheus daemon that collects the metrics
- Systemd unit files for Prometheus and Node Exporter. The Node Exporter runs on each node, and Prometheus runs on the master node.
- This playbook that orchestrates all the actions, from copying configurations, to downloading software, and finally starting processes:
# Playbook to provision Prometheus scraper and node-exporter servers
# Download binaries from: https://prometheus.io/download/#prometheus
# Checked with: ansible-lint provision_prometheus.yaml
---
- name: Setup Prometheus on your home lab
  hosts: home_lab
  become_user: root
  become: true
  vars:
    prometheus_scraper_version: "2.42.0"
    prometheus_node_exporter_version: "1.5.0"
    prometheus_url: "https://github.com/prometheus/prometheus/releases/download"
    exporter_url: "https://github.com/prometheus/node_exporter/releases/download"
    prometheus_node_exporter_port: 9100
    prometheus_install_dir: "/opt/prometheus"
    prometheus_data_dir: "/data/prometheus"
    prometheus_conf_dir: "/etc/prometheus"
    prometheus_checksum:
      amd64: "422dab055ed9c7bcaff52b718705f9192c6fac0de6b7e78dd278e70ee2663dcc"
      arm64: "b947e4890d221f6b1d09c963fd0440720f2b5d08c29e190d6365f4b3d3e92a9d"
    prometheus_node_exporter_checksum:
      amd64: "af999fd31ab54ed3a34b9f0b10c28e9acee9ef5ac5a5d5edfdde85437db7acbb"
      arm64: "e031a539af9a619c06774788b54c23fccc2a852d41437315725a086ccdb0ed16"
  tasks:
    - name: Set architecture (home lab has amd64 and arm64)
      ansible.builtin.set_fact:
        prom_arch: "{{ 'amd64' if ansible_architecture == 'x86_64' else 'arm64' }}"
    - name: Prometheus user
      tags: user
      ansible.builtin.user:
        name: prometheus
        system: true
        create_home: false
        comment: "Prometheus service account"
        shell: /sbin/nologin
        state: present
    - name: Prometheus install directory
      ansible.builtin.file:
        state: directory
        owner: "prometheus"
        mode: 0755
        path: "{{ prometheus_install_dir }}"
    - name: Scraper management
      when: "'master_lab' in group_names"
      block:
        - name: Install Prometheus Scraper
          tags: scraper
          ansible.builtin.get_url:
            dest: "/tmp/prometheus-{{ prometheus_scraper_version }}.linux-{{ prom_arch }}.tar.gz"
            url: "{{ prometheus_url }}/v{{ prometheus_scraper_version }}/prometheus-{{ prometheus_scraper_version }}.linux-{{ prom_arch }}.tar.gz"
            checksum: "sha256:{{ prometheus_checksum[prom_arch | default('arm64')] }}"
            mode: "u=rw"
        - name: Unpack Prometheus Scraper
          tags: unpack_scraper
          ansible.builtin.unarchive:
            remote_src: true
            owner: "prometheus"
            group: "prometheus"
            src: "/tmp/prometheus-{{ prometheus_scraper_version }}.linux-{{ prom_arch }}.tar.gz"
            dest: "{{ prometheus_install_dir }}"
          notify:
            - Restart Prometheus
        - name: Prometheus config directory
          ansible.builtin.file:
            state: directory
            owner: "prometheus"
            group: "prometheus"
            mode: 0770
            path: "{{ item }}"
          loop:
            - "{{ prometheus_conf_dir }}"
            - "{{ prometheus_data_dir }}"
        - name: Install Prometheus configuration
          tags: config_prometheus_copy
          ansible.builtin.template:
            src: templates/prometheus.yaml.j2
            dest: /etc/prometheus/prometheus.yaml
            owner: prometheus
            group: prometheus
            mode: 0644
          notify:
            - Restart Prometheus
        - name: Install Prometheus systemd unit
          tags: systemd_prometheus_copy
          ansible.builtin.template:
            src: templates/prometheus.service.j2
            dest: /etc/systemd/system/prometheus.service
            owner: root
            group: root
            mode: 0644
          notify:
            - Restart Prometheus
        - name: Make sure Prometheus is running
          tags: systemd_prometheus_start
          ansible.builtin.systemd:
            state: started
            name: prometheus
            enabled: true
            daemon_reload: true
    - name: Install Prometheus Node exporter
      tags: exporter
      ansible.builtin.get_url:
        dest: "/tmp/node_exporter-{{ prometheus_node_exporter_version }}.linux-{{ prom_arch }}.tar.gz"
        url: "{{ exporter_url }}/v{{ prometheus_node_exporter_version }}/node_exporter-{{ prometheus_node_exporter_version }}.linux-{{ prom_arch }}.tar.gz"
        checksum: "sha256:{{ prometheus_node_exporter_checksum[prom_arch | default('arm64')] }}"
        mode: "u=rw"
    - name: Unpack Node exporter
      tags: unpack_exporter
      ansible.builtin.unarchive:
        remote_src: true
        owner: "prometheus"
        group: "prometheus"
        src: "/tmp/node_exporter-{{ prometheus_node_exporter_version }}.linux-{{ prom_arch }}.tar.gz"
        dest: "{{ prometheus_install_dir }}"
      notify:
        - Restart Node Exporter
    - name: Install Node Exporter systemd unit
      tags: systemd_node_exporter_copy
      ansible.builtin.template:
        src: templates/node_exporter.service.j2
        dest: /etc/systemd/system/node_exporter.service
        owner: root
        group: root
        mode: 0644
      notify:
        - Restart Node Exporter
    - name: Install Node Exporter environment overrides
      tags: systemd_node_exporter_env
      ansible.builtin.copy:
        src: files/prometheus-node-exporter
        dest: /etc/default/prometheus-node-exporter
        owner: root
        group: root
        mode: 0644
      notify:
        - Restart Node Exporter
    - name: Make sure Node Exporter is running
      tags: systemd_node_exporter_start
      ansible.builtin.systemd:
        state: started
        name: node_exporter
        enabled: true
        daemon_reload: true
  handlers:
    - name: Restart Node Exporter
      tags: restart_node_exporter
      ansible.builtin.service:
        name: node_exporter
        state: restarted
    - name: Restart Prometheus
      tags: restart_prometheus
      ansible.builtin.service:
        name: prometheus
        state: restarted
You can see it in action:
$ ansible-playbook --inventory inventory provision_prometheus.yaml
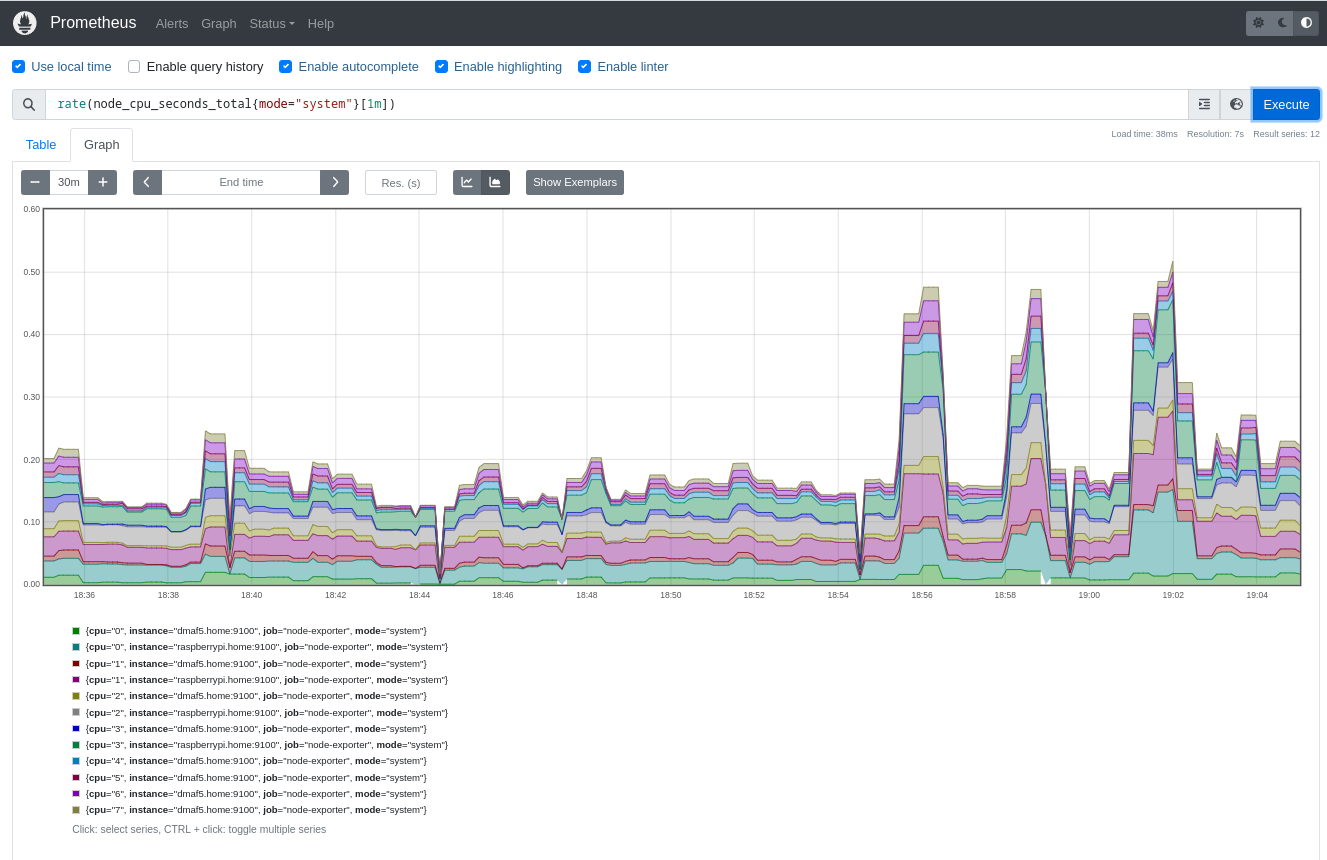
After running the playbook, you can check whether it collects data by connecting to the Prometheus host you set up in your inventory using the URL http://prometheuscollector:9090/. Then you can run queries using PromQL like this one:
rate(node_cpu_seconds_total{mode="system"}[1m])
Display Prometheus metrics with Streamlit
Prometheus supports queries using the PromQL language. It also offers a REST API to expose those metrics to clients.
To demonstrate how the monitoring works, use the following metric:
node_memory_MemFree_bytes
If you query the scraper node, it returns a JSON response like this:
{
 "status": "success",
 "data": {
  "resultType": "matrix",
  "result": [
   {
    "metric": {
     "__name__": "node_memory_MemFree_bytes",
     "instance": "dmaf5.home:9100",
     "job": "node-exporter"
    },
    "values": [
     [
      1678066203.119,
      "1086185472"
     ],
     [
      1678066233.119,
      "1086185472"
     ],
     [
      1678066263.119,
      "1086185472"
     ]
    ]
   }
  ]
 }
}
You can see the full example in my GitHub repo.
The next step is writing a simple Streamlit application to collect the metrics and display them using a line chart:
import json
import logging
from datetime import datetime, timedelta
from json.decoder import JSONDecodeError
import os
import textwrap
import altair
import requests
import streamlit as st
from pandas import DataFrame, Series, Timestamp
from numpy import float64
from requests import HTTPError, RequestException

MINUTES_BACK = 60
DEFAULT_TIME_BACK = timedelta(minutes=-MINUTES_BACK)
DEFAULT_QUERY = 'node_memory_MemFree_bytes'
STEP_DURATION = "30s"


@st.cache_data
def full_url(url: str, has_time_range: bool = True) -> str:
    if has_time_range:
        return f"{url}/api/v1/query_range"  # Range query
    return f"{url}/api/v1/query"  # Instant query


def get_metrics(
        the_payload: dict[str, any],
        url: str,
        start_range: datetime = None,
        end_range: datetime = None
) -> (dict[any, any], int):
    new_query = {}
    new_query.update(the_payload)
    if start_range and end_range:
        new_query['start'] = start_range.timestamp()
        new_query['end'] = end_range.timestamp()
        new_query['step'] = STEP_DURATION
    logging.info("url=%s, params=%s", url, new_query)
    response = requests.get(url=url, params=new_query)
    return response.json(), response.status_code


def transform(m_data: dict[any, any]) -> DataFrame:
    """
    Convert a Prometheus data structure into a Panda DataFrame
    :param m_data:
    :return: DataFrame
    """
    df = DataFrame({
        mtr['metric']['instance']: Series(
            data=[float64(vl[1]) for vl in mtr['values']],
            index=[Timestamp(vl[0], unit='s') for vl in mtr['values']],
            name="Free memory (bytes)"
        ) for mtr in m_data['data']['result']
    })
    logging.info(f"Columns: {df.columns}")
    logging.info(f"Index: {df.index}")
    logging.info(f"Index: {df}")
    return df


if __name__ == "__main__":

    st.title("Realtime Prometheus monitoring")
    data_load_state = st.text('No data loaded yet...')
    if 'PROMETHEUS_URL' not in os.environ:
        st.markdown("## Please define the following environment variable and restart this application (example below):")
        st.code(textwrap.dedent(f"""
        PROMETHEUS_URL="http://raspberrypi:9090/"
        export PROMETHEUS_URL
        streamlit run {__file__}
        """))
        st.markdown(
            "New to Prometheus?. Please check the [Official](https://prometheus.io/docs/prometheus/latest/querying/api/) documentation")
        data_load_state.error("No data was loaded.")
    else:
        code = 0
        metrics = {}
        try:
            PROM_URL = full_url(os.environ['PROMETHEUS_URL'], has_time_range=True)
            st.info(f"Using '{PROM_URL}'")
            query = DEFAULT_QUERY
            payload = {'query': query}
            # First query we boostrap with a reasonable time range
            END: datetime = datetime.now()
            START = END + DEFAULT_TIME_BACK
            if payload:
                (graph, raw) = st.tabs(["Time Series", "Debugging"])
                metrics, code = get_metrics(
                    url=PROM_URL,
                    the_payload=payload,
                    start_range=START,
                    end_range=END,
                )
                data: DataFrame = DataFrame()
                if code == 200:
                    now = datetime.now()
                    data_load_state.info(f"Metrics data refreshed ({now}).")
                    logging.info(f"Metrics data refreshed ({now}).")
                    try:
                        data = transform(m_data=metrics)
                        with graph:
                            st.title("Time series")
                            # See auto-refresh dilema: https://github.com/streamlit/streamlit/issues/168
                            if st.button('Click to refresh!'):
                                st.write("Refreshing")
                                st.experimental_rerun()
                            # st.line_chart(data=data)
                            # You can see all the possible type encodings here:
                            # https://altair-viz.github.io/altair-tutorial/notebooks/02-Simple-Charts.html
                            chart = (
                                altair.Chart(data.stack().rename("value").reset_index()).mark_line().encode(
                                    x="level_0:T",
                                    y="value:Q",
                                    color="level_1"
                                )
                            )
                            st.altair_chart(chart, use_container_width=True)

                    except ValueError as val:
                        st.exception(val)
                    with raw:
                        if not data.empty:
                            st.title("DataFrame for Free memory (bytes)")
                            st.dataframe(data)
                        st.title("Query:")
                        st.markdown(f"```{query}, start={START}, end={END}```")
                        st.title("Prometheus data:")
                        st.json(metrics)
                else:
                    st.warning(f"Hmm, invalid query?: {query}")
                    st.warning(json.dumps(metrics, indent=True))
        except (HTTPError, JSONDecodeError, RequestException, KeyError) as exp:
            st.error(f"There was a problem while running the query (HTTP_CODE={code})...")
            if isinstance(exp, KeyError):
                st.code(f"Metrics={json.dumps(metrics, indent=True)}...")
            st.exception(exp)
A few things to note:
- The data source is a Prometheus scraper that returns a JSON document. It's converted to a Pandas DataFrame, one of the most well-supported formats on Streamlit.
- Next, it adds the graphical components; one tab to show the time-series data and the other to display the data and queries in tabular format for debugging purposes.
- It also adds a button to refresh the plot data manually. There are ways to auto-refresh the contents.
Before running the application, reload the Python virtual environment you created for Streamlit. For additional information, revisit Display your application data with Streamlit.
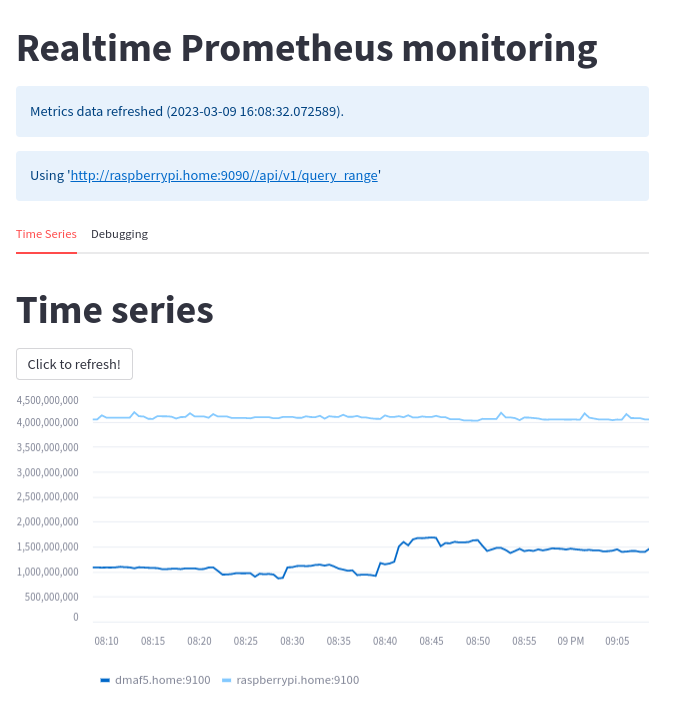
What does it look like? See it in this screenshot of the Prometheus times-series line chart:
Here is the debugging tab, where you can see the raw data, queries, and other useful stuff:

Next, I'll compare Steamlit with other popular visualization tools to help you decide if it's a good fit for a DevOps or systems administrator.
Compare Streamlit with other visualization tools
A brief comparison of Grafana, InfluxDB, and Streamlit out-of-the-box capabilities can help you decide which one to use. As usual, no single tool can do everything, and you most likely will need a mix of them.
For this analysis, the focus is on observability in general. Some features may be more or less appealing to you.
All three open source solutions support tables and time series graphics. Specific features of each (and that may be particularly interesting if your focus is on data science) include:
- Grafana 9.4:
- InfluxDB 2.6.1:
- Embedded alerting: Yes
- Multiple data sources: No
- Supported languages: Flux, InFluxQL
- Automatic data refresh: Yes
- Easy to write a "live" paper? Supports Markdown but requires write permission on the dashboard
- Streamlit 1.20.0:
- Embedded alerting: No, requires external libraries and logic
- Multiple data sources: Yes
- Supported languages: Python
- Automatic data refresh: No, DIY
- Easy to write a "live" paper? Full freedom with Markdown, videos, intermixed
These three tools overlap in many areas, but there are key differences:
- They can all run in containers, which may simplify their deployment.
- Grafana is the most feature-rich and needs to interface with an external data source like Prometheus, InfluxDB, or a JSON REST service to visualize data. It is not a database and has powerful alerting mechanisms (email, chat applications, and more).
- InfluxDB is a time-series database that also has dashboards and alerting capabilities, though more limited than Grafana.
- Streamlit is a framework written in Python for data science applications. It can interface with infinite data sources. Among these three, it's the easiest to set up, but it is not a database and has no alerting capabilities.
So which one should you use? It depends. If you need quick prototyping and no alerting, Streamlit is a good fit; if you only need a database with simple visualization and alerting, then InfluxDB is for you; and for a more complete solution, although it's more complex to set up, you can't go wrong with Grafana.
Not everything is dashboards: A TCP port tester written with a Streamlit GUI
As a bonus, I wrote a simple TCP port scanner with Streamlit. You just need to define a YAML configuration file that tells the app which machines and ports to scan:
# Description of host and TCP ports to check
---
hosts:
  - name: raspberrypi.home
    ports:
      - 3000
      - 22
      - 9090
  - name: dmaf5.home
    ports:
      - 22
  - name: www.redhat.com
    ports:
      - 80
      - 443
  - name: github.com
    ports:
      - 80
      - 443
[ Get the YAML cheat sheet ]
The script goes through every port and checks if it's open or not. Note that this app is not meant to be stealth, and it's not fast, as it performs a sequential port scan:
#!/usr/bin/env python3
import logging
import textwrap
import socket
from typing import Any
from yaml import load
import streamlit as st

try:
    from yaml import CLoader as Loader
except ImportError:
    from yaml import Loader


PROGRESS_TEXT = "Scanning hosts. Please wait"


def check_tcp_port_xmas(dst_ip: str, dst_port: int) -> str:
    try:
        with socket.socket(socket.AF_INET, socket.SOCK_STREAM) as sock:
            result = sock.connect_ex((dst_ip, dst_port))
            if result == 0:
                return "Open"
            else:
                return "Closed"
    except (TypeError, PermissionError) as perm_err:
        logging.exception(perm_err)
        return "Error"


def load_config(stream) -> Any:
    return load(stream, Loader=Loader)


if __name__ == "__main__":
    st.title("TCP Port scanner")
    st.markdown(textwrap.dedent("""
    Simple TCP/ IP port scanner.
"""))

    st.file_uploader(
        "Please provide the configuration file to load",
        accept_multiple_files=False,
        key="portscan_config"
    )
    if st.session_state['portscan_config']:
        yaml = load_config(st.session_state['portscan_config'])
        hosts_details = yaml['hosts']
        chunks = len(hosts_details)
        try:
            data_load_state = st.text('Preparing to scan...')
            with st.spinner(f"Total hosts to scan: {chunks}"):
                ip = None
                for host in hosts_details:
                    host_name = host['name'].strip()
                    ports = host['ports']
                    try:
                        ip = socket.gethostbyname(host_name)
                        for port in ports:
                            status = check_tcp_port_xmas(dst_ip=ip, dst_port=port)
                            data_load_state.text(f"Processing: {host_name}({ip}):{port}, status={status}")
                            if status == "Open":
                                st.info(f"{host_name}:{port}, status={status}")
                            elif status == "Closed":
                                st.warning(f"{host_name}:{port}, status={status}")
                            else:
                                st.error(f"{host_name}:{port}, status={status}")
                    except TypeError as os_err:
                        raise
            data_load_state.success(f"Finished scanning {chunks} hosts")
        except (KeyError, ValueError, OSError, TypeError) as err:
            st.error(hosts_details)
            st.exception(err)
    else:
        st.warning("Please load a PortTester configuration file to proceed")
This Python script requires some additional dependencies as listed in requirements.txt:
streamlit==1.20.0
pyyaml==6.0
pandas
Install the dependencies using pip:
$ pip3 install -r requirements.txt
Now run the script:
$ streamlit run porttester/port_tester.py
You will see something similar to this:
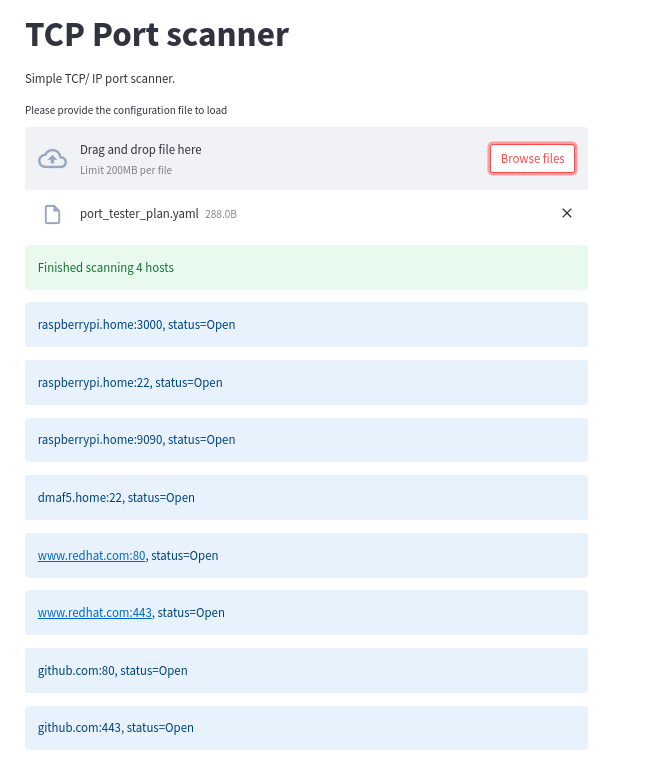
Wrap up
Streamlit is well tuned for data-science applications, but you can also use it for infrastructure monitoring. You can also create live reports to quickly check the health of your sites, with very little coding. Here's a summary:
- Grafana or InfluxDB may be better suited for infrastructure monitoring, but it doesn't mean Streamlit cannot tap the same data sources. Running on top of Python makes this possible.
- Programmatic page refresh is marked as experimental at this moment. You can see the original discussion of the feature on the GitHub issues page.
- Finally, you can see another take on the Prometheus + Pandas combo in Analysing Prometheus metrics in Pandas.
[ Want to test your sysadmin skills? Take a skills assessment today. ]
About the author
Proud dad and husband, software developer and sysadmin. Recreational runner and geek.
More like this
Red Hat Ansible All-Stars: Driving the future of network and infrastructure automation
Achieve high scalability using Red Hat Satellite Capsule Server
Untangling Networks | Compiler
Operating System Management | Compiler
Browse by channel

Automation
The latest on IT automation for tech, teams, and environments

Artificial intelligence
Updates on the platforms that free customers to run AI workloads anywhere

Open hybrid cloud
Explore how we build a more flexible future with hybrid cloud

Security
The latest on how we reduce risks across environments and technologies

Edge computing
Updates on the platforms that simplify operations at the edge

Infrastructure
The latest on the world’s leading enterprise Linux platform

Applications
Inside our solutions to the toughest application challenges
Virtualization
The future of enterprise virtualization for your workloads on-premise or across clouds