
Previously, I introduced Fedora Test Days and demonstrated how you can help test the latest Linux kernel. I used an automated test suite, which had a limited set of tests to verify the reliability of the Fedora kernel. Doing a more in-depth Linux system test requires a much more comprehensive suite of tests to cover the breadth of the various Linux subsystems.
For this, you can use the Linux Test Project (LTP). In the project's own words, LTP's mission is "Testing Linux, one syscall at a time."
[ Test your sysadmin skills. Take a skills assessment today. ]
LTP is developed and maintained by various organizations, and its goal is to provide a test suite that can validate the reliability, robustness, and stability of Linux. It is an open source automated test suite containing various tools.
For this article, I'm using a physical server running Fedora 36:
$ cat /etc/fedora-release
Fedora release 36 (Thirty Six)

$ uname -a
Linux testhost.com 5.19.8-200.fc36.x86_64 #1 SMP PREEMPT_DYNAMIC Thu Sep 8 19:02:21 UTC 2022 x86_64 x86_64 x86_64 GNU/Linux
To install and use LTP, you need standard Linux tools, including Git, gcc, Python, and Make, available on the system. You also need the automake RPM installed on your system to compile the LTP test suite successfully:
$ rpm -qa | grep -i automake
automake-1.16.5-7.fc36.noarch
[ Keep your most commonly used commands handy with the Linux commands cheat sheet. ]
Install LTP
To install LTP, clone the LTP Git repo:
$ git clone https://github.com/linux-test-project/ltp.git
$ cd ltp/
Once you've cloned it, move into the source directory and run the various make commands to compile the project. This step might take a few minutes because the repository consists of several tools written in C that are needed when the automated test suite runs.
$ make autotools

$ ./configure

$ make

$ make install
Once the make command runs successfully, the test suite moves to the directory /opt/ltp. This directory contains all the test binaries and a runner script named runltp that starts the LTP test suite.
$ ls /opt/ltp/
bin  IDcheck.sh  metadata  runltp  runtest  scenario_groups  share  testcases  testscripts  ver_linux  Version
If you wish to see what tests were compiled, look at the /opt/ltp/testcases/bin/ directory.
Run the test suite
Now that you have LTP installed, you can start running tests. The runltp shell script acts as an entry point to running the test suite:
$ ls -l /opt/ltp/runltp
-rwxr-xr-x. 1 root root 36557 Sep 16 18:54 /opt/ltp/runltp

$ file /opt/ltp/runltp
/opt/ltp/runltp: POSIX shell script, ASCII text executable
Running the runltp wrapper shell script displays some logs on the screen and starts executing the set of tests. Look at the initial message for a list of the tests it runs by default:
$ /opt/ltp/runltp
INFO: creating /opt/ltp/output directory
INFO: creating /opt/ltp/results directory
INFO: no command files were provided. Executing following runtest scenario files:
syscalls fs fs_perms_simple fsx dio io mm ipc irq sched math nptl pty containers fs_bind controllers filecaps cap_bounds fcntl-locktests connectors power_management_tests hugetlb commands hyperthreading can cpuhotplug net.ipv6_lib input cve crypto kernel_misc uevent watchqueue
You'll see the command run by the runltp shell script in the output. It also mentions a set of log files where LTP will write the test logs (more on this below):
COMMAND:	/opt/ltp/bin/ltp-pan   -e -S   -a 65457 	-n 65457 -p -f /tmp/ltp-fDmoZVhRub/alltests -l /opt/ltp/results/LTP_RUN_ON-2022_09_16-19h_00m_26s.log  -C /opt/ltp/output/LTP_RUN_ON-2022_09_16-19h_00m_26s.failed -T /opt/ltp/output/LTP_RUN_ON-2022_09_16-19h_00m_26s.tconf
LOG File: /opt/ltp/results/LTP_RUN_ON-2022_09_16-19h_00m_26s.log
FAILED COMMAND File: /opt/ltp/output/LTP_RUN_ON-2022_09_16-19h_00m_26s.failed
TCONF COMMAND File: /opt/ltp/output/LTP_RUN_ON-2022_09_16-19h_00m_26s.tconf
[ Get a cheat sheet of Linux utilities and commands for managing servers and networks. ]
The ltp-pan executable, with appropriate options, is one of the commands that ltprun invokes.
$ file /opt/ltp/bin/ltp-pan
/opt/ltp/bin/ltp-pan: ELF 64-bit LSB executable, x86-64, version 1 (SYSV), dynamically linked, interpreter /lib64/ld-linux-x86-64.so.2, BuildID[sha1]=b5c2f6e620a58776f2a3858953e1dc74a38bf1f9, for GNU/Linux 3.2.0, with debug_info, not stripped
Next, the output shows logs for the tests being run, one at a time. Here's the abort01 test log, along with the command being run, the source C file from which the test is derived, a summary of how the test performed, and whether it passed or failed:
Running tests.......
<<<test_start>>>
tag=abort01 stime=1663335027
cmdline="abort01"
contacts=""
analysis=exit
<<<test_output>>>
tst_test.c:1526: TINFO: Timeout per run is 0h 00m 30s
abort01.c:62: TPASS: abort() dumped core
abort01.c:65: TPASS: abort() raised SIGIOT

Summary:
passed   2
failed   0
broken   0
skipped  0
warnings 0
See what tests LTP runs in the background
To see what tests are running in the background, take note of your shell's process ID (PID) before running the runltp script:
$ echo $$
2321
Then execute the pstree command:
$ pstree -pa 2321
sshd,2321
  └─bash,2322
  	└─bash,2348
      	└─runltp,65457 /opt/ltp/runltp
          	└─ltp-pan,65625 -e -S -a 65457 -n 65457 -p -f /tmp/ltp-fDmoZVhRub/alltests -l...
              	└─fallocate06,80752
                  	└─fallocate06,80794
This example shows all the processes spawned by runltp. You can run the pstree command within watch -n1 to keep updating the screen as you execute new tests.
[ Get the Linux watch command cheat sheet. ]
View the test results
LTP stores test results in the /opt/ltp/results/ directory. The test log file is named for the date and time the test suite ran, allowing you to see specific logs even when you've run LTP multiple times.
While running the test suite, you can use tail -f on the log file to track LTP's progress:
$ ls -ld /opt/ltp/results/
drwxr-xr-x. 1 root root 74 Sep 16 19:00 /opt/ltp/results/

$ tail -f /opt/ltp/results/LTP_RUN_ON-2022_09_17-17h-10m_26s.log
chroot01                                       	PASS   	0
chroot02                                       	PASS   	0
chroot03                                       	PASS   	0
chroot04                                       	PASS   	0
clock_adjtime01                                	PASS   	0
clock_adjtime02                                	PASS   	0
clock_getres01                                 	PASS   	0
clock_nanosleep01                              	PASS   	0
[...]
Once the LTP test run completes, you can see the final results in the same log file. It shows the total number of tests that ran, how many tests were skipped, failures, and so on. These results are your starting point to see why a test failed and identify the cause of failure.
$ tail -f /opt/ltp/results/LTP_RUN_ON-2022_09_17-10h_55m_36s.log
perf_event_open03                              	CONF   	32

-----------------------------------------------
Total Tests: 1379
Total Skipped Tests: 173
Total Failures: 3
Kernel Version: 5.19.8-200.fc36.x86_64
Machine Architecture: x86_64
Hostname: testhost.com
Run a single test
LTP has a variety of tests and often takes a long time to complete. If you're interested in running just a single test, move to the testcases/bin directory and search for the test you want to run. For example, here's how to find and run the fork() tests:
$ pwd
/opt/ltp/testcases/bin

$ ls | grep -i ^fork | xargs
fork01 fork02 fork03 fork04 fork05 fork06 fork07 fork08 fork09 fork10 fork11 fork12 fork13 fork14 fork_exec_loop fork_freeze.sh

$ ./fork01
fork01  	1  TPASS  :  fork() returned 1117799
fork01  	2  TPASS  :  child pid and fork() return agree: 1117799

$ ./fork02
fork02  	0  TINFO  :  Inside parent
fork02  	0  TINFO  :  Inside child
fork02  	0  TINFO  :  exit status of wait 0
fork02  	1  TPASS  :  test 1 PASSED
Run a specific test matching a pattern
To run tests matching a specific pattern, use -s followed by the test-name pattern of the tests you're interested in. For example, if you wish to execute only write-related test cases:
$ /opt/ltp/runltp -s write
Randomize test order
LTP tests normally run in alphabetical order. Use the -R flag to run tests in random order. In this sample output, notice that the tests aren't in any particular order:
$ /opt/ltp/runltp -R

$ tail -f LTP_RUN_ON-2022_09_17-20h_15m_43s.log
Test Start Time: Sat Sep 17 20:15:44 2022
-----------------------------------------
Testcase                                       	Result 	Exit Value
--------                                       	------ 	----------
execve02                                       	PASS   	0
fs_bind_move10_sh                              	PASS   	0
kill09                                         	PASS   	0
dio04                                          	CONF   	32
msync02                                        	PASS   	0
read01                                         	PASS   	0
^C
Run networking tests
If you wish to run only network-related tests and skip the rest, use the -N flag.
$ /opt/ltp/runltp -N
Run under additional background CPU load
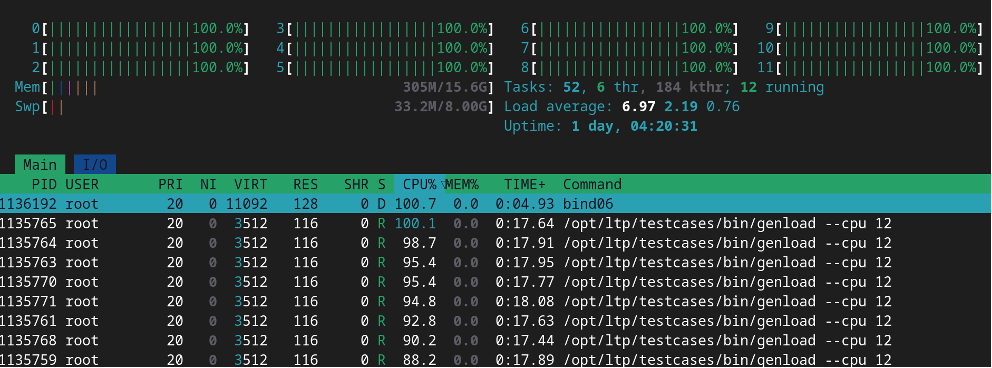
A system often behaves differently under heavy load than when idle. It might make sense to simulate a workload before running tests. In the example below, you can see that I've used the -c option followed by the CPU count on my system (12). LTP runs multiple CPU loads on the system based on the -c option and then starts running the tests under that workload:
$ lscpu  | grep '^CPU(s)'
CPU(s): 12

$ /opt/ltp/runltp -c 12
Run multiple instances of the test suite
You can run multiple instances of the same LTP test suite in parallel with the -x option:
$ /opt/ltp/runltp -x 5
Send logs to a separate file
LTP allows you to send logs to a different file (rather than the default one) using the -l flag:
$ /opt/ltp/runltp -l /tmp/ltp.log

$ tail -f /tmp/ltp.log
tag=alarm02 stime=1663426546 dur=0 exit=exited stat=0 core=no cu=0 cs=0
tag=alarm03 stime=1663426546 dur=0 exit=exited stat=0 core=no cu=0 cs=1
tag=alarm05 stime=1663426546 dur=2 exit=exited stat=0 core=no cu=0 cs=0
tag=alarm06 stime=1663426548 dur=3 exit=exited stat=0 core=no cu=0 cs=0
tag=alarm07 stime=1663426551 dur=3 exit=exited stat=0 core=no cu=0 cs=0
tag=bind01 stime=1663426554 dur=0 exit=exited stat=0 core=no cu=0 cs=1
tag=bind02 stime=1663426554 dur=0 exit=exited stat=0 core=no cu=0 cs=0
tag=bind03 stime=1663426554 dur=0 exit=exited stat=0 core=no cu=1 cs=0
tag=bind04 stime=1663426554 dur=0 exit=exited stat=0 core=no cu=0 cs=0
tag=bind05 stime=1663426554 dur=0 exit=exited stat=0 core=no cu=0 cs=1
^C
Check what the tests do
So far, I have focused on running tests and checking logs to identify whether the test passed or failed. But what happens when you need to know the steps the test case takes?
For this, you must open the C source code of the test you want to explore more. To do so, move to the testcases directory within the cloned Git repository and open the source file. For example, this is the fork01.c test case code:
$ pwd
/root/ltp/testcases/kernel/syscalls/fork

$ cat fork01.c

Description of the test

 *	OS Test - Silicon Graphics, Inc.
 *	TEST IDENTIFIER    : fork01
 *	EXECUTED BY    : anyone
 *	TEST TITLE    : Basic test for fork(2)
 *	PARENT DOCUMENT    : frktds02
 *	TEST CASE TOTAL    : 2
[...]
 *	TEST CASES
 *    1.) fork returns without error
 *    2.) fork returns the pid of the child
[...]
The Description of the test comment in the source code provides details about what the test case is doing. Although such comments might not be available for all tests, they are a good starting point. A basic knowledge of C programs and shell scripts is sufficient for understanding most test cases.
Test Linux
LTP is a good way to explore Linux internals and understand how programs are written to test a Linux system. LTP is open source, and you're free to add new test cases or improve existing ones as you see fit. Avoid running the test suite on a production system, as you might run into some failures that could adversely affect the system. To start, I recommend running this test suite on a test virtual machine to get familiar with the tests and what happens in the background.
About the author
Seasoned Software and Security Engineering professional.
Primary interests are AI/ML, Security, Linux, Malware.
Loves working on the command-line.
More like this
Planning your path forward from Amazon Linux 2: Why consistency is the ultimate upgrade
Build security into ITOps from the start with automation
Operating System Management | Compiler
Technically Speaking | Taming AI agents with observability
Browse by channel

Automation
The latest on IT automation for tech, teams, and environments

Artificial intelligence
Updates on the platforms that free customers to run AI workloads anywhere

Open hybrid cloud
Explore how we build a more flexible future with hybrid cloud

Security
The latest on how we reduce risks across environments and technologies

Edge computing
Updates on the platforms that simplify operations at the edge

Infrastructure
The latest on the world’s leading enterprise Linux platform

Applications
Inside our solutions to the toughest application challenges
Virtualization
The future of enterprise virtualization for your workloads on-premise or across clouds