
Today, most organizations rely on vast computer systems, and maintaining accurate time in those computer systems has always been a challenge for administrators. That task became easier with the introduction of the Network Time Protocol (NTP) in the early 1980s. However, NTP also introduced the need to monitor your computer systems to ensure the time is correct and there aren't many corrections or time drift occurrences.
While monitoring and maintaining the time on OpenShift nodes, OpenShift administrators might receive the dreaded NodeClockNotSynchronising alert from Prometheus. If you navigate to the Observe/Monitor tab in the OpenShift Web Console, you see numerous dashboards that display useful information. The Node Exporter/USE Method/Node dashboard is the best dashboard for monitoring your nodes. It provides CPU, memory, network utilization, and other helpful metrics. It does not, however, include any metrics for time.
So the question is: How do you monitor time on an OpenShift node? There are several options, including:
- Accessing the node manually and running commands
- Running queries in Prometheus to view collected metrics from the timex collector from the node_exporter running on each node
- Setting up a custom Grafana instance and dashboard to utilize the Node Exporter Full dashboard to review the same timex metrics
I'll cover each option in more detail below.
Verify time manually on OpenShift nodes
Typically when there is a time issue, it affects the entire cluster because all nodes synchronize with the same time source. However, there are instances where only one or a few nodes in the cluster have time issues. When this situation occurs, it's easier to access the node directly and diagnose the problem.
To complete this task, use the oc debug node command to launch a debug pod on the affected node and then check the status of the time-keeping daemon to see whether it is running. If the service is running, the next step is to check the sources and tracking information:
$ oc debug node/openshift-sxqnd-master2
Starting pod/openshift-sxqnd-master2-debug ...
To use host binaries, run `chroot /host`

Pod IP: 192.168.50.62
If you don't see a command prompt, try pressing enter.
sh# chroot /host binbash
[root@openshift-sxqnd..]#
Once in the chroot environment, check the status of the time-keeping daemon to determine if it is connecting to the upstream NTP servers and if the time-keeping daemon is in sync with those servers. To complete these tasks, run the following commands:
chronyc sources: Lists all sources the chronyd service utilizes based on the configuration of thechrony.conffilechronyc sourcestats: Displays information about the drift rate and offset estimation for each source currently usingchronycchronyc tracking: Provides detailed information about the system's clock performance
Refer to the chronyc documentation for more details about the information displayed from each command.
[root@openshift-sxq...]# chronyc sources
210 Number of sources = 1
MS Name/IP    Stratum  Poll  Reach  LastRx  Last sample
===========================================================
^*192.168.50.13     4     7    377     85   +642ns[ +525...
[root@openshift-sxq...]# chronyc sourcestats
Name/IP       NP NR Span Freq  Freq Skew  Offset  Std Dev
=========================================================
192.168.50.13  6  4  324  +0.478  4.675   +1399ns   131us
[root@openshift-sxq...]# chronyc tracking
Reference ID  : C0A832OD (192.168.50.13)
Stratum       : 5
Ref time (UTC): Thu Apr 28 21:12:01 2022
[...]
Use OpenShift's metrics to monitor time drift on each OpenShift node
The Prometheus exporter (also known as the Node Exporter) runs on each OpenShift node as part of a daemonset in the openshift-monitoring namespace. One of the collectors node_exporter utilizes is the timex collector. The timex collector exports the state of the kernel synchronization flag that is maintained by the time-keeping daemon. OpenShift provides the ability to query Prometheus from the web console. You can display these metrics to monitor time drift on each OpenShift node.
[ For more on Grafana, Prometheus, and other monitoring tools, read 3 types of monitoring and some open source tools to get started. ]
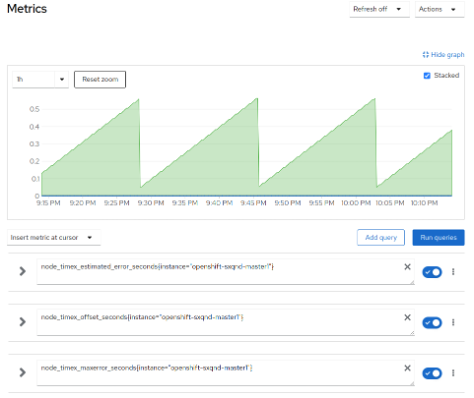
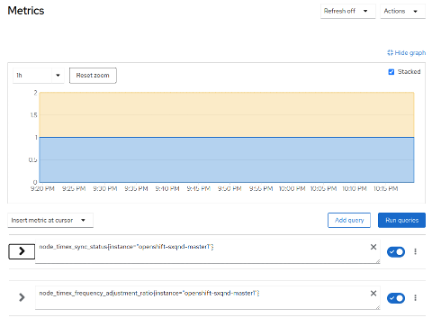
For time synchronization drift and corrections, query the following metrics:
node_timex_estimated_error_seconds: Estimated error in secondsnode_timex_offset_seconds: Time offset between the local system clock and reference clocknode_timex_maxerror_seconds: The maximum error in secondsnode_timex_sync_status: Determines if the clock is synced to a reliable NTP servernode_timex_frequency_adjustment_ratio: Frequency of adjustment of the local clock
In the following examples, focus on a specific instance by adding {instance=" <openshift_node_name>"} after the metric you want to query.
Use custom Grafana dashboards to monitor time drift on each OpenShift node
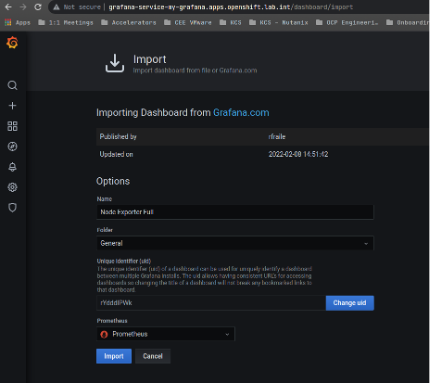
If you would like a display with prebuilt graphs to monitor time drift and corrections for your entire cluster, you can use a custom Grafana dashboard. If you do not already have the Grafana Community Operator installed and configured, follow the steps in Custom Grafana dashboards for Red Hat OpenShift Container Platform 4.
[ Ready to get started with OpenShift? Get O'Reilly's OpenShift for Developers eBook. ]
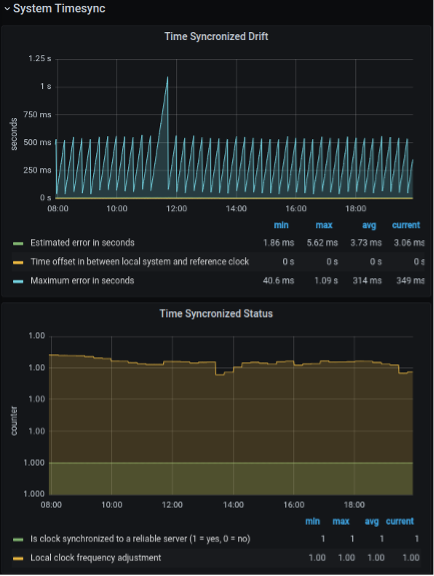
Once you have a custom Grafana dashboard configured, import the Node Exporter Full dashboard to view the graphs for the system timesync.
Now that you have imported the Node Exporter Full Dashboard, you can monitor the Time Synchronized Drift and Time Synchronized Status statistics. Time Synchronized Drift can help quickly determine the difference in time between the node and the reference NTP server. It also provides the maximum error in seconds, which is useful in seeing how far off the node has been. Time Synchronized Drift also shows if the node is synchronized to a reliable server.
Wrap up
These are three different ways an OpenShift administrator can check the time synchronization on an OpenShift node. The first two options, manually verifying the time on the node and querying the built-in metrics for the node_exporter timex collection statistics, are quick and easy steps when there's a need to troubleshoot a single node or a few nodes with a time synchronization issue. The last option, setting up a custom Grafana dashboard, provides a nice graph that is readily available to check if a time synchronization issue occurs.
About the author
Morgan Peterman is a Senior Partner Technical Account Manager for Red Hat OpenShift. He is a Red Hat Certified Engineer (RHCE) and a Red Hat Certified Specialist in OpenShift. Before joining Red Hat, Morgan spent 15 years as a Linux Engineer and Systems Administrator, deploying a wide variety of technologies and delivering cost-cutting IT solutions within the healthcare and travel industries.
More like this
Red Hat Ansible All-Stars: Driving the future of network and infrastructure automation
Achieve high scalability using Red Hat Satellite Capsule Server
Untangling Networks | Compiler
Operating System Management | Compiler
Browse by channel

Automation
The latest on IT automation for tech, teams, and environments

Artificial intelligence
Updates on the platforms that free customers to run AI workloads anywhere

Open hybrid cloud
Explore how we build a more flexible future with hybrid cloud

Security
The latest on how we reduce risks across environments and technologies

Edge computing
Updates on the platforms that simplify operations at the edge

Infrastructure
The latest on the world’s leading enterprise Linux platform

Applications
Inside our solutions to the toughest application challenges
Virtualization
The future of enterprise virtualization for your workloads on-premise or across clouds