In this post:
-
How to use Red Hat Virtualization dashboards.
-
Explanation of default dashboards.
-
How to create custom dashboards from the built-in options that come with Red Hat Virtualization.
In this post we'll explore how to monitor a Red Hat Virtualization environment so you can visualize performance, resources and trends.
As an administrator, it can be difficult to get the right level of visibility across your infrastructure. With the Red Hat Virtualization monitoring portal and Grafana dashboards, you can see resources that are about to run out and catch problems early, see underutilized resources to ensure they are used efficiently, and view trends over time to see the big picture. Your infrastructure activity can be seen from a minute back to five years of history.

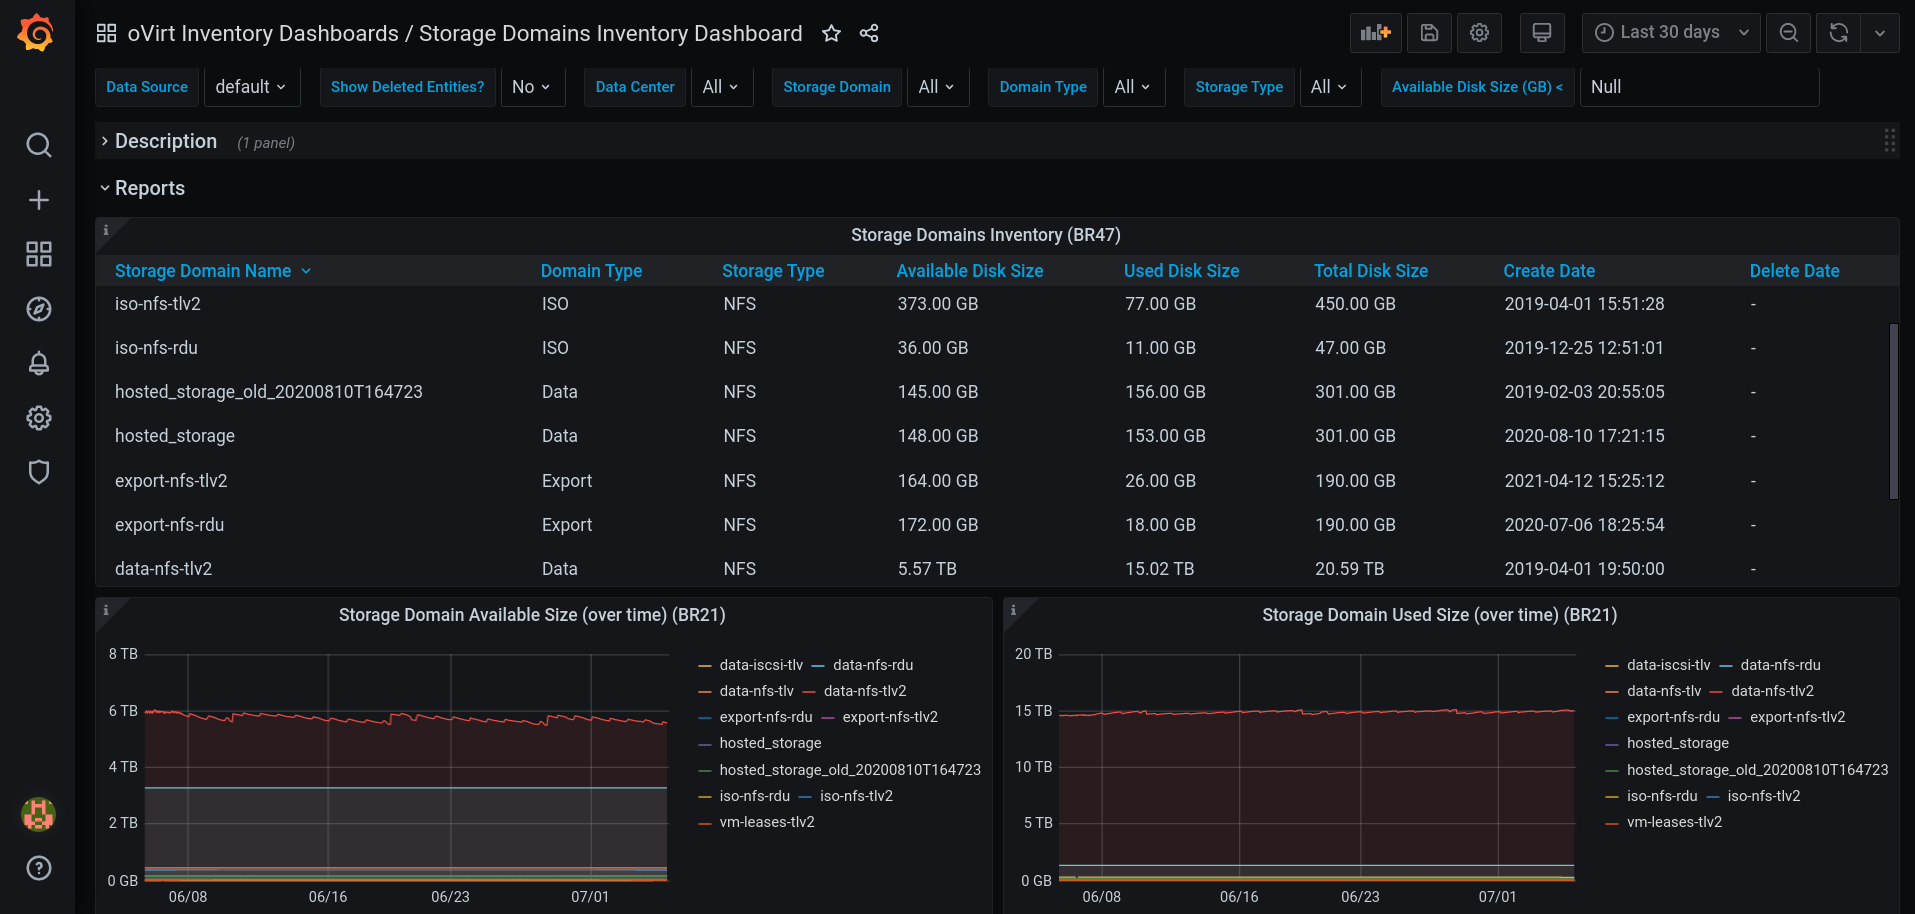
The “Storage Domains Inventory” Pre-Built Dashboard.
Grafana integration is usually configured by default, from Red Hat Virtualization 4.4.8 and above. If it's not, you can follow these steps to configure Grafana manually:
1. Put the environment in global maintenance mode:
# hosted-engine --set-maintenance --mode=global
2. Log in to the machine where you want to install Grafana.
3. Run the engine-setup command as follows:
# engine-setup --reconfigure-optional-components
4. Answer Yes to install Grafana on this machine:
Configure Grafana on this host (Yes, No) [Yes]:
5. Disable global maintenance mode:
# hosted-engine --set-maintenance --mode=none
6. To access the Grafana dashboards:
Go to https://<engine FQDN or IP address>/ovirt-engine-grafana, or Click Monitoring Portal in the web administration welcome page for the Administration Portal.
For additional information, see Configuring Grafana on the Red Hat Customer Portal. From version 4.4.8, only if upgrading from 4.3 to 4.4.8 and above Grafana will not be configured by default if the data warehouse is on a remote machine or if you are restoring from backup.
The Red Hat Virtualization monitoring portal includes a number of built-in Grafana dashboards for visualizing the datacenter, cluster, host, and virtual machine data:
-
Executive dashboards: display the user console connection activity, operating system count for hosts, and active virtual machines.
-
Trend dashboards: display trends in virtual machines, CPU, memory, network, interface, transmit and receive, disks, read and write activity.
-
Service Level dashboards: display uptime, downtime, quality of service, and intervals for important thresholds (CPU, memory).
-
Inventory dashboards: displays an inventory list of hosts in a cluster, disk usage in a storage domain, virtual machines in a cluster, and resources overcommit rates per data center.
Let's look at a few examples!
The “Inventory Dashboard” shows for each data center the usage and overcommit rates for CPU, memory and disk size.
In addition, the user can press on the data center name and it will lead to the “Data Center Dashboard”, which shows detailed information about the data center.
With this information it will be easier to identify and balance the resources between data centers.

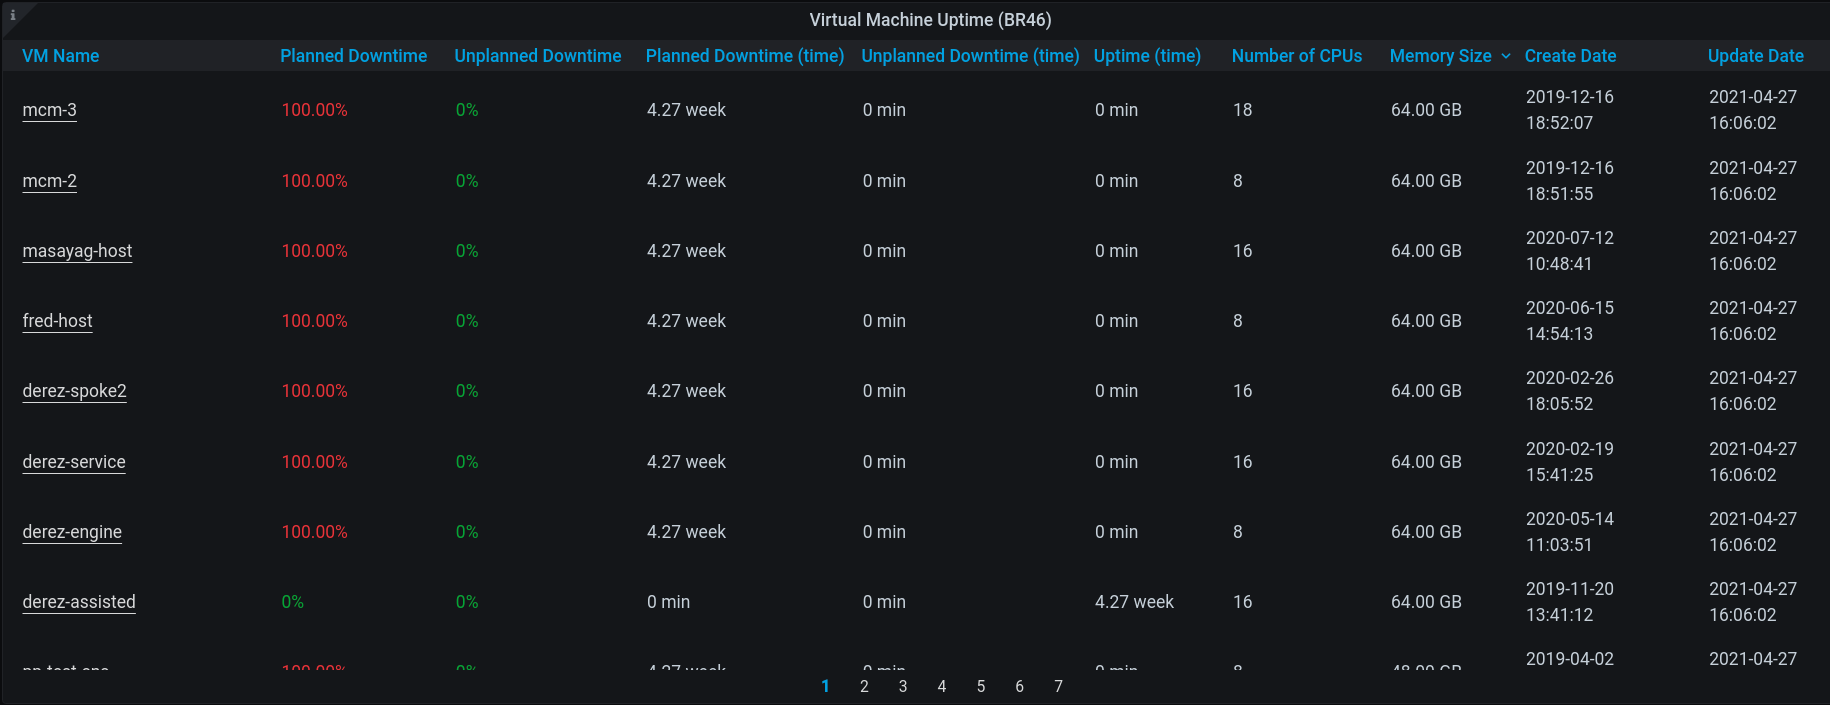
The “Virtual Machines Uptime Dashboard” shows for each virtual machine the planned and unplanned downtime over the selected period.
In addition, the user can click on the virtual machine name and it will lead to the “Virtual Machine Dashboard,” which shows detailed information about the virtual machine.
With this information it will be easier to identify unused virtual machines, the size of their resources, their users and more.
Full dashboards descriptions can be found in the Administration Guide: Built-in Grafana dashboards.
We allow the user to add data from the data warehouse or customize the pre-build dashboards as they wish, by creating custom dashboards:
-
No changes can be saved to the pre-built dashboards.
-
To add a custom dashboard duplicate the desired dashboard or create a new one.
-
The custom dashboards will be saved after upgrade.
-
For example, the user can add the disk/s size of the virtual machines to the “Virtual Machine Uptime (BR46)” panel (the second example we mentioned above), and have a better understanding which virtual machine needs to be checked first.
For information on the data available in the data warehouse see "Statistics History Views, Configuration History Views."
Want to duplicate an existing dashboard? Here's how to do it.
1. Enter the desired dashboard, and press “Dashboard Settings.”

2. On the right side menu, Press “Save As…”
 3. Enter the details, and press “Save.”

If you find the Red Hat Virtualization Monitoring portal useful, or have comments, complaints, or other feedback:
-
Open a support case on the Red Hat Customer Portal.
-
Join oVirt community and ask additional questions in oVirt users mailing list or other methods we mentioned.
For additional information:
-
Enabling Grafana integration manually: Configuring Grafana.
-
Full dashboards descriptions can be found in the Administration Guide: Built-in Grafana dashboards.
-
The data available in the data warehouse: Statistics History Views, Configuration History Views.
Über den Autor
Litman has been with Red Hat since 2020 and is currently an Associate Software Engineer.
Ähnliche Einträge
The virtualization pivot and why enterprise IT’s next move will determine the next decade
Virtualization at full speed ahead of Red Hat Summit 2026
Nach Thema durchsuchen
Automatisierung
Das Neueste zum Thema IT-Automatisierung für Technologien, Teams und Umgebungen
Künstliche Intelligenz
Erfahren Sie das Neueste von den Plattformen, die es Kunden ermöglichen, KI-Workloads beliebig auszuführen
Open Hybrid Cloud
Erfahren Sie, wie wir eine flexiblere Zukunft mit Hybrid Clouds schaffen.
Sicherheit
Erfahren Sie, wie wir Risiken in verschiedenen Umgebungen und Technologien reduzieren
Edge Computing
Erfahren Sie das Neueste von den Plattformen, die die Operations am Edge vereinfachen
Infrastruktur
Erfahren Sie das Neueste von der weltweit führenden Linux-Plattform für Unternehmen
Anwendungen
Entdecken Sie unsere Lösungen für komplexe Herausforderungen bei Anwendungen
Virtualisierung
Erfahren Sie das Neueste über die Virtualisierung von Workloads in Cloud- oder On-Premise-Umgebungen

