By now, you've probably heard that OpenTelemetry is changing the observability ecosystem. It’s exciting how a vendor-neutral solution that unburdens users from being locked into any one company's solution has charmed every large observability vendor and end-user into its ecosystem. An initiative that started as a consensus between two large observability projects has inspired, in seemingly everyone, a desire to contribute to a universal solution.
The CNCF project journey report published by the end of October 2023, summarized the OpenTelemetry project story into more than 66,000 code commits from nearly 10,000 individuals and 11,000 companies. That’s a lot of end users and companies working together. One reason for this initiative being so popular is that it provides a solution for the three (and more to come!) pillars of modern Observability: distributed tracing, metrics, and logs. It also affects everything from instrumenting code to the verge of data storage. This provides the blueprints (an API and Semantic Conventions), instructions (an SDK for many languages) and automatic instrumentation, which means no code changes are required to generate observability telemetry. Even better, all the work for user interfaces and storage gets solved elsewhere. This acknowledges that one size does not fit all, and provides enough freedom for users to build their own solutions (including storage) or to outsource it.
In our commitment to reducing vendor lock-in and providing choice, we're glad to be part of the OpenTelemetry ecosystem. That's why the Red Hat OpenShift observability team is thrilled to announce general availability (GA) of the Red Hat build of OpenTelemetry.
Beyond distributed tracing
The Red Hat OpenShift distributed tracing solution started with Jaeger, and has evolved hand in hand with the community. Since the 2.0 release, we've offered users a technology preview of the OpenTelemetry operator in the distributed tracing bundle as Red Hat OpenShift distributed tracing data collection. This component included a curated set of features dedicated to distributed tracing, and has enabled early adopters (and us) to share feedback and improve the user experience, while gaining a better understanding of OpenTelemetry.
As announced a few weeks ago in What’s new in Red Hat OpenShift Monitoring 4.14, Logging 5.8, and Distributed Tracing 2.9, we added a Prometheus exporter as a technology preview. This allows users to collect, transform, and visualize OpenTelemetry metrics in a Prometheus-based stack, together with supported platforms that accept OpenTelemetry protocol (OTLP) signals.
At the same time, the OpenTelemetry project is defining the path of standardization for Observability into the 5G Core Networks in Telecommunications and providing solutions to observe the Edge for many industry verticals.
Given that this component does not only serve distributed tracing, we've updated its name to the Red Hat build of OpenTelemetry.
The Red Hat build of OpenTelemetry Operator includes OpenTelemetry collector and, in technology preview, the Instrumentation Custom Resource (CR). To know more about how CRs help to extend the Kubernetes API, the official docs can help you.
A modular architecture for your open observability platform
The OpenTelemetry Collector consists of many components that help you receive, transform, combine and export data. These components are group under the following categories:
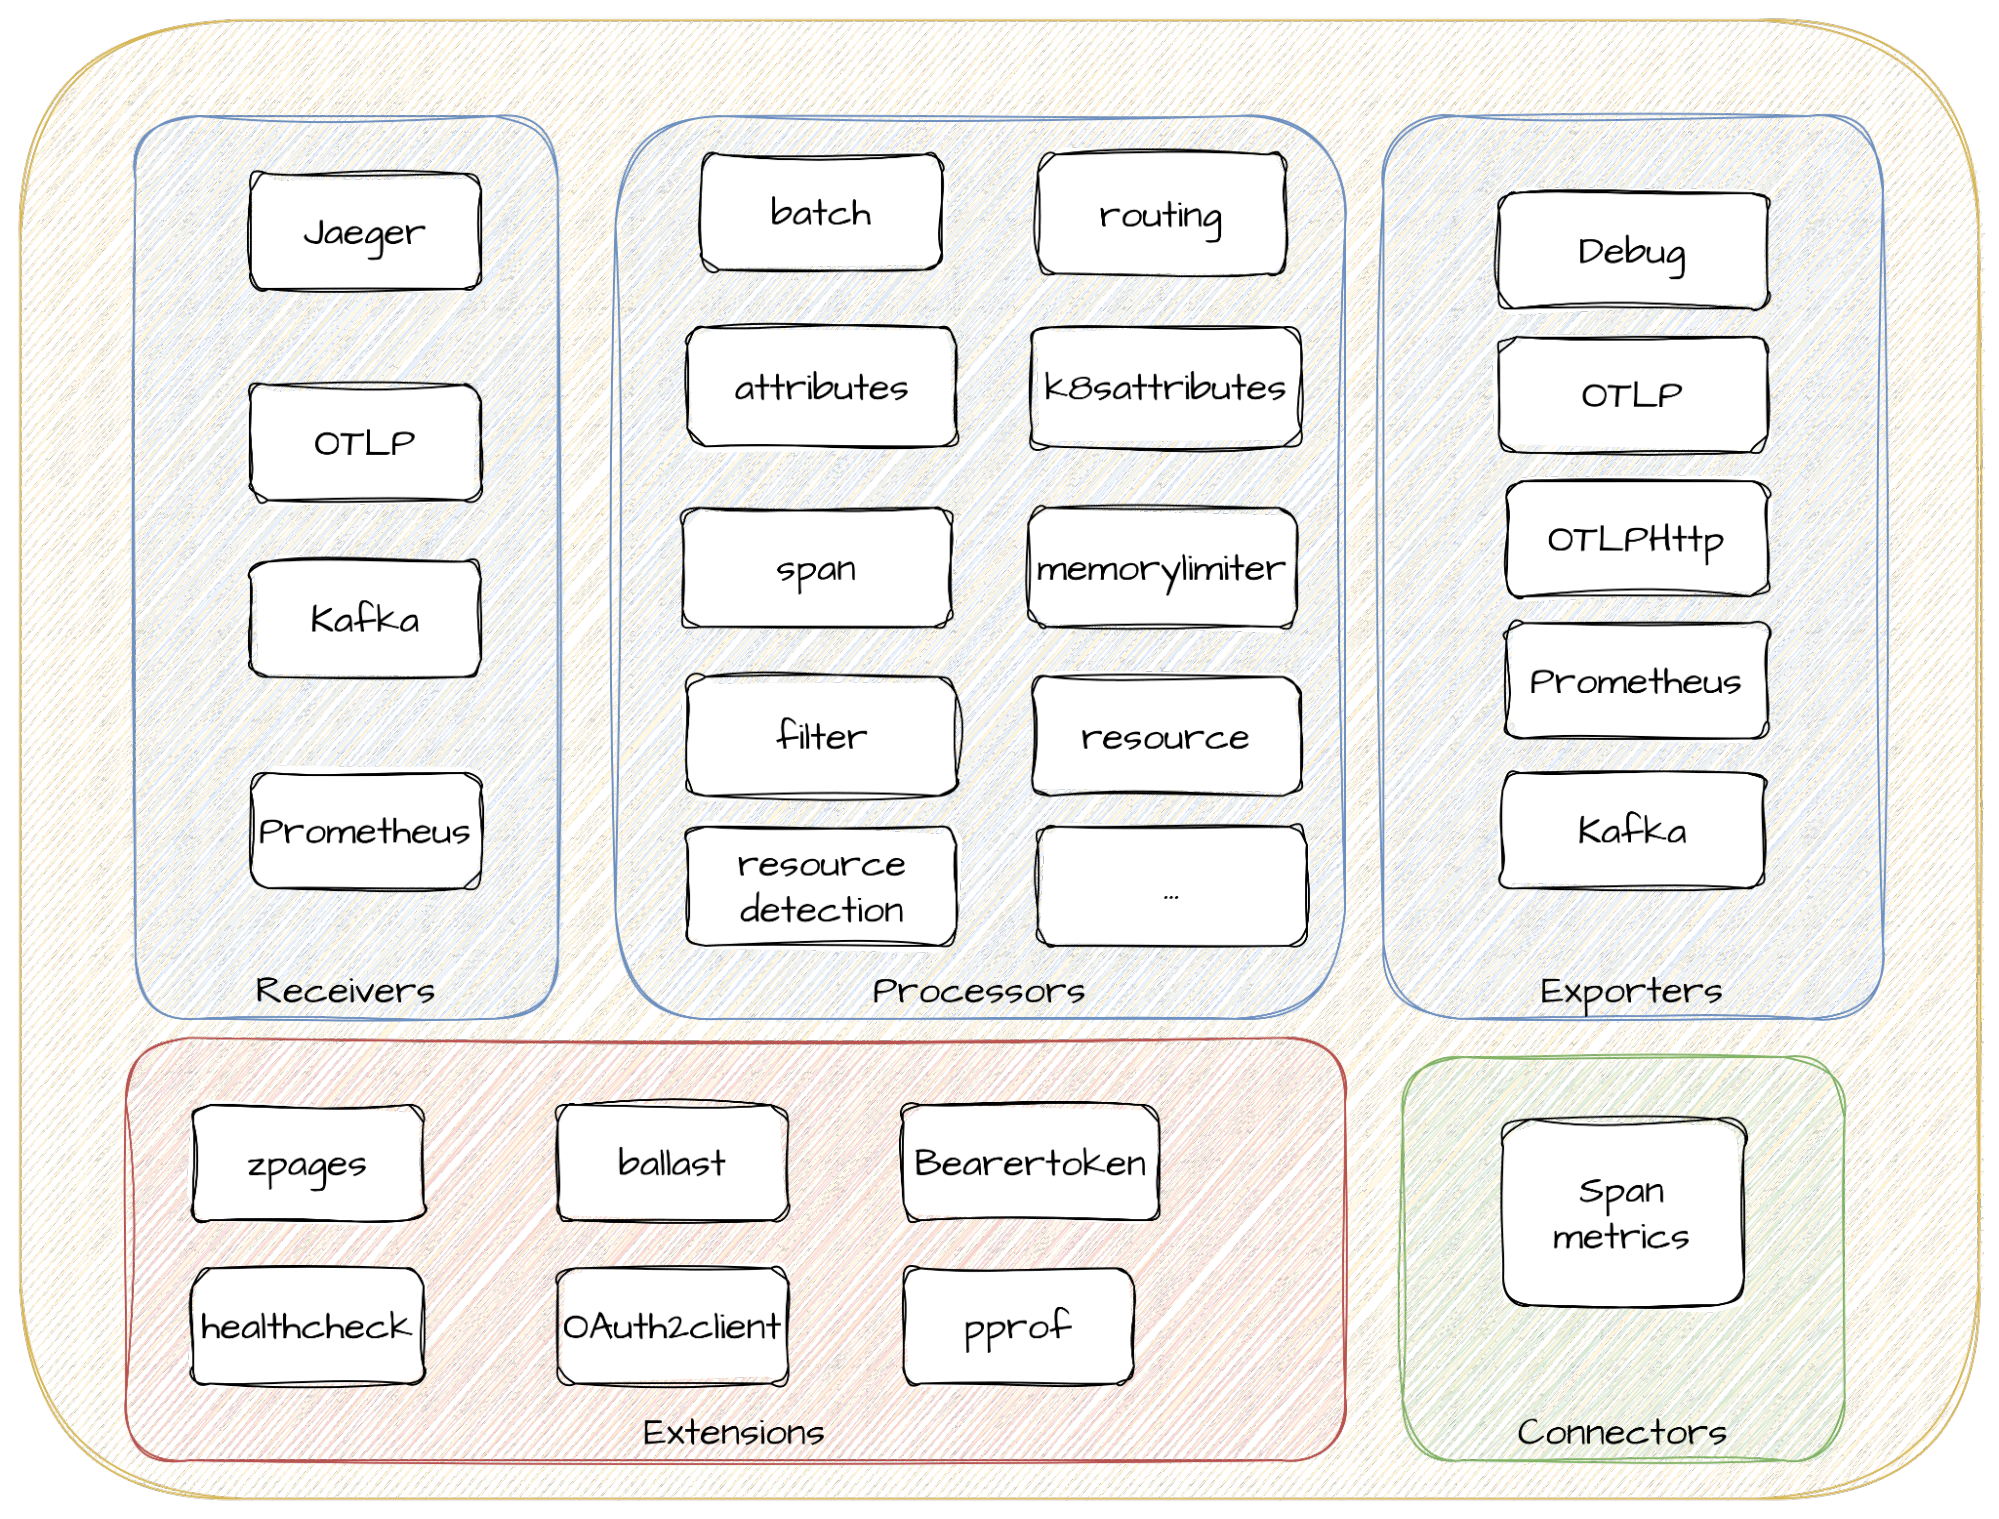
Figure 1: Red Hat build of OpenTelemetry architecture and components
- Receivers define the first step into the OpenTelemetry data path. The OpenTelemetry collector gathers signals through receivers, which can be pushed or pulled. Depending on the signal and data collection mechanism, different receivers can be defined and utilized by users. Examples of receivers are OTLP, Jaeger, Kafka, and Prometheus.
- Processors are optional components that streamline data from receivers to exporters. For each processor, you can define rules describing how you want signals to be filtered, sampled, transformed, or even dropped. We provide a set of default processors, but curious users are encouraged to keep an eye on the community recommendations and discuss them with us. If there’s something missing in our build, we're happy to be convinced to include them! Some examples include the batch, k8sattributes, filter, and span processors, which allow you to control how departures from the collector process your data and enrich your signals with Kubernetes attributes. They provide a central place to define data processing for all your observability signals.
- Exporters take your processed data and extract it for use elsewhere. As with receivers, these can follow a push or pull approach based on the signal and collection mechanism. This allows you to decide whether you want to push your Observability signals to an OTLP-compliant backend, leave your metrics to be collected by a Prometheus scraper, or leave them at the Kafka bus station to be later consumed.
- Extensions are optional components not strictly related to data processing, but to other important activities. There are extensions for healthcheck inspections, configuring memory ballast, or authorization and authentication.
All of these components (and another I’m saving for later) are defined in the collector configuration with a simple YAML file. For example:
receivers:
 otlp:
   protocols:
     grpc:
 jaeger:
processors:
 batch:
exporters:
 otlp:
   endpoint: jaeger-endpoint:4317
 prometheus:
   endpoint: 0.0.0.0:8889
   resource_to_telemetry_conversion:
     enabled: true # by default resource attributes are dropped
Defining your data path: the service definition
With so many moving parts defined, you need a way to put them together. The OpenTelemetry collector allows you to define your data pipelines using a service definition.
For example, if you want to collect Jaeger traces and export them with OTLP to a Tempo backend in batches while also receiving OTLP metrics, transforming, and finally exporting them to Prometheus, then you would define a couple of pipelines. These are the building blocks defined by the previous YAML example:
service:
 pipelines:
   traces:
     receivers: [jaeger]
     processors: [batch]
     exporters: [otlp]
   metrics:
     receivers: [otlp]
     exporters: [prometheus]
All that in one place without the need for multiple agents!
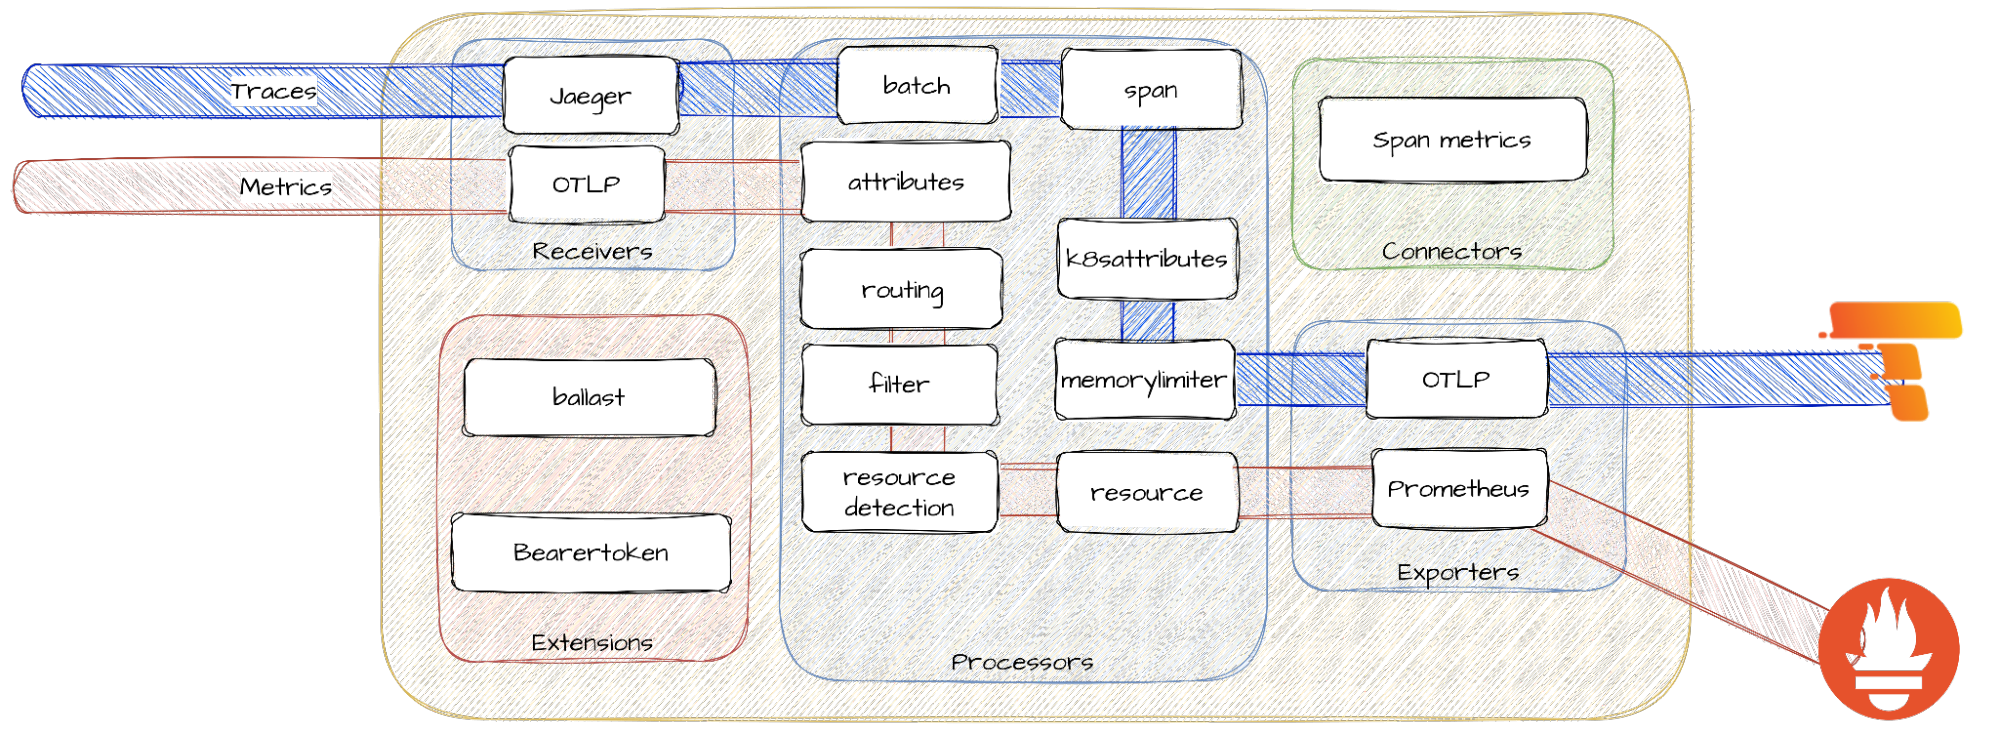
Figure 2: Different service pipelines for traces and metrics inside the OpenTelemetry collector. Processors in the service pipelines are placed as an illustrative example, perhaps not the most recommendable for a real use case!
Bringing it all together
There's one more collector component, and its job is to bring it all together.
- Connectors go beyond signal correlation, and help you define connections between pipelines. A connector acts as an exporter and receiver of new internal pipelines.
Yes, telemetry can be generated and aggregated inside the collector. This enables, for example, producing metrics from spans without the need to produce and maintain metrics in the application. It's the first step towards your own Application Performance Monitoring (APM) system. If you are not familiar with the meaning of a span, feel free to take a look at our previous blog post on distributed tracing!
Here's a simple definition to aggregate Request, Error, and Duration (RED) OpenTelemetry metrics from span data:
connectors:
 spanmetrics:
   metrics_flush_interval: 15s
service:
 pipelines:
   traces:
     exporters: [spanmetrics]
   metrics:
     receivers: [spanmetrics]
OpenTelemetry Instrumentation injection
One of the pain points for modern observability is the instrumentation of legacy and new applications. You know your code better than anyone, and it’s important to have a good instrumentation strategy. As a matter of fact, following that path is our recommendation for an efficient solution. But sometimes extra help from no-code solutions is useful. That's why the operator now enables the Instrumentation CR that allows injecting upstream OpenTelemetry auto-instrumentation libraries in technology preview.
Auto-instrumentation in OpenTelemetry refers to the capability where the framework automatically instruments an application without manual code changes. This enables developers and Operators to get observability into applications with minimal effort and changes to the existing codebase.
The Red Hat build of OpenTelemetry Operator uses a custom resource definition (CRD) file that defines the configuration of the instrumentation. Following that definition, upstream OpenTelemetry auto-instrumentation libraries are injected and configured into your workloads when the configuration applies. Currently, the project provides the injection of the upstream (unsupported but available) instrumentation libraries from Go, Java, Node.js, Python, .NET, and the Apache HTTP Server (httpd).
New features and enhancements
This exciting release comes with several other enhancements, including:
- Support for Prometheus receiver for metrics collection (Technology Preview). This component allows you to scrape Prometheus metrics and export them to the backend of your choice.
- Support for Kafka receiver and exporter for collecting and sending traces and metrics to Apache Kafka (technology preview).
- Support for cluster-wide proxy environments.
- The Red Hat build of OpenTelemetry Operator now creates Prometheus ServiceMonitor custom resource when the Prometheus exporter is enabled. This enhances the end-user experience by clearing the path for seamless Prometheus integration.
- Builds for ARM architecture.
- Fixed support for disconnected environments using oc adm catalog mirror.
Refer to the official release notes for more information.
What’s next?
With such a vast community and ecosystem at our disposal, it’s important to understand that not all the components of the landscape are included in the Red Hat build of OpenTelemetry as of today. Read the docs to understand which components are provided and their support statements, but we want to hear your feedback about the existing and future components of the build regardless of support status. We're committed to provide the best enterprise-ready experience that helps our users avoid vendor lock-in. By continuing the use of this formula, we can co-create a great open observability platform without straying from the high standards we hold ourselves to.
Further reading
- Release notes for Red Hat build of OpenTelemetry
- Release notes for Red Hat OpenShift distributed tracing platform 3.0
- http://redhat.com/observability
- What is Observability?
- Observability across OpenShift cluster boundaries with Distributed Data Collection
- What is OpenTelemetry?
- The Path to Distributed Tracing: an OpenShift Observability Adventure
- Using OpenTelemetry and Jaeger with Your Own Services/Application
- Episode XVIII 5G Open Telemetry (OTel) | by Fatih Nar | Open 5G HyperCore | Nov, 2023 | Medium
- Unlocking the potential of edge computing: Mastering observability at scale
- Using OpenTelemetry on Kubernetes | DevNation Tech Talk
- Dev Nation talk: Distributed tracing with Grafana Tempo and OpenTelemetry automatic instrumentation
- What’s new in Red Hat OpenShift Monitoring 4.14, Logging 5.8, and Distributed Tracing 2.9?
About the author

Jose is a Senior Product Manager at Red Hat OpenShift, with a focus on Observability and Sustainability. His work is deeply related to manage the OpenTelemetry, distributed tracing and power monitoring products in Red Hat OpenShift.
His expertise has been built from previous gigs as a Software Architect, Tech Lead and Product Owner in the telecommunications industry, all the way from the software programming trenches where agile ways of working, a sound CI platform, best testing practices with observability at the center have presented themselves as the main principles that drive every modern successful project.
With a heavy scientific background on physics and a PhD in Computational Materials Engineering, curiousity, openness and a pragmatic view are always expected. Beyond the boardroom, he is a C++ enthusiast and a creative force, contributing symphonic and electronic touches as a keyboardist in metal bands, when he is not playing videogames or lowering lap times at his simracing cockpit.
More like this
How does real-world AI deliver value? The Ask Red Hat example
Optimizing cluster observability: A strategic approach to selective log routing in Red Hat OpenShift
Open source for climate finance | Technically Speaking
Datacenters And Sustainability | Compiler
Browse by channel

Automation
The latest on IT automation for tech, teams, and environments

Artificial intelligence
Updates on the platforms that free customers to run AI workloads anywhere

Open hybrid cloud
Explore how we build a more flexible future with hybrid cloud

Security
The latest on how we reduce risks across environments and technologies

Edge computing
Updates on the platforms that simplify operations at the edge

Infrastructure
The latest on the world’s leading enterprise Linux platform

Applications
Inside our solutions to the toughest application challenges
Virtualization
The future of enterprise virtualization for your workloads on-premise or across clouds