For a few years now, Red Hat has partnered with an ever-growing number of Independent Software Vendors (ISVs) to bring an expanded catalog of operator and helm-driven product offerings to OpenShift. As part of a new blog series highlighting these partner products, this post covers using Dynatrace Operator for App Observability on OpenShift.
This article uses a simple Java WebSphere app to demonstrate how to use Dynatrace Operator to monitor apps in a cloud-native fashion and gain insights from app metrics, without requiring modifying any source code or adding any source-based plugins.
Dynatrace Operator offers a convenient and frictionless deployment at scale by utilizing cloud-native concepts like Webhooks and init-containers to instrument applications like the Java WebSphere app. While this blog purely focuses on app metrics, Dynatrace would provide a lot of additional value, like end-to-end distributed tracing, real-time problem detection based on DAVIS AI, code-level visibility to troubleshoot issues, and many more.
Requirements
The following items are required if you'd like to duplicate this process in your own environment:
- An OpenShift cluster (this example uses OpenShift Local)
- Cluster-admin privileges in OpenShift (to install operators)
- A Dynatrace Free Trial Account
- Any app stack or framework supported by OneAgent
- A bash-compatible shell environment such as RHEL, macOS, or WSL (this example uses Fedora)
- The OpenShift Client (oc) CLI
Note: This guide focuses on the command line, but you can use the admin console if you prefer a GUI. This could also be used as a workaround in a non-supported client environment.
Install the Demo App
Let's begin with installing the demo app that OneAgent will monitor. App Mod(ernization) Resorts (not to be confused with App Mon(itoring)) is a simple Java app designed to run on an IBM WebSphere Application Server. The OpenLiberty Operator will assist by creating and managing the OpenShift deployment, services, and routes required to host the app.
Log in to the OpenShift cluster as kubeadmin or another user with cluster-admin privileges:
$ oc login -u kubeadmin https://api.crc.testing:6443
For a clean environment, make a directory to house the YAML files that will be created. You can keep these as a reference for a production deployment later or remove them afterward.
$ mkdir appmon-files && cd appmon-files
Create the subscription YAML file, which will be used to install the certified OpenLiberty Operator from OperatorHub. Download or paste the YAML spec below into a new file named olo_subscription.yaml.
apiVersion: operators.coreos.com/v1alpha1
kind: Subscription
metadata:
 name: openliberty-operator
 namespace: openshift-operators
spec:
 channel: beta2
 installPlanApproval: Automatic
 name: open-liberty-certified
 source: certified-operators
 sourceNamespace: openshift-marketplace
Install OpenLiberty Operator by creating the olo_subscription.yaml in OpenShift. This command will create the subscription in the openshift-operators namespace (redundantly set in the subscription.yaml):
$ oc apply -f olo_subscription.yaml -n openshift-operators
Next, create a new project/namespace to house the demo app. This will also switch the current namespace to ol-demo-app (a failsafe in case -n <namespace> is omitted):
$ oc new-project ol-demo-app
Label the namespace with the key/value label monitor: appMonitoring. Dynatrace operator will be configured later to only monitor namespaces with this particular label:
$ oc label namespace ol-demo-app monitor=appMonitoring
The next step is to create an openlibertyapplication Custom Resource (CR) YAML file. Download or paste the YAML spec below into a file named app-mod-withsslroute_cr.yaml:
apiVersion: apps.openliberty.io/v1beta2
kind: OpenLibertyApplication
metadata:
 name: appmod
spec:
 expose: true
 route:
 termination: reencrypt
 path: '/resorts'
 host: 'modresort.apps-crc.testing'
 applicationImage: quay.io/jmanning/ol-demo-app:latest
 pullPolicy: Always
 service:
 annotations:
 service.beta.openshift.io/serving-cert-secret-name: appmod-svc-tls
 certificateSecretRef: appmod-svc-tls
 port: 9443
Edit the above YAML file to adjust the URL set in spec.route.host to your cluster domain (the hard-coded URL will work for OpenShift Local).
Create the openlibertyapplication CR in the ol-demo-app namespace:
$ oc apply -f app-mod-withsslroute_cr.yaml -n ol-demo-app
The application pod should now be running and showing a ready status:
$ oc get pods -n ol-demo-app
NAME READY STATUS RESTARTS AGE
appmon-64548758f4-hhlpb 1/1 Running 0 6s
You can retrieve the route used to publish the demo app and follow the URL to test the app (the following URL applies when using OpenShift local):
$ oc get route -n ol-demo-app
NAME HOST/PORT PATH SERVICES PORT TERMINATION WILDCARD
appmon modresort.apps-crc.testing /resorts appmon 9443-tcp reencrypt None
Paste the URL obtained from the route into your browser (don't forget to append the /resorts path to the end of the URL).
Proceed through the self-signed certificate warning page, and you should be greeted with the Mod Resorts web app.
It may take a few moments for the application pod to start, so you may see the "application unavailable" page at first. Just keep refreshing (F5 in most browsers) until the application comes up.
Demo App Resources
- The container image is accessible from quay.io/jmanning/ol-demo-app:latest
- The Dockerfile, .war file, and cr.yaml files are found at https://github.com/jsm84/openliberty-operator-ocpz under ol-app-install/.
- The source code for the Mod Resorts app is located at https://github.com/IBM/appmod-resorts
Install Dynatrace Operator
The next step is to install the operator, which will leverage Dynatrace OneAgent in the ol-demo-app pod to make app metrics, traces and metadata available to the Dynatrace platform.
Log in to Dynatrace with a free trial account.
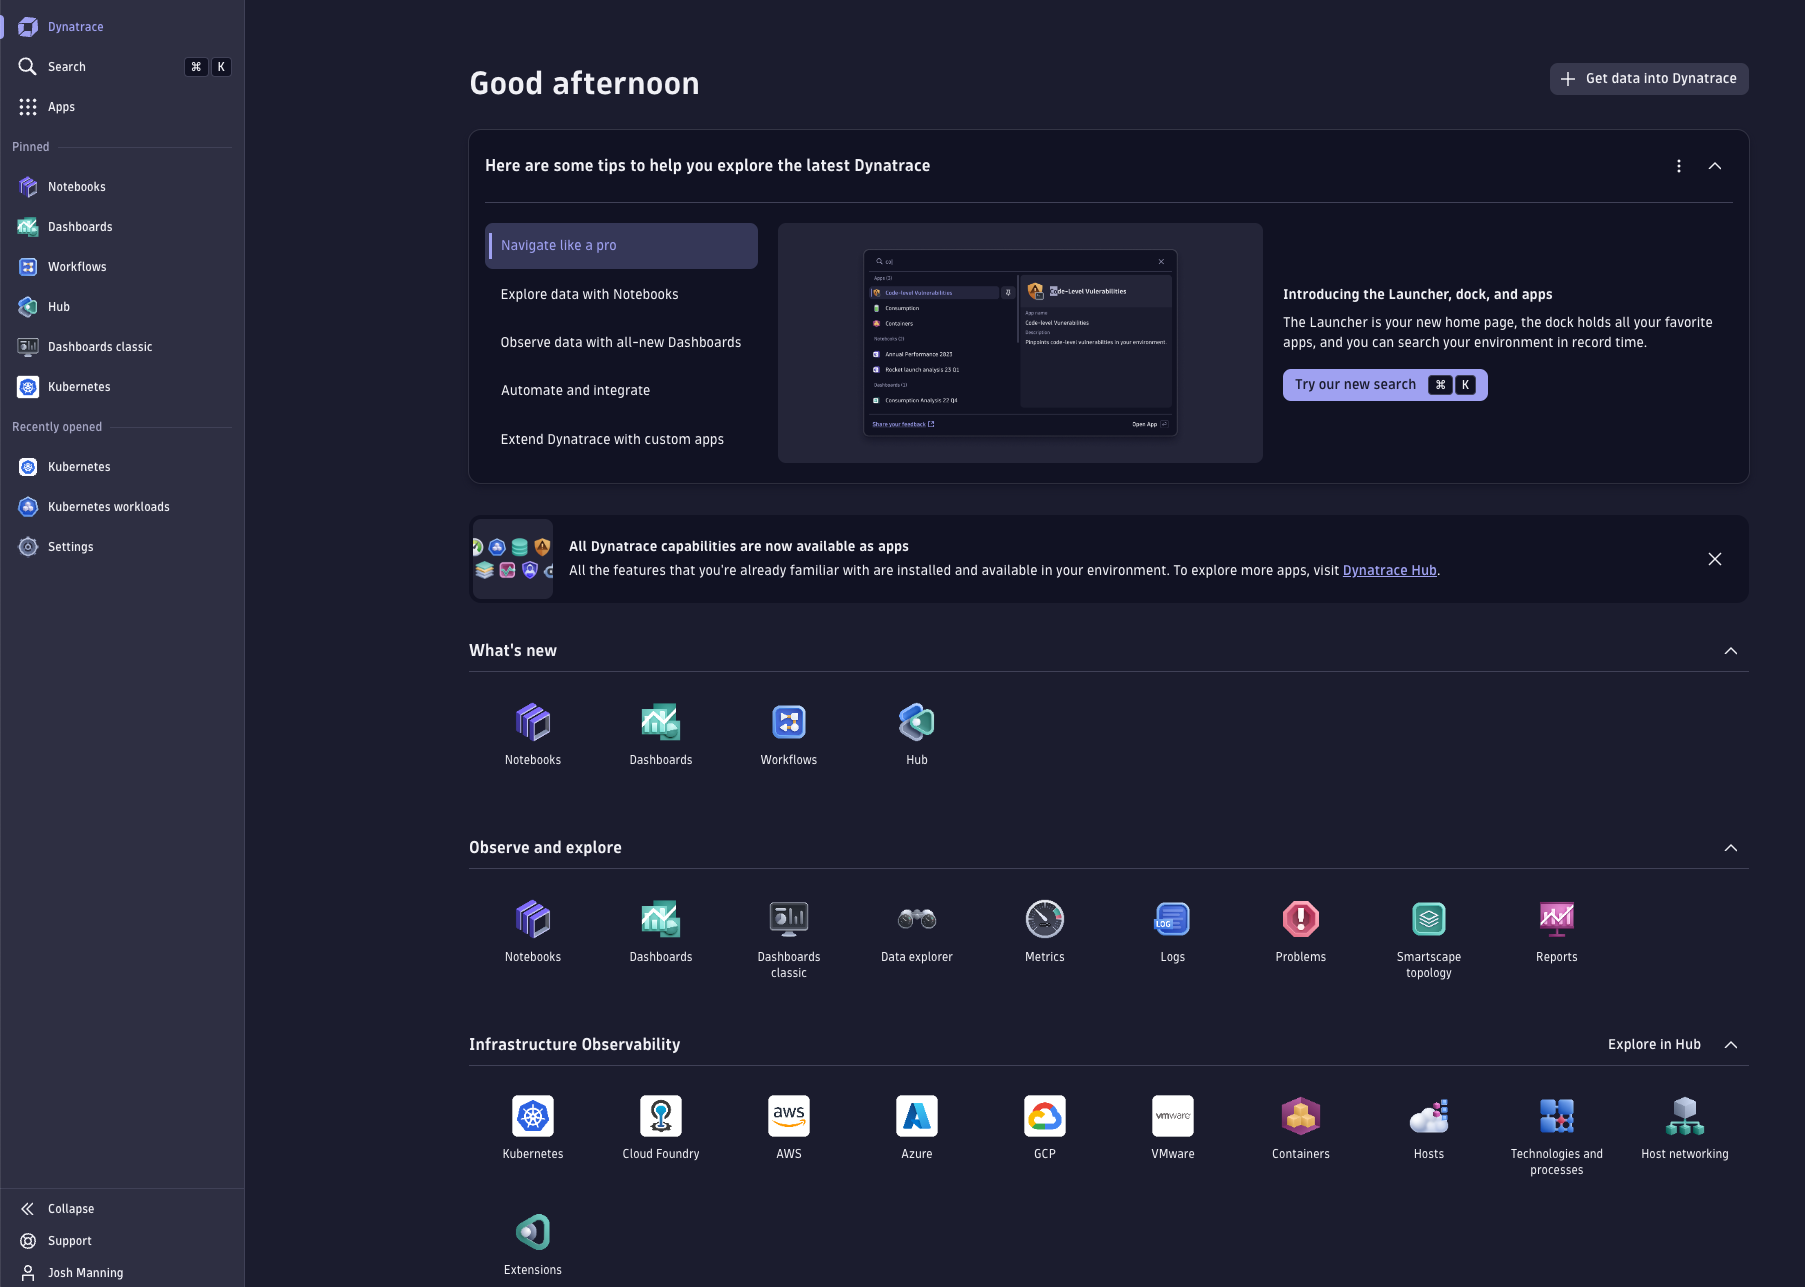
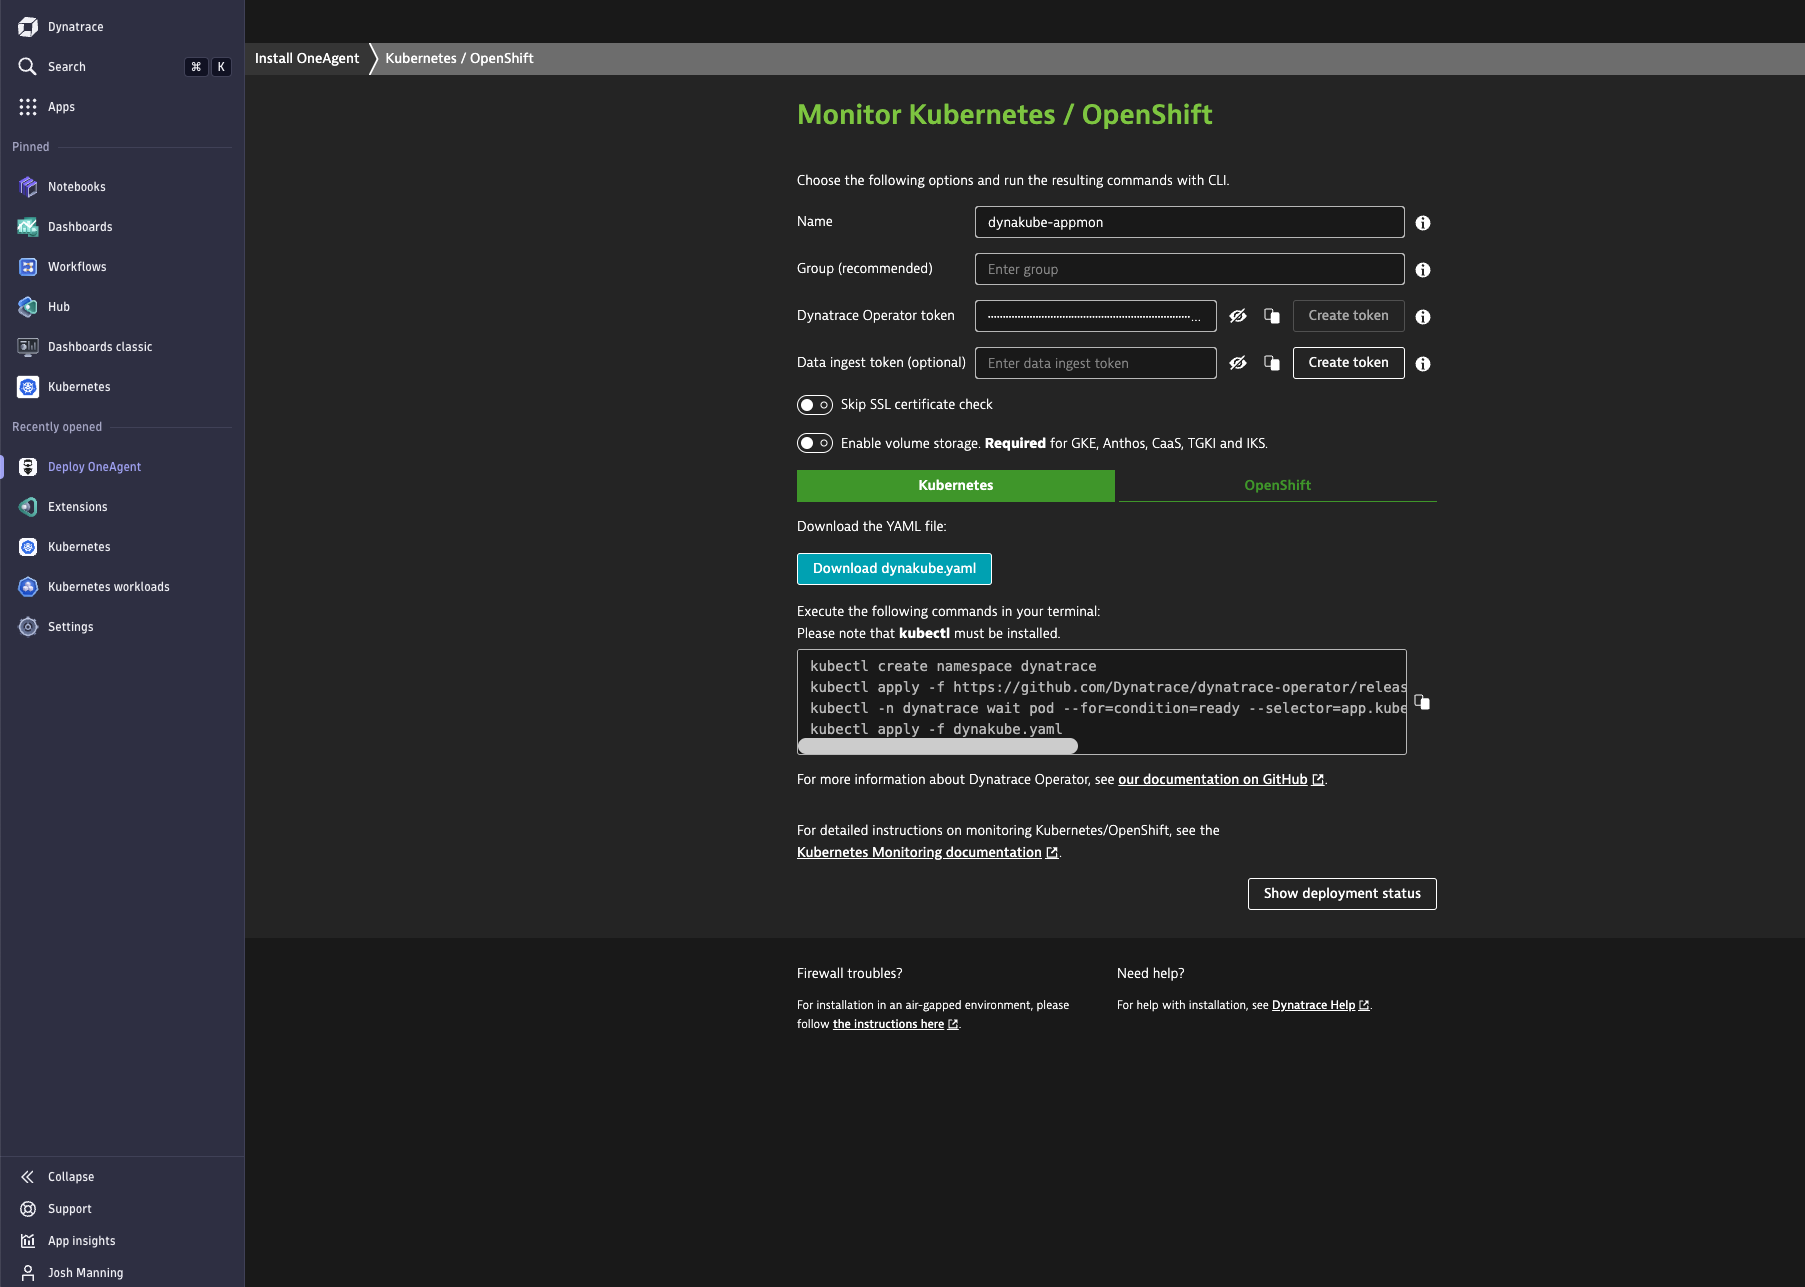
Once you've accessed your live environment, select and open Kubernetes App within the Infrastructure section or hit CTRL-K and search for kubernetes. Select Connect automatically via Dynatrace Operator in the top bar.
Fill out the web form as follows:
- Name the cluster / Dynakube (Custom Resource). dynakube-appmon is used in this example.
- Click Create token at the bottom of the page to create a Dynatrace Operator token.
The Operator access token will be displayed in a masked manner. Copy and paste the token into a password manager or secure text document.
The token is only available upon generation and can not be accessed at a later time.
While we could follow the instructions in the Dynatrace UI to deploy the Dynatrace Operator on OpenShift, we will take an alternative approach in this sample and use OperatorHub to benefit from automatic Operator updates.
Note the environment id for your Dynatrace instance. This is located in the web page URL as https://<environment-id>.live.dynatrace.com/.
Switch to the openshift-operators namespace, which will hold all resources related to the Dynatrace Operator. This helps to check that things end up in the desired place:
$ oc project openshift-operators
Create the subscription YAML file that will deploy the certified Dynatrace Operator from OperatorHub. Download or paste the YAML spec below into a file named dto_subscription.yaml:
apiVersion: operators.coreos.com/v1alpha1
kind: Subscription
metadata:
 labels:
 operators.coreos.com/dynatrace-operator.openshift-operators: ""
 name: dynatrace-operator
 namespace: openshift-operators
spec:
 channel: alpha
 installPlanApproval: Automatic
 name: dynatrace-operator
 source: certified-operators
 sourceNamespace: openshift-marketplace
Install Dynatrace Operator by creating the subscription on OpenShift. This command will create the dto_subscription.yaml object in the openshift-operators namespace (also set in the subscription):
$ oc apply -f dto_subscription.yaml -n openshift-operators
Confirm that the Dynatrace-operator pods are running:
$ oc get pods -n openshift-operators
Export a new shell variable containing the API token value recorded previously:
$ export APIKEY=<apiTokenValue>
Create a secret named dynakube-appmon in the openshift-operators namespace. This will contain the token value $APIKEY in secret fields named apiToken and paasToken.
$ oc create secret generic dynakube-appmon --from-literal=apiToken=$APIKEY \
 --from-literal=paasToken=$APIKEY \
 -n openshift-operators
Note: The secret name in the previous command does matter, as it must match the name of the CR that gets created in the next step.
To create the dynakube-appmod CR, which will trigger the operator, download or paste the following YAML spec into a file named dynakube-appmon_cr.yaml.
Replace ENVIRONMENTID in the YAML file with your previously noted Dynatrace environment ID.
apiVersion: dynatrace.com/v1beta1
kind: DynaKube
metadata:
 name: dynakube-appmon
 annotations:
 feature.dynatrace.com/automatic-kubernetes-api-monitoring: "true"
spec:
 apiUrl: 'https://ENVIRONMENTID.live.dynatrace.com/api'
 namespaceSelector:
 matchLabels:
 monitor: appMonitoring
 oneAgent:
 applicationMonitoring:
 useCSIDriver: false
 activeGate:
 capabilities:
 - routing
 - kubernetes-monitoring
Trigger the Dynatrace operator by creating the CR on the cluster. This will create the dynakube-appmon custom resource in openshift-operators namespace:
$ oc apply -f dynakube_cr.yaml -n openshift-operators
Check the dynakube-appmon custom resource for healthiness (to check that there are no errors):
$ oc get dynakube -n openshift-operators
Finally, restart the ol-demo-app pod so that the Dynatrace webhook can inject the initContainer for OneAgent. As a note, --all is used below despite there being only one pod in the namespace (as the pod name can't be predetermined):
$ oc delete pod --all -n ol-demo-app
Check the pod's YAML output to see if OneAgent was installed in the pod. The following command looks for the initContainer named install-oneagent, which gets injected by the Dynatrace webhook:
$ oc describe pods -n ol-demo-app | grep install-oneagent
 name: install-oneagent
 name: install-oneagent
App Observability Walkthrough
OpenShift (Kubernetes) Observability
With the demo app being monitored and having OneAgent injected, metrics will be sent to the Dynatrace API. Switching context back to the Dynatrace web session, click to expand Application & Microservices in the left pane, and then select Kubernetes workloads. There you will find an overview of all your deployed workloads.
By entering appmod in the filter bar on top of the page, all other apps will be filtered out, and info will be visible that gives you an instant overview of key information like the Status or the number of pods the app runs on.
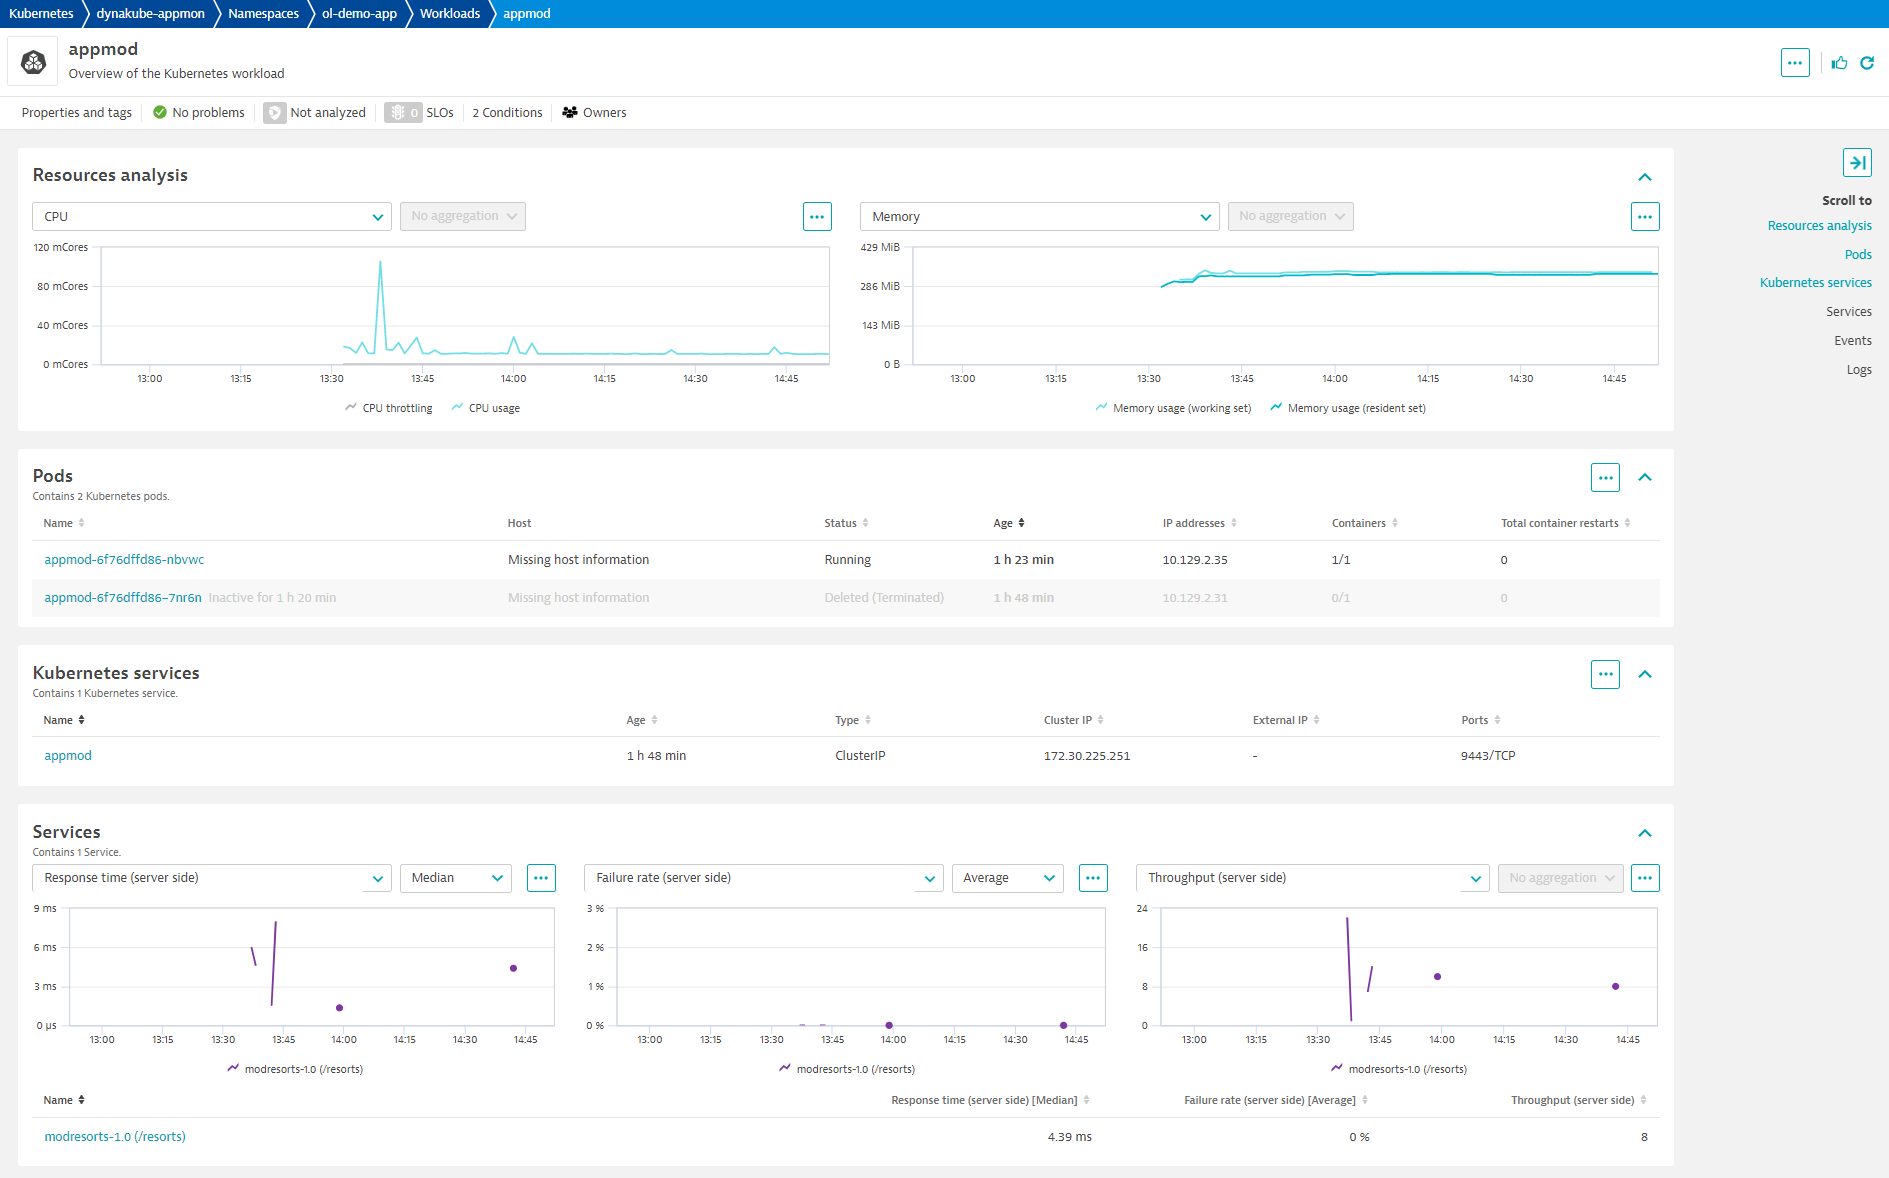
Click the blue text link under Name to view all details about the workload app stack. Here you get an overview of the resource utilization, pods, and health from a service perspective.
In the Service section, you can see how our sample app's response time, failure rate, and throughput evolve. Remember that you need to generate some requests to your app. Open the page again in your browser after Dynatrace is deployed to generate some datapoints to display here.
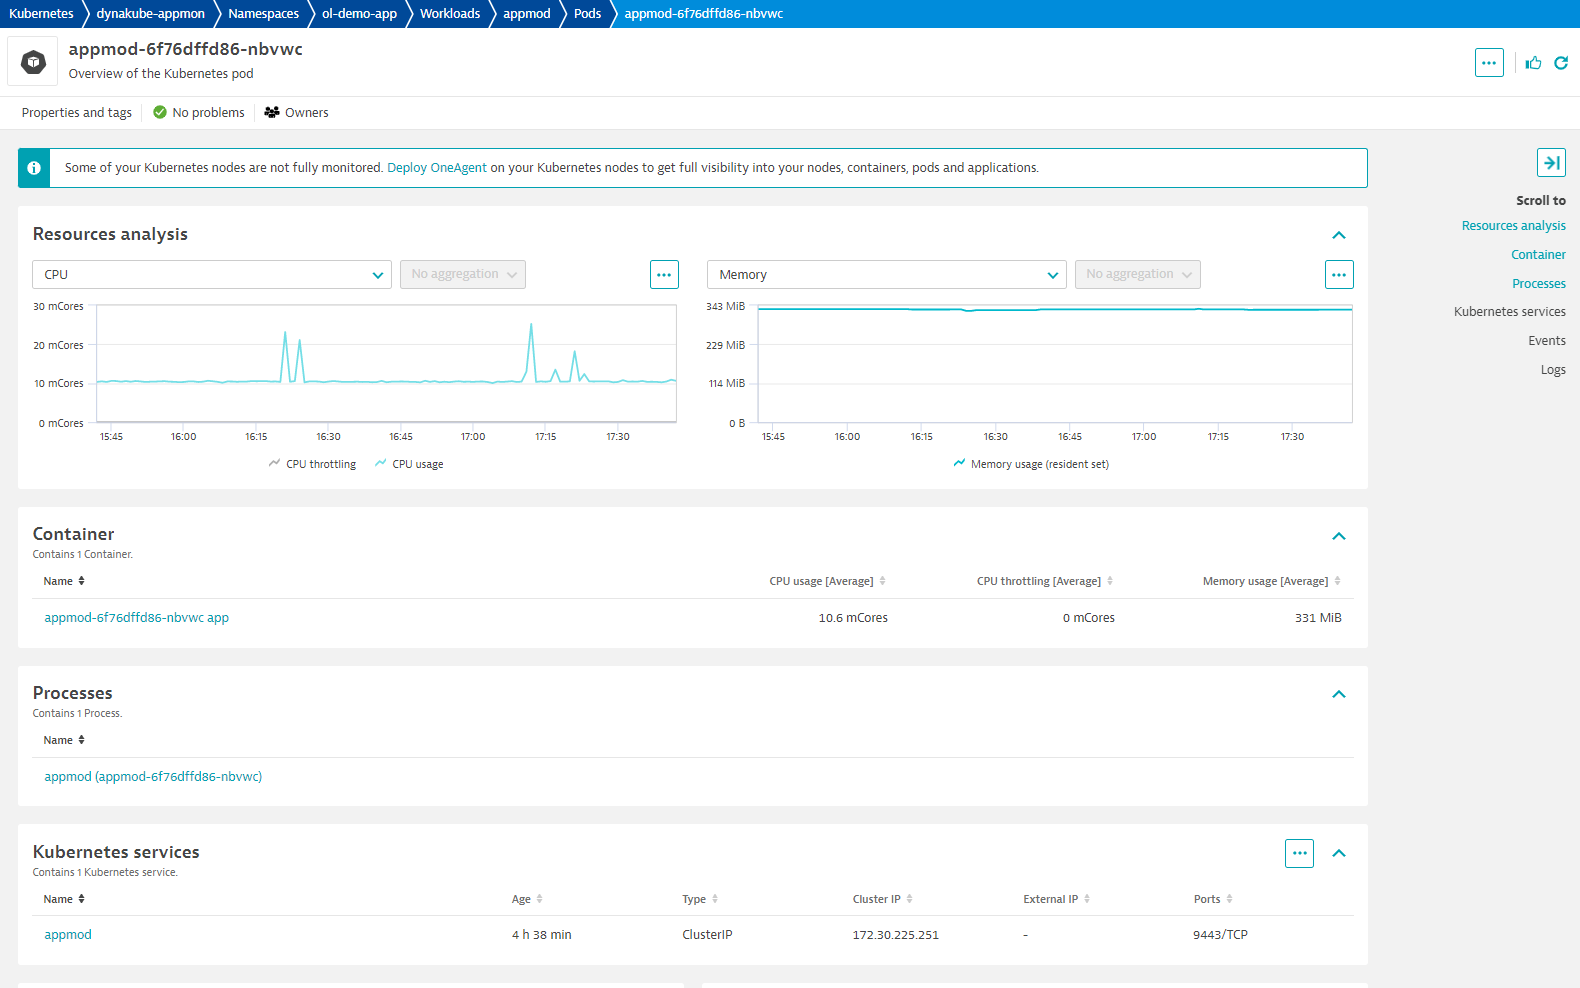
Click on the blue link below Pods to see all the details for a pod, then find the Process section and click on the blue appmod entry there.
Java Observability
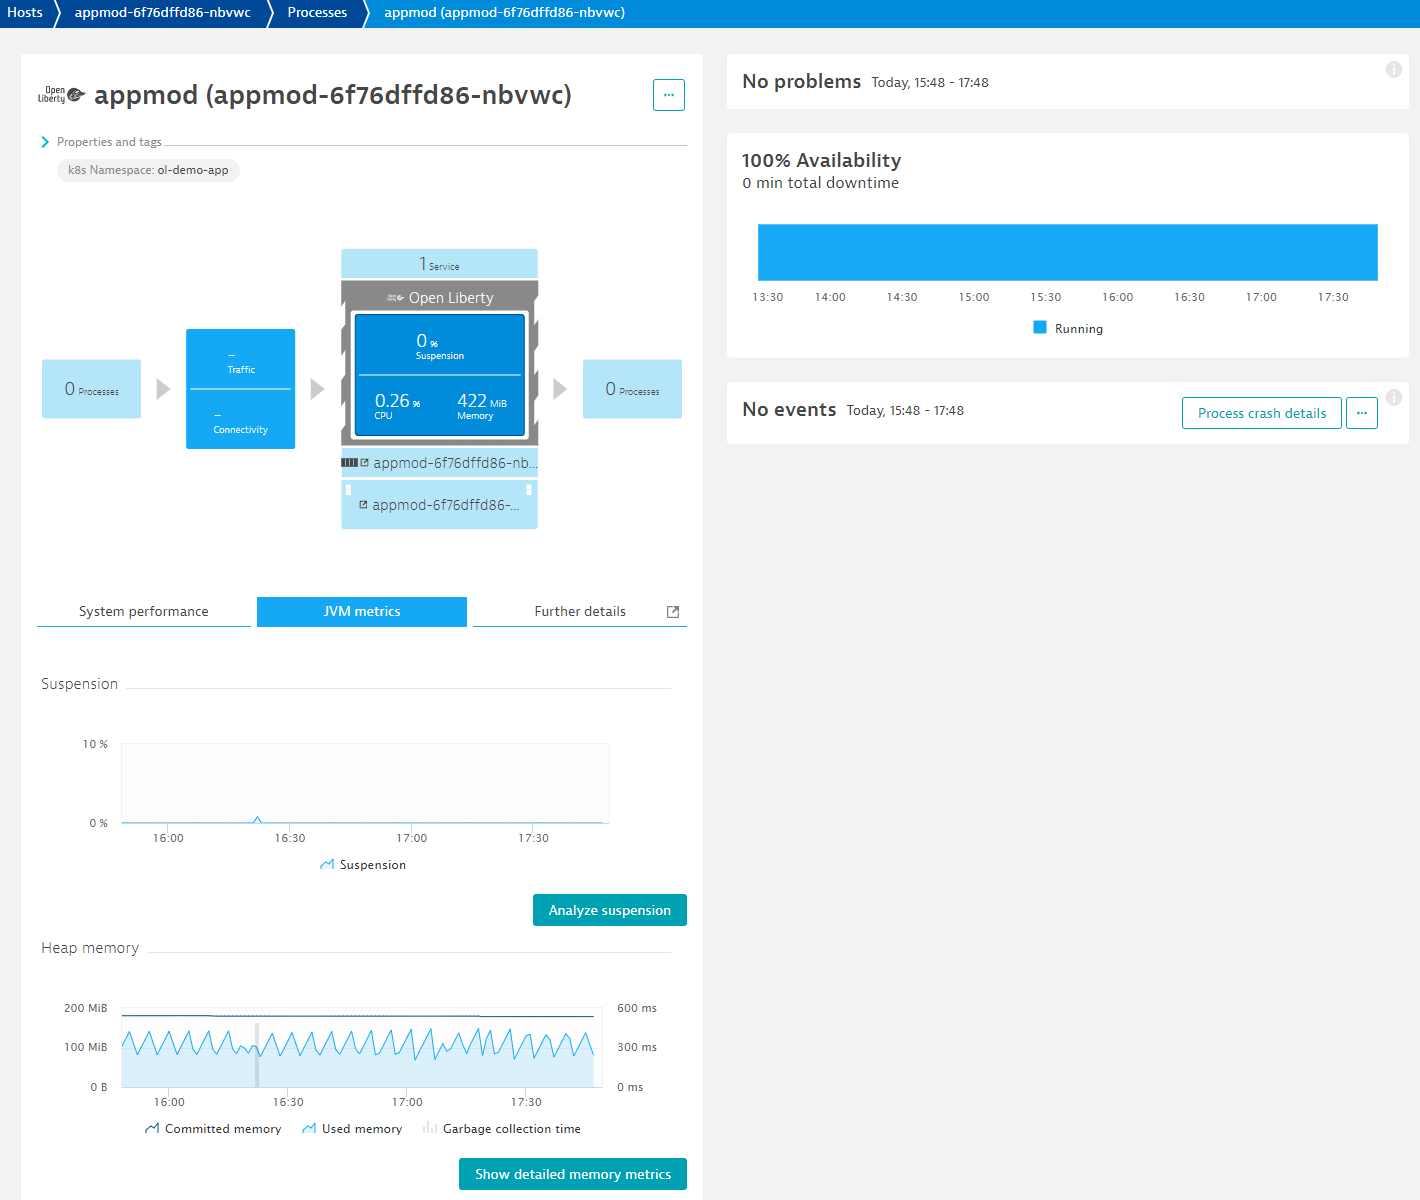
Next, scroll down and click the blue text link in the Process list that guides you through all the detailed app metrics for OpenLiberty. Here you can see that Dynatrace also automatically detected the underlying technology used by OpenLiberty.
By clicking on JVM metrics right below the info graphic, you'll see detailed metrics showing how Garbage collection suspension, heap memory and threads evolve.
By opening Further details, you can find more detailed insights into Java-managed memory.
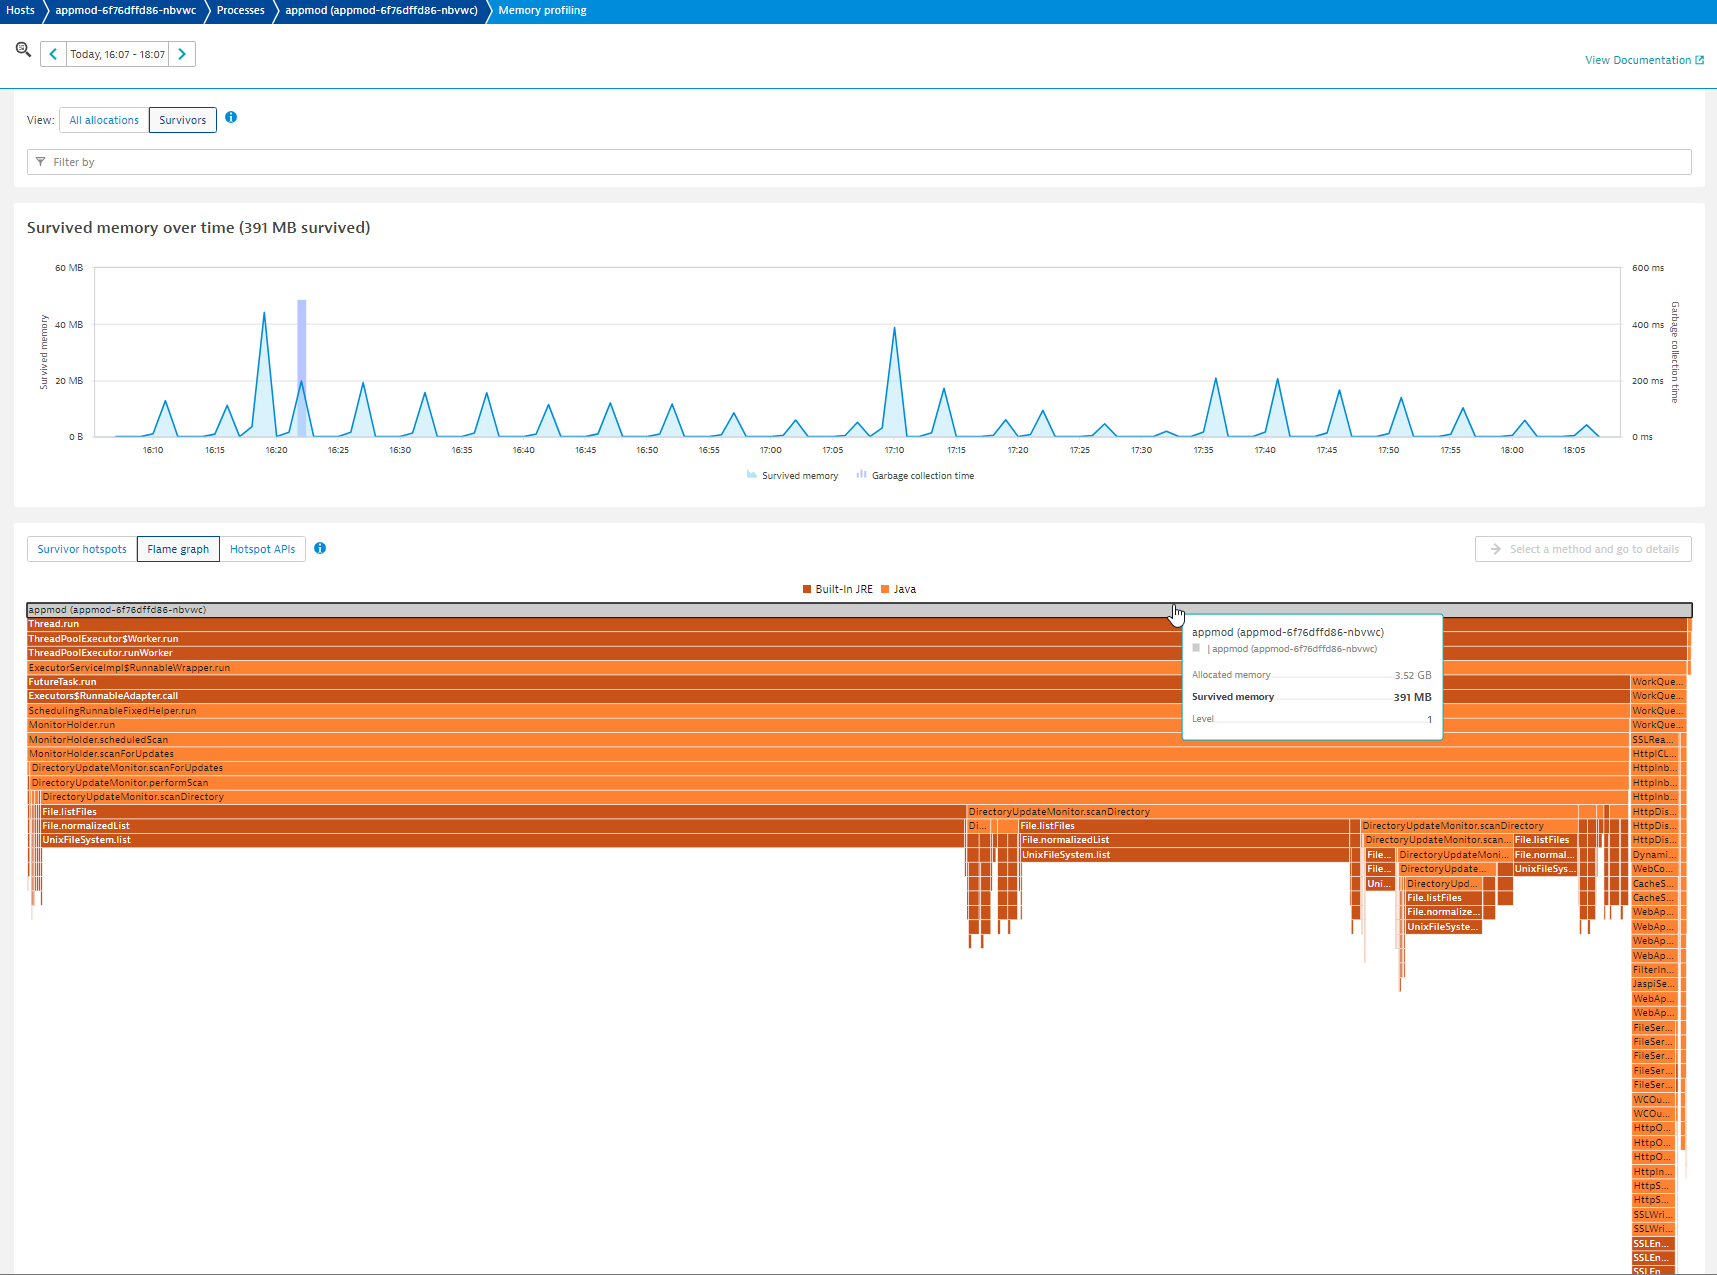
By clicking on Analyze suspension, you can even dive into Dynatrace memory profiling capabilities. These analyze which objects contribute most to memory allocation and help you understand which objects often survive garbage collection (GC) cycles and contribute the most to GC suspension.
Web App Monitoring
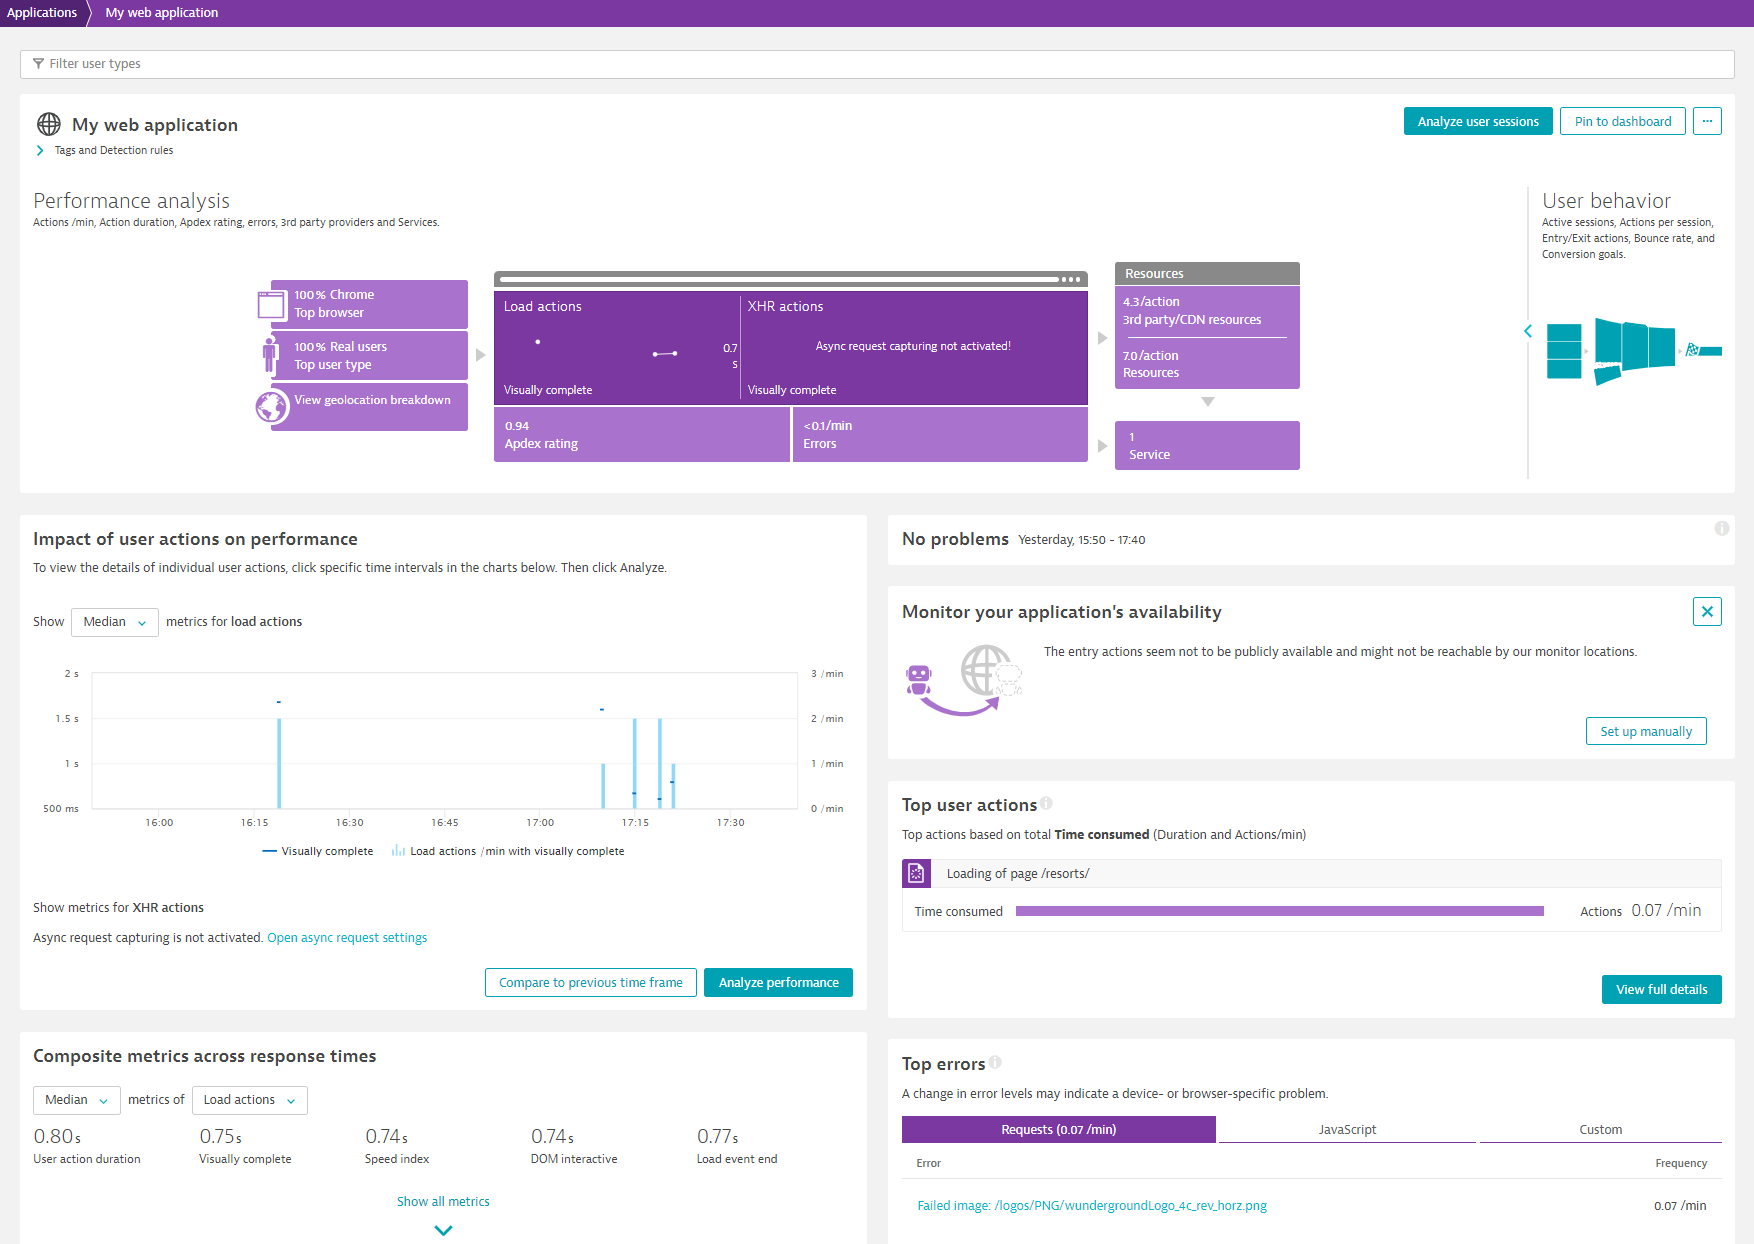
Dynatrace Application Monitoring starts with the end user device, so you can see how the application performs on the client side within the web browser.
To investigate metrics from there, open the Frontend entry in the left menu.
There you will find an entry for My web application with key info like the Apdex rating, the number of user actions, and the Visual complete time (meaning how long it took to render the visual part of the web page in the browser).
From this section, you can also see how key metrics evolve. If your demo app is available from the Internet, you can even set up a synthetic availability check for it.
Wrap Up
Dynatrace Operator supports cloud-native full stack injection for x86_64 OpenShift clusters, which encompasses Host Observability as well as App Observability.
OpenShift cluster metrics are provided with a separate add-on called ActiveGate, which runs exclusively on x86_64 as a kube client to gather metrics. ActiveGate can also be an API gateway to communicate all metrics back to the Dynatrace API.
All shown metrics can also be directly found and plotted via the Dynatrace Data explorer, put on any dashboard, accessed via API, or used in anomaly detection settings.
Dynatrace Operator is one of the most popular operators available in OperatorHub for obvious reasons. Stay tuned for more partner highlights from the Red Hat OpenShift Ecosystem.
About the authors
More like this
AI in telco – the catalyst for scaling digital business
Simplify Red Hat Enterprise Linux provisioning in image builder with new Red Hat Lightspeed security and management integrations
Scaling For Complexity With Container Adoption | Code Comments
Edge computing covered and diced | Technically Speaking
Browse by channel
Automation
The latest on IT automation for tech, teams, and environments
Artificial intelligence
Updates on the platforms that free customers to run AI workloads anywhere
Open hybrid cloud
Explore how we build a more flexible future with hybrid cloud
Security
The latest on how we reduce risks across environments and technologies
Edge computing
Updates on the platforms that simplify operations at the edge
Infrastructure
The latest on the world’s leading enterprise Linux platform
Applications
Inside our solutions to the toughest application challenges
Virtualization
The future of enterprise virtualization for your workloads on-premise or across clouds

